the Creative Commons Attribution 4.0 License.
the Creative Commons Attribution 4.0 License.
Organic-walled dinoflagellate cyst biostratigraphy of the upper Eocene to lower Oligocene Yazoo Formation, US Gulf Coast
Marcelo Augusto De Lira Mota
Guy Harrington
Tom Dunkley Jones
New data from a continuously cored succession, the Mossy Grove core, near Jackson, central Mississippi, recovered ∼137 m of marine clays (Yazoo Formation), spanning ∼5 Ma and including the critical Eocene–Oligocene transition (EOT) event. These clay-rich sediments yield well-preserved calcareous microfossil and palynomorph assemblages. Here, we present a new organic-walled dinoflagellate cyst (dinocyst) biostratigraphic framework, including the recognition of 23 dinocyst bioevents. These are integrated with new age constraints based on calcareous nannofossil biostratigraphy and a reassessment of the existing radiometric dates and planktonic foraminiferal biostratigraphy, permitting the establishment of a robust and significantly refined age model for the core. According to this new age model, a major increase in sedimentation rate – from ∼2.1 to ∼4.7 cm kyr−1 – is observed at a core depth of ∼89.1 m (∼34.4 Ma). In the new age model the section is significantly older than previously thought, by up to 1 Ma, with the Eocene-Oligocene boundary (∼33.89 Ma) placed ∼34 m below the level previously identified. With these more accurate age estimates, future isotopic and palaeoecological work on this core can be more precisely integrated with other, globally distributed records of the EOT.
- Article
(6801 KB) - Full-text XML
- BibTeX
- EndNote
The Eocene–Oligocene transition (EOT: ∼34.0 Ma; Westerhold et al., 2014) represents a phase of accelerated climatic and biotic change that began before and ended after the Eocene-Oligocene boundary (EOB: 33.89 Ma). It is one of the most significant changes in the long-term background climate state over the past 110 Ma (Friedrich et al., 2012; Zachos et al., 2001). Across the whole EOT there is a ∼1.2–1.5 ‰ increase in benthic δ18O (e.g. Kennett and Shackleton, 1976; Kennett, 1977; Miller and Mountain, 1987; Zachos et al., 1996, 1999, 2001; Lear et al., 2000; Coxall et al., 2005), interpreted to represent ice expansion equivalent to 60 % to 110 % of the present Antarctic ice-sheet volume (Cramer et al., 2011) and a 3–4 ∘C deep-water cooling (Cramer et al., 2011; Lear et al., 2003). This ice expansion resulted in ∼50–60 m of eustatic sea level fall (Cramer et al., 2011; Pekar et al., 2002), and it is associated with an estimated 3–6 ∘C cooling across latitudes (Lear et al., 2008; Liu et al., 2009). The presence of distinct rapid positive steps in high-resolution benthic foraminiferal oxygen isotope (δ18O) records are interpreted as representing at least two pulses of accelerated ice-sheet growth (Coxall et al., 2005; Scher et al., 2011). These steps appear to be orbitally paced, with a duration of 40 kyr, separated by a 300–400 kyr interval of relative stability, or plateau (Coxall et al., 2005; Scher et al., 2011; Westerhold et al., 2014). The first step in δ18O records is thought to be associated with relatively limited ice-sheet growth (Katz et al., 2008; Lear et al., 2008), being mainly driven by significant global cooling (Houben et al., 2018; Katz et al., 2008; Miller et al., 2008; Wade et al., 2012). The second step in δ18O is thought to be dominated by ice-volume expansion (Katz et al., 2008; Lear et al., 2008), a sharp deepening of the ocean carbonate saturation depth (Coxall et al., 2005), and a massive and abrupt increase in weathering flux from East Antarctica (Scher et al., 2011). The geological rapidity of the EOT is, most likely, driven by the non-linear dynamics of Antarctic ice-sheet growth in response to a gradual decline in atmospheric greenhouse gas (carbon dioxide, CO2) forcing (DeConto et al., 2008; DeConto and Pollard, 2003; Pagani et al., 2011; Pearson et al., 2009). These same positive feedbacks also resulted in a strong hysteresis, with the climate state becoming locked into a long-term icehouse state with large continental-scale ice sheets on Antarctica since the earliest Oligocene (Cramer et al., 2011; Lear et al., 2003; Zachos et al., 2001). Furthermore, the EOT is associated with biotic turnover in plants and animals across a range of latitudes and environments (Prothero, 1994). Although not comparable to the “big five” mass extinction events (Raup and Sepkoski, 1982), detailed micro-palaeontological records show that substantial extinction and ecological reorganization is closely coupled to the EOT (Cotton and Pearson, 2012; Coxall and Pearson, 2007; Dunkley Jones et al., 2008; Houben et al., 2013; Moore et al., 2015; Pearson et al., 2008, 2009). These include the extinction of the planktonic foraminiferal Family Hantkeninidae, which marks the EOB (Nocchi et al., 1988; Pearson et al., 2008; Premoli Silva and Jenkins, 1993), significant extinction in shallow-water benthic foraminifera (Cotton and Pearson, 2012; Pearson et al., 2008), radiolaria (Kamikuri and Wade, 2012), and community overturning in the calcareous phytoplankton (Bordiga et al., 2015; Dunkley Jones et al., 2008; Persico and Villa, 2004; Villa et al., 2008).
Dinocysts have been widely used in biostratigraphic and palaeoenvironmental studies (e.g. Bujak and Williams, 1985; Duxbury and Vieira, 2018; Kothe, 1990; Powell, 1992; Pross et al., 2010; Stover et al., 1996; Vieira et al., 2018), including several detailed studies of the EOT (e.g. Brinkhuis and Biffi, 1993; Brinkhuis, 1994; Jaramillo and Oboh-Ikuenobe, 1999; Van Mourik et al., 2001; Oboh-Ikuenobe and Jaramillo, 2003; Houben et al., 2012, 2013, 2018). A major compilation of Late Cretaceous–Neogene calibrated dinocyst bioevents, from both Northern Hemisphere and Southern Hemisphere, demonstrates a strong climatic control on the timing of bioevents, which are commonly diachronous (Williams et al., 2004) . Dinocyst biostratigraphic studies thus need to consider comparable realms in similar climatic zones when selecting appropriate dinocyst bioevents (Williams and Bujak, 1985). There are existing dinocyst biostratigraphic studies of the Eocene–Oligocene from both the Northern Hemisphere (Brinkhuis and Biffi, 1993; Bujak and Mudge, 1994; Egger et al., 2016; Mudge and Bujak, 1994; Śliwińska et al., 2012; Thomsen et al., 2012; Wilpshaar et al., 1996) and the Southern Hemisphere (Bijl et al., 2018; Wilson, 1988). At the Massignano Eocene–Oligocene Global Stratotype Section and Point (GSSP), there are two successive influxes of cool-water high-latitude organic-walled dinoflagellate cyst (dinocyst) species (Brinkhuis and Biffi, 1993), the first of which correlates directly with the EOB and the second with the onset of a more severe cold episode and inferred sea level lowstand. In parallel, quantitative analysis of dinocyst distribution patterns from the “Massicore”, central Italy (Van Mourik and Brinkhuis, 2005), revealed biotic turnover potentially associated with latitudinal and climatic zone changes through the Eocene–Oligocene transition. In the Massicore, dinocyst assemblages are interpreted to represent substantial cooling on the first step, with little subsequent change on the second step (Houben et al., 2012). Records from the Antarctic Margin show decreasing dinocyst species diversity through the Eocene and at the EOB (Mohr, 1990), interpreted as the progressive development of cold surface waters. More recent dinocyst studies (Houben et al., 2013) document a sudden regime shift in zooplankton-phytoplankton interactions in the Southern Ocean associated with the earliest Oligocene glaciation of Antarctica, likely triggered by cooling, ice-sheet expansion, and sea-ice formation.
Eocene to Oligocene strata are well represented in outcrop and the shallow subsurface across the Gulf Coastal Plain of Mississippi and Alabama, as well as in the offshore systems of the northern Gulf of Mexico (Hosman, 1996). In these areas, dinocyst assemblages have an instrumental importance for site-to-site stratigraphic correlation and biochronology (Jaramillo and Oboh-Ikuenobe, 1999). Existing palynological work from five sites across southern Mississippi and Alabama allowed the correlation of stratigraphic sequences through the upper Eocene and the lower Oligocene (Jaramillo and Oboh-Ikuenobe, 1999). They observed a maximum flooding surface, estimated to be ∼100 kyr older than the EOB and a lower Oligocene lowstand system tract, most likely correlated to the global eustatic sea level lowstand coincident with the Earliest Oligocene Glacial Maximum (EOGM; Jaramillo and Oboh-Ikuenobe, 1999). However, this study is not well integrated into biostratigraphic schemes based on the calcareous plankton or detailed oxygen isotope stratigraphy, both of which are important in generating robust correlations of dinocyst biohorizons into global records of the EOT. More recently, coupled sea level and palaeotemperature records from the neritic succession of the Saint Stephens Quarry (SSQ), Alabama (Houben et al., 2018), are interpreted to show cooling, minor ice-sheet expansion, and temperature-driven turnover in dinocysts in the first step, while the second step is characterized by a significant hiatus, potentially associated with a major sea level fall, with no meaningful change in palynological assemblages. Here we seek to extend this work by adding new biostratigraphic data from a site, the Mossy Grove core, Jackson, Mississippi, which recovered a continuous stratigraphic succession through the uppermost Eocene and into the lower Oligocene. This core recovered a complete sequence through the marine clays of the Yazoo Formation, central Mississippi (Dockery III et al., 1991). This clay yields palynomorph assemblages with high abundance and diversity, as well as an exceptional preservation. The Mossy Grove core is also substantially expanded compared to the St. Stephens Quarry section, with sedimentation rates estimated to be more than 10 times higher through the EOT (St. Stephens Quarry ∼0.4 cm kyr−1; Mossy Grove ∼4.7 cm kyr−1). This current study includes illustrated descriptions of the assemblages from the Mossy Grove core and dinocyst stratigraphic range data for the purpose of establishing a more resolved regional biostratigraphic scheme for the Gulf of Mexico and the US Gulf Coast.
While considerable attention has focused on EOT sections in southwestern Alabama (Jaramillo and Oboh-Ikuenobe, 1999; Katz et al., 2008; Mancini, 1979; Miller et al., 1993, 2008; Quaijtaal and Brinkhuis, 2012; Tew and Mancini, 1995; Wade et al., 2012) and southeastern Mississippi (Jaramillo and Oboh-Ikuenobe, 1999; Quaijtaal and Brinkhuis, 2012; Tew and Mancini, 1995), where the Yazoo Formation is lithologically heterogenous and divided into multiple constituent members, in central and western Mississippi the Yazoo Formation is a thick and relatively homogeneous succession of calcareous clays. For micro-palaeontological and palaeoenvironmental studies, these successions have the potential to yield some of the best marine records of the late Eocene in all of North America, if not globally. The relative lack of study of these successions appears to stem from early problems in determining a robust chronostratigraphic framework and the failure to constrain the EOB within the upper Yazoo Formation (Obradovich et al., 1993). The purpose of this study is to provide a detailed dinocyst biostratigraphic framework through an expanded EOT succession from the US Gulf Coast, as the basis for future studies of community change, extinction, and palaeoenvironments based on these assemblages. Such studies of the response of organic-walled cyst-producing dinoflagellate communities across this interval are important for an understanding of the nature of the reorganization of planktonic ecosystems through this major transition.
The Gulf Coastal Plain (Fig. 1) is one of the largest physiographic provinces in North America. In the subsurface the Mississippi embayment consists of a structurally complex basin with thick Jurassic-to-Holocene deposits (Cushing et al., 1964; Hosman, 1996). Within these sequences, the most continuous Paleogene successions are found between central and southern Mississippi and Alabama (Cushing et al., 1964; Hosman, 1996).
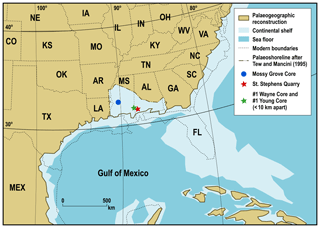
Figure 1Palaeogeographic reconstruction showing location of the Mossy Grove, #1 Wayne and #1 Young cores, as well as St. Stephens Quarry outcrop. Main North American palaeogeography at ∼35 Ma follows Deep Time Maps™ (https://deeptimemaps.com/, last access: 16 October 2018).
The upper Eocene to lower Oligocene stratigraphy of the US Gulf Coast is split into two groups (Fig. 2) – the Jackson (∼ upper Eocene) and Vicksburg (∼ lower Oligocene) groups (Cushing et al., 1964; Hosman, 1996). The contact between these groups is commonly indistinguishable on a lithologic basis, but they have distinct faunal assemblages (Hosman, 1996). The lithology, and constituent formations within these groups, also varies geographically across Mississippi and Alabama, reflecting relative positions along the palaeoshelf and proximity to river outflows. The upper middle Eocene of Mississippi consists of discontinuous and lenticular beds of lignitic-to-carbonaceous fine-to-medium quartz sand, silt, and clay. These sediments constitute the non-marine Cockfield Formation, the youngest continental deposits of the Eocene on the Gulf Coastal Plain (Cushing et al., 1964; Hosman, 1996). The upper Eocene Jackson Group overlies the Cockfield Formation, and it represents the last extensive marine inundation within the Mississippi embayment (Cushing et al., 1964; Hosman, 1996). The Jackson Group consists of two major facies: to the west of the Gulf Coastal Plain, towards Texas, a shallow-water marine facies with beach sands, clays, and occasional volcanic tuffs, whilst to the east, in the central part of the Gulf Coastal Plain (Mississippi and Alabama), the group becomes more fossiliferous and argillaceous as deeper-water clays dominate (Cushing et al., 1964; Hosman, 1996). The two main lithostratigraphic units within the Jackson Group are the highly fossiliferous glauconitic sandy marls of the basal Moodys Branch Formation and the calcareous fossiliferous dark-grey to blue clays of the Yazoo Formation (Cushing et al., 1964; Hosman, 1996). The Yazoo Formation has four well-characterized members in eastern Mississippi and Alabama: the North Twistwood Creek Member (marl and calcareous clay), the Coccoa Sand Member (sandy marl), Pachuta Marl Member (glauconitic fossiliferous marls and sandy hard limestones), and the Shubuta Member (calcareous clays with concretions) (Cushing et al., 1964; Hosman, 1996). In central Mississippi, in the region of the Mossy Grove core, the entire Yazoo Formation is represented by an undifferentiated marine clay unit – the Yazoo Formation (Dockery III et al., 1991). Towards northern Mississippi this group occurs as a non-marine clastic facies, with evidence of lacustrine, palustrine, and lagoonal sedimentation, and the Yazoo Formation becomes undifferentiated and relatively homogeneous (Cushing et al., 1964; Hosman, 1996). The Oligocene series begins with the marine fossiliferous glauconitic clay and sandy clay of the Red Bluff Formation, overlain by the fossiliferous and laminated sands of the Forest Hill Formation. Westward, this unit presents some lenses of lignite and lignitic clay. Above the Forest Hill Formation is the fossiliferous, granular, white crumbly limestone of the Bumpnose Formation (Cushing et al., 1964; Hosman, 1996). The Bumpnose Formation in Alabama and Florida is the equivalent of the Red Bluff–Forest Hill sequence in central and southern Mississippi (Hosman, 1996). Finally, overlying all these units is the Marianna–Mint Spring Formation, which consists of fossiliferous and porous limestone, glauconitic marl, and calcareous clay (Cushing et al., 1964; Hosman, 1996). In northern Mississippi, no evidence of Oligocene sedimentation is observed (Cushing et al., 1964; Hosman, 1996).
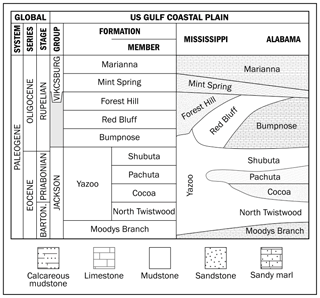
Figure 2Simplified stratigraphic correlation chart of upper Eocene to lower Oligocene sedimentary rocks in the Mississippi–Alabama area (modified from Pasley and Hazel, 1995; Tew and Mancini, 1995; Hosman, 1996).
The upper Eocene to lower Oligocene lithostratigraphy outlined above has been interpreted within two distinct sequence stratigraphic models. The first argues that the Yazoo–Bumpnose contact coincides with a maximum flooding surface throughout the region (Baum and Vail, 1988; Echols et al., 2003; Jaramillo and Oboh-Ikuenobe, 1999; Loutit et al., 1988; Mancini and Tew, 1991; Tew, 1992). The second, and more recent (Miller et al., 2008), supports the association of the Yazoo–Bumpnose contact (Dockery, 1982) with a low stand sequence boundary, which is linked to the increasing δ18O (Zachos et al., 2001, 1996, 2008) and global eustatic sea level fall (Coxall et al., 2005; Pekar et al., 2002) during the EOT. Sequence stratigraphic interpretations are difficult because of the depositional and lithologic variability across this region, and the difficulties in establishing robust, mostly biostratigraphic, tie points between key sections (Miller et al., 2008). Some of the key sections, from both outcrops and cores, which have been used for regional stratigraphic correlation, chronostratigraphy, and sequence stratigraphy, are shown in Fig. 3.
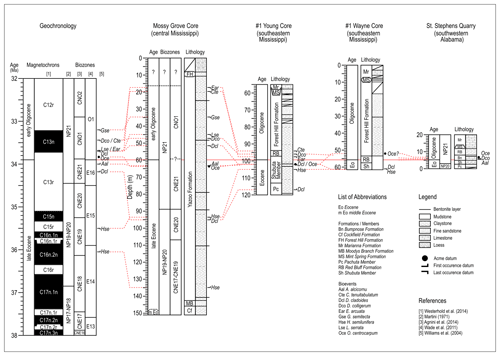
Figure 3Stratigraphic correlation between the Mossy Grove core and the other three sections from Mississippi and Alabama (Jaramillo and Oboh-Ikuenobe, 1999). Lithology at the Mossy Grove follows Dockery III et al. (1991) and the timescale for all sections follows Westerhold et al. (2014). See discussion about dinocyst bioevents in Sect. 3.2.
Even at the St. Stephens Quarry section, southwestern Alabama, which is a widely studied reference for the EOT (Katz et al., 2008; Miller et al., 2008; Wade et al., 2012), establishing a robust biostratigraphy and sequence stratigraphy has been difficult (Miller et al., 2008). The low abundance and generally poor preservation of hantkeninids in the shallow-water Gulf Coast successions make the accurate placement of their last occurrence (LO) problematic (Miller et al., 2008). This difficulty is further aggravated by the reworking of upper Eocene calcareous microfossils up into lowest Oligocene sediments as a result of the major regression across the EOT (Bybell and Poore, 1983). Nevertheless, a middle-to-late Priabonian age was assigned to the Pachuta Member at SSQ, based on the LO of R. reticulata, upper part of nannofossil zone NP19-20 (Miller et al., 2008). The Shubuta Member has a late Priabonian age correlated to the lower part of NP21 zone, the interval between E16 and the lower part of O1 zones, and the upper part of magnetochron C13r (Miller et al., 2008). The Red Bluff–Bumpnose sequence was dated as late Priabonian to early Rupelian age and can be correlated to the middle part of NP21 zone, the lower to middle part of O1 zone and the upper part of C13n magnetochron (Miller et al., 2008).
3.1 Mossy Grove borehole
The Mossy Grove borehole was drilled in September 1991 at Mossy Grove, Hinds County, Mississippi. It consists of a 161.6 m (530 ft) continuously cored succession, with near full recovery (Dockery III et al., 1991). At its base it recovered ∼5.5 m of the upper Cockfield Formation (161.6 to 156.1 m; 530 to 512 ft, 18 ft thick), overlain by ∼3.7 m of the Moodys Branch Formation (156.1 to 152.4 m; 512 to 500 ft, 12 ft thick), and then a thick 140.9 m succession of the Yazoo Formation (152.4 to 11.6 m; 500 to 38 ft, 462 ft thick). At the top of the core, overlaying the Yazoo Formation, 3.0 m of terrestrial lignites of the Forest Hill Formation were recovered (11.6 to 8.5 m; 38 to 28 ft, 10 ft thick), which in turn was overlain by a 8.5 m thick (28 ft) cover of Pleistocene loess. To improve the chronology of the upper Yazoo Formation, 40Ar∕39Ar absolute dating was undertaken from a number of bentonite layers at four sites (Obradovich et al., 1993; Priddy, 1960), including seven layers within the Mossy Grove core, from which two dates were recovered (Obradovich et al., 1993; Obradovich and Dockery III, 1996).
Establishing a robust age model for the Mossy Grove core has required significant effort and the integration of dinocyst, calcareous nannofossil, and radiometric dating techniques. Initial age models were based on planktonic foraminifera assemblage data (Fluegeman, 1996; Fluegeman et al., 2009), but due to low planktonic foraminifera abundances, especially in the upper part of the core (< 91.4 m; 300 ft), this age model relied upon poorly calibrated secondary markers. For instance, the direct placement of the EOB, based on the last occurrence of the Hantkeninidae, is problematic as the record of Hantknenina alabamensis, the only hantkeninid species found in the core, is poor and discontinuous above ∼86.6 m (284 ft). The last occurrence of Turborotalia cerroazulensis, expected to be ∼0.1 Myr older than the EOB and the Hantkeninidae extinction, occurs ∼7.3 m (24 ft) higher than the last occurrence of H. alabamensis.
Radiometric 40Ar∕39Ar dating is significantly offset from the existing planktonic foraminifera biochronology. Bentonite layers at ∼26.5 m (87 ft) and ∼84.4 m (277 ft) were dated to 33.40 and 34.36 Ma, respectively (Obradovich and Dockery III, 1996), whereas foraminifera biochronology places these bentonites at ∼33.87 and 35.33 Ma, respectively (Fluegeman et al., 2009), an offset of between ∼0.5 and 1 Myr. This mismatch has implications for the accurate placement of the EOB in this section; assuming a constant sedimentation rate within the interval between the bentonites, radiometric dating would place the boundary at ∼56.7 m (186 ft), which is ∼30.2 m (99 ft) lower than the existing foraminiferal estimate of ∼26.5 m (87 ft) (Fluegeman et al., 2009).
3.2 Palynological preparation techniques
Altogether, 112 sediment samples were collected from the Mossy Grove core at ∼1.2 m (4 ft) intervals, between ∼17 and 152 m deep (55 and 499 ft). A mass of 20 g from each sediment sample was broken into pieces, ∼5 mm in diameter, using a pestle and mortar. This was followed by a set of acid treatments, including (1) 40 % HCl for 30 min to remove carbonates; (2) 60 % HF for 24 h to disaggregate the rock matrix; (3) sieving of the residues at 10 µm through a nylon mesh sieve to retain the HF effluent from the material; (4) a second HCl treatment to remove any precipitate formed during stage 2; and (5) a final sieving, as per stage 3. The material was then subjected to oxidation (70 % HNO3 for exactly 2 min) to remove pyrite, inorganic debris, and any unstructured organic material from the residues. Another sieving step was done to remove any HNO3 effluent. A final cleaning treatment was undertaken with a combination of domestic and industrial detergents. Using a glass swirling dish and centrifugal swirling techniques, palynomorphs in each sample were subsequently concentrated and Bismark brown was added to make them more visible with light microscopy. Finally, the samples were sieved into two size fractions, 10–30 µm (concentrating spores and pollen) and > 30 µm (concentrating dinocysts), and then mounted on separate 22 mm×22 mm coverslips, which were glued to a glass slide using Norland optical adhesive. In this work, only the coarse fraction content of each slide was analysed. A pilot survey of these slides revealed that the acid and oxidizing technique yielded higher diversity than their non-acid and non-oxidizing counterparts (Burgess, 2015). All slides were stored in the collection of the School of Geography, Earth and Environmental Sciences, University of Birmingham.
3.3 Dinocyst assemblage characterization
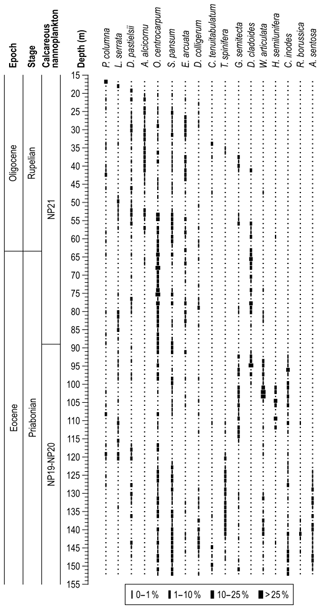
With a Zeiss transmitted-light microscope, at least 200 dinocyst specimens were counted in each sample, along with the respective number of spores, pollen, algae (Prasinophyceae and Chlorophyceae), zoomorphs/zooclasts, phytoclasts, and amorphous organic matter. Once 200 specimens were counted, the remaining fields of the coverslip were scanned for very rare dinocysts. Only palynomorphs that were more than 50 % complete and not obscured either by air bubbles or organic debris were considered. We used the following abundance scheme: 0 % – barren (B); 0 %–1 % – trace (T); 1 %–10 % – few (F); 10 %–25 % – common (C); > 25 % – abundant (A). Preservation was qualitatively categorized as good (G), moderate (M) or poor (P).
3.4 Nannofossil assemblage characterization
Samples for the analysis of calcareous nannofossils were taken at ∼1.2 m (∼4 ft) intervals throughout the Mossy Grove core. Samples were prepared using the simple smear slide technique (Bown and Young, 1998) and observed with standard transmitted cross-polarized light (XPL) microscopy (Zeiss AxioScope at 1250× magnification). Calcareous nannofossil preservation and abundances were logged for all samples with taxonomy following Dunkley Jones et al. (2009). Major biohorizons were identified based on the presence and absence of key marker taxa following the biostratigraphic scheme of Agnini et al. (2014).
4.1 Dinocyst distribution
Nearly all the core samples contain abundant and very well-preserved dinocysts, with only a few samples being scarce or rare. A semiquantitative distribution of all dinocysts recognized in the investigated section is shown in Fig. 4. Spiniferites species dominate in most samples and account for ∼50 % of the overall count, followed by Hystrichokolpoma (mainly H. rigaudiae and H. salacia) and Operculodinium (mainly O. centrocarpum) (∼6 % each); Charlesdowniea (C. coleothrypta) (∼4 %); Heteraulacacysta (mainly H. porosa); Lingulodinium (mainly L. Machaerophorum) and Cleistosphaeridium (mainly C. ancyreum) (3 % each); and Cordosphaeridium, Dinopterygium (D. cladoides), Glaphyrocysta, Homotryblium (mainly H. floripes), Saturnodinium (S. pansum), and Thalassiphora (mainly T. fenestrata) (∼2 % each). These genera account for nearly 90 % of all dinocysts counted in the section, although there are other significant occurrences of Achomosphaera alcicornu, Dapsilidinium pastielsii, Enneadocysta arcuata, and Hystrichosphaeridium tubiferum. Several influxes of relative abundances higher than 25 % are observed: C. fibrospinosum (∼142.3 m depth; 467 ft), D. cladoides (∼94.8 m depth; 311 ft), H. leptalea (∼66.8 m depth; 219 ft), H. porosa (∼58.4 m depth; 191.5 ft), H. floripes (∼118.0 m depth; 387 ft), H. tubiferum (∼91.1 m depth; 299 ft), L. machaerophorum (∼107.0 m depth; 351ft), O. centrocarpum (∼68.0 and ∼75.3 m depth; 223 and 247 ft), T. fenestrata (∼83.8 and ∼85.0 m depth; 275 and 279 ft), and W. articulata (∼102.1 m depth; 335 ft).
4.2 Nannofossil biostratigraphy
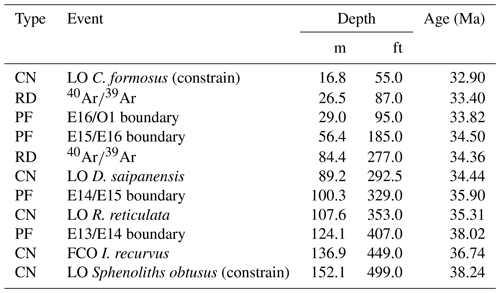
For this study we present the first calcareous nannofossil biostratigraphy of the Mossy Grove core, with biohorizons calibrated to the global zonation scheme of Agnini et al. (2014). We updated these absolute ages (Agnini et al., 2014) to the timescale of Westerhold et al. (2014). Three of these bioevents constrain the base and top of the core: the absence of Sphenolithus obtusus at the base of the core indicates that the section bottom (152.1 m; 499 ft) is younger than 38.24 Ma; the first common occurrence (FCO) of Isthmolithus recurvus was identified at ∼136.9 m (449 ft), which corresponds to 36.74 Ma; and the LO of Coccolithus formosus, whose occurrence spans from ∼50.0 m (164 ft) to ∼16.8 m (55 ft), indicates that the top of the section is older than 32.90 Ma. Moreover, two other LO events have been detected within the core: Discoaster saipanensis (∼89.2 m; 292.5 ft) and Reticulofenestra reticulata (∼107.6 m; 353 ft), indicating ages of 34.44 and 35.31 Ma, respectively. All biostratigraphic and radiometric ages are presented in the Table 1.
Table 1List of bioevents, biohorizons, and calibrated ages, updated to the timescale of Westerhold et al. (2014). Legend: CN – calcareous nannofossils (this study); PF – planktonic foraminifera (Fluegeman et al., 2009); RD – radiometric dating (Obradovich et al., 1993; Obradovich and Dockery III, 1996).
4.3 Dinocyst biostratigraphic framework
Dinocysts dominate the palynological assemblages in the studied material. In total, we identified 52 genera and 70 species, with nomenclature following Williams et al. (2017) and references therein. A full species list is provided in Appendix 1. The rich and well-preserved dinocyst assemblages provide the basis for a detailed assessment of upper Eocene dinoflagellate biostratigraphy in this succession, which is developed with reference to dinocyst biostratigraphic data from offshore eastern Canada (Egger et al., 2016; Williams, 1975, 1977), the Gulf Coast Plain (Houben et al., 2018; Jaramillo and Oboh-Ikuenobe, 1999), offshore Florida (VanMourik et al., 2001), the Norwegian and Greenland seas (Eldrett et al., 2004; Manum, 1976; Manum et al., 1989; Williams and Manum, 1999), the North Sea (Bujak and Mudge, 1994; Gradstein et al., 1992; Hansen, 1977; Heilmann-Clausen and Van Simaeys, 2005; Mudge and Bujak, 1996; Śliwińska et al., 2012), the Hampshire Basin (Costa et al., 1976), the central Mediterranean region (Brinkhuis, 1994; Brinkhuis and Biffi, 1993; Van Mourik and Brinkhuis, 2005; Wilpshaar et al., 1996), northwestern Europe (England, Belgium, and Germany; Costa and Downie, 1979; Kothe, 1990), the Tasmanian Gateway (Stickley et al., 2004), and the wider Northern Hemisphere (Williams, 1993). Although there have been studies of dinocyst biohorizons across the EOB interval in Gulf Coast sections from Alabama (e.g. Jaramillo and Oboh-Ikuenobe, 1999; Houben et al., 2018), these do not have the stratigraphic coverage of the upper Eocene or the quality of dinocyst preservation provided by the Mossy Grove core material. Age assignments are based on the global compilation of age-calibrated bioevents (Williams et al., 2004), with a total of 23 potentially useful dinocyst biohorizons recognized in the Mossy Grove succession (Table 2), including 7 first occurrences (FO), 1 first common occurrence (FCO), 14 last occurrences (LO), and 1 last common occurrence (LCO) event.
Table 2List of dinocyst bioevents recorded in the section. Reliability rating and absolute ages were assigned for selected events. Timescale follows Westerhold et al. (2014). The last column presents ages calculated from the age–depth model provided by this study (see Sect. 3.4). Legend: FO represents first occurrence; LO represents last occurrence; FCO represents first common occurrence; LCO represents last common occurrence; A represents acme; * represents age available only after the timescale of Pälike et al. (2006); H represents high reliability; L represents low reliability; and M represents moderate reliability.
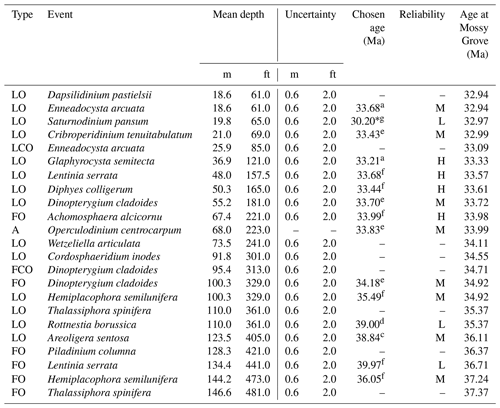
References for chosen ages: a – Brinkhuis and Biffi (1993), b – Brinkhuis et al. (2003), c – Bujak and Mudge (1994), d – Eldrett et al. (2004), e – Jaramillo and Oboh-Ikuenobe (1999), f – Williams et al. (2004), and g – Williams and Manum (1999).
At least 15 of the 23 biohorizons within the Mossy Grove succession could be correlated to other mid-latitude areas in the Northern Hemisphere, and we discuss each of these – from the base of the succession upwards – in the text below. Our estimation of the reliability of each bioevent as highly, moderately, or lowly reliable; it is based on a combination of the clarity of taxonomic definition of a species or genus, as well as the number of reports of the associated biohorizon at other localities, and the consistency of stratigraphic position between them. The estimated age of each bioevent is also given, along with a rationale for the chosen calibration. Ages are first provided according to the original assignment and timescale but then, for consistency, are all updated to the Westerhold et al. (2014) timescale, which is given in brackets. Where there is evidence for latitudinal diachroneity of an event, we preferentially choose age calibrations from locations closest to the study site. Standard nannoplankton (Agnini et al., 2014; Martini, 1971) and foraminiferal (Berggren et al., 1995; Berggren and Pearson, 2005; Wade et al., 2011) biozonation schemes were used when discussing selected dinocyst bioevents.
The palynological assemblages of the Mossy Grove core show strong evidence for sea level fall associated with the EOT interval manifest in the form of increased flux of terrestrial plant material but also in the influx of clearly weathered and reworked acritarchs and continental palynomorphs towards the top of the succession. This includes reworked Late Cretaceous taxa such as Achomosphaera ramulifera, Cannosphaeropsis sp., Chatangiella sp., Cymososphaeridium phoenix. Dinogymnium sibiricum, Litosphaeridium siphoniphorum, and Palaeohystrichophora infusorioides, as well as early and middle Eocene dinocyst taxa Hystrichosphaeridium tubiferum (Bujak and Mudge, 1994; Mudge and Bujak, 1996), Wetzeliella articulata (Bujak and Mudge, 1994; Mudge and Bujak, 1996), Piladinium columna Bujak and Mudge, 1994; Mudge and Bujak, 1996), and Diphyes ficusoides (Gradstein et al., 1992). The distribution patterns of Eocene dinocysts through the core indicate local reworking of older middle and lower Eocene marine sediments from around the margin of the Mississippi embayment, especially through the EOT and towards the top of the succession. This reworking makes the confident placement of some last occurrences difficult, especially where there is some existing discrepancy between published age assessments of these bioevents as being either late Eocene or early Oligocene. Here we interpret consistent presence of a taxa, followed by a continuous stratigraphic absence or sporadic occurrences, as representing a genuine LO event. Sporadic occurrences are reported as local reworking from exposed middle to upper Eocene sediments during regional sea level fall.
FO Hemiplacophora semilunifera. The first occurrence of this species is at ∼143.6 m (471 ft). From this point upwards, it is present in most samples, with abundances gradually increasing, especially in the interval ∼119.2–99.7 m (391–327 ft). Based on data from equatorial and Southern Hemisphere sites (Stickley et al., 2004; Williams et al., 2004), this event has been tentatively dated between 36.00 and 41.40 Ma (36.05 to 41.20 Ma), in middle and higher latitude sites, respectively.
FO Lentinia serrata. This species first occurs at ∼133.8 m (439 ft), although there is a short interval after this occurrence in which the taxon is not observed. This event was identified in central Italy (Brinkhuis and Biffi, 1993) sections in the lowermost Adi interval zone, which corresponds to the calcareous nannoplankton zone NP21, the planktonic foraminifera zone P18, and the top of the magnetostratigraphic chron C13r. This agrees with an age of 33.64 Ma (33.84 Ma) assigned in equatorial latitudes (Williams et al., 2004). Although these data seem consistent, dating from the mid-latitudes in the Northern Hemisphere (Williams et al., 2004) points to an age of 40.00 Ma (39.97 Ma) for this bioevent.
LO Areoligera sentosa. The last occurrence of this species is clearly observed at ∼124.1 m (407 ft). This event is considered synchronous and an excellent chronostratigraphic marker in the entire North Sea Basin to Norwegian–Greenland seas region (Bujak and Mudge, 1994; Costa et al., 1976; Heilmann-Clausen and Van Simaeys, 2005; Mudge and Bujak, 1996), with an age assignment in the lower part of E7 dinocyst zone and, more precisely, at the E7a/E7b subzone boundary (Bujak and Mudge, 1994; Mudge and Bujak, 1996), which identified this event just between NP16 and NP17 nannoplankton zones and in the lower part of planktonic foraminifera zone P14.
LO Rottnestia borussica. Almost all occurrences of this species at the study site are below ∼137.5 m (451 ft), except for an isolated occurrence at ∼110.6 m (363 ft). Although this isolated appearance may reflect patterns of ecological exclusion, interpreting it as LO event would be less consistent with the age model. Therefore, we conclude that the isolated upper occurrence represents reworking processes and constrain the range of this taxa to a short interval in the lower part of the succession (below 137.5 m). In the Hampshire Basin (Aubry, 1983, 1985) and the North Sea (Bujak and Mudge, 1994; Mudge and Bujak, 1996) this event was dated as late Bartonian, calibrated with the upper part of the dinocyst subzone E7b (Bujak and Mudge, 1994; Mudge and Bujak, 1996), nannoplankton zone NP17, and planktonic foraminifera zone P14, whilst in Italy its range is reported to extend into the lower Rupelian (Brinkhuis and Biffi, 1993). A late Bartonian age of 39.00 Ma (39.00 Ma) is consistent within the Norwegian–Greenland seas (Eldrett et al., 2004; Eldrett and Harding, 2009) and with the southwestern margin of the Rockall Plateau, North Atlantic, where it was dated as middle Eocene and calibrated within the dinocyst zone within zone IVb (Costa and Downie, 1979); however, it is distinct from middle Priabonian age assigned in the central Danish basin (Heilmann-Clausen and Van Simaeys, 2005), calibrated with the middle part of the nannoplankton zone NP19/20; in offshore Florida (Van Mourik et al., 2001), it is found within planktonic foraminifera zone P16. Based on correlation to nannofossil biostratigraphy within the Mossy Grove core, we can constrain this event to be younger than 39.00 Ma, such that this taxa ranges into the topmost Bartonian.
LO Hemiplacophora semilunifera. The last occurrence of H. semilunifera is clearly identified at ∼100.9 m (331 ft), above which the taxa is absent, except for very rare isolated and widely spaced occurrences. This event was dated in the Mediterranean (Brinkhuis and Biffi, 1993; Wilpshaar et al., 1996) with an early Oligocene age, correlated to the top of the Gse dinocyst zone (Brinkhuis and Biffi, 1993), the nannoplankton NP21, and foraminifera P18 biozones. Nevertheless, estimates from middle latitudes in the Southern Hemisphere (Williams et al., 2004) indicate that it occurred much earlier, during the NP19-20 biozone and between the P15 and P16 biozones, which an assigned age of 35.20 Ma (35.49 Ma).
FO Achomosphaera alcicornu. The first occurrence of this taxon at the study site was detected at ∼66.8 m (219 ft), and it is consistently observed until the top of the section. Early estimates from Danish sections dated this bioevent as Danian, placing it in the upper part of the S. inornata subzone (Hansen, 1977). In high latitudes of the Southern Hemisphere, this event was dated at 35.70 Ma (Williams et al., 2004; 35.82 Ma). However, estimates from lower latitudes, such as the Mediterranean (Brinkhuis and Biffi, 1993; Wilpshaar et al., 1996) and the Equator (Williams et al., 2004), identified this event within the nannoplankton NP21 and foraminifera P17 biozones, and within the magnetostratigraphic chron C13r, with an assigned age varying between 33.76 (Williams et al., 2004; 33.99 Ma) and 34.00 Ma (Wilpshaar et al., 1996; 34.29 Ma).
LO Diphyes colligerum. This species has a relatively continuous record throughout the entire core up to ∼50.9 m (167 ft). After an interval of absence (∼22.0 m; 72 ft), it reappears near the top of the hole (∼29.0 m; 95 ft) associated with another species of the same genus, D. ficusoides, which is known to have been extinct since the middle Lutetian. This suggests that the D. colligerum specimens found near the top of the core are most likely the result of reworking. Although the last occurrence of D. colligerum has been used to indicate the Eocene–Oligocene boundary worldwide (Williams, 1993), other studies record this event from the mid-Lutetian to the early Oligocene. In the southwestern margin of the Rockall Plateau, North Atlantic, this event was dated as middle Eocene and identified within zone IVb (Costa and Downie, 1979). In the North Sea it has been identified close to the Lutetian–Bartonian boundary (Bujak and Mudge, 1994; Mudge and Bujak, 1996), similar to its position in the Norwegian–Greenland seas (Eldrett et al., 2004), although later studies found it ranging up into the middle Bartonian in this area (Eldrett and Harding, 2009). In the central Danish basin it corresponds to the middle Lutetian, in the upper part of NP15 nannoplankton biozone (Heilmann-Clausen and Van Simaeys, 2005). In northwest Germany it was recorded in several samples from the lower Oligocene (Kothe, 1990). Across North America, however, some consistent younger ages were assigned for this event, from late Priabonian to early Rupelian, including offshore Canada (nannoplankton Biozone NP21) (Williams, 1975) and offshore Florida (C13r magnetochron) (Van Mourik et al., 2001) which are both closer to the lower Rupelian age estimate of 33.27 Ma (Williams et al., 2004; 33.44 Ma).
LO Lentinia serrata. The last occurrence of this species at the study site is clearly observed at ∼48.6 m (159.5 ft), after which only isolated occurrences are detected. In mid-latitude climatic zones in the Northern Hemisphere, the age of 33.50 Ma (Williams et al., 2004; 33.68 Ma) has been assigned to this event, whereas in equatorial regions it is estimated that this taxon persists longer, potentially up to 31.00 Ma (Williams et al., 2004).
LO Glaphyrocysta semitecta. This species has a fairly continuous occurrence from the base of the section upwards, becoming particularly common (up to ∼9 % of the dinocyst assemblage) between ∼115.5 and ∼92.4 m (379 and 303 ft). However, this species is again common (∼4 % of the dinocyst assemblage) in two upper intervals (55.8–53.3 m, 183–175 ft; and 41.2–37.5 m, 135–123 ft), which is unlikely to be a result of reworking and has a last occurrence at ∼37.5 m (123 ft). The LO of G. semitecta has been used in central Italy to define the base of the Cin dinocyst biozone (Brinkhuis and Biffi, 1993), of Rupelian age, which is calibrated with the upper part of P18 planktonic foraminifera biozones, the upper part of NP21 nannoplankton biozones, and the C13n/C12r magneto-boundary, which is in agreement with the observations within this succession.
LO Saturnodinium pansum. This taxon has nearly continuous occurrence throughout the core, only being absent above ∼20.4 m (67 ft). In sediments recovered from the central part of the Norwegian Sea (Williams and Manum, 1999) this extinction event is identified at the Lithostratigraphic Unit V, corresponding to the upper Rupelian and an age of 30.24 Ma.
LO Enneadocysta arcuata. This species occurs near continuously through almost the whole core, with highest abundances from ∼105.8 m (347 ft) up to its last appearance at ∼19.2 m (63 ft). A latest Priabonian age has been assigned to this bioevent in the Norwegian Sea (Manum, 1976; Manum et al., 1989), corresponding to the nannoplankton zone NP21 and the planktonic foraminifera P17/P18 boundary. However, in the Scotian Shelf and Grand Banks, offshore southeastern Canada, E. arcuata was an age-diagnostic species for the early Oligocene D. heterophlycta Assemblage Zone (Williams, 1975). At the Ocean Drilling Program (ODP) Site 1172, in the East Tasman Plateau (Brinkhuis et al., 2003), an age estimate of 33.50 Ma (33.68 Ma) has been assigned to the unnamed Enneadocysta sp. A, a taxon closely related to E. arcuata, which is also consistent with the placement of this event in North America.
On a regional scale, some distinctive events found at Mossy Grove are very similar to those detected in five sections from southeastern Mississippi and southwestern Alabama (Jaramillo and Oboh-Ikuenobe, 1999). Graphic correlation across five sections (St. Stephens Quarry, R2089, #1 Young, #1 Wayne, and #1 Ketler) allowed age determination of the main dinocyst events, including the FO of Dinopterygium cladoides (33.9 Ma), the Acme of Operculodinium centrocarpum (33.6 Ma), the LO of Dinopterygium cladoides (33.5 Ma), and the LO of Cribroperidinium tenuitabulatum (33.2 Ma). Although these are not included in the list of the discussed bioevents above, they are all apparent in the Mossy Grove core, with depths listed in Table 2, and appear to be consistent in their age and stratigraphic position with these regional studies.
It is notable that well-preserved specimens of Areosphaeridium diktyoplokum were found at ∼74.1 m (243 ft). The extinction of this taxa has been associated with the EOB (e.g. Williams, 1975, 1977; Williams and Bujak, 1985; Head and Norris, 1989), although there is much discussion about the age of this event. Early publications reported late Eocene ages for the event in the Scotian Shelf; Grand Banks (Williams, 1975, 1977); and in Baffin Bay, Canada (Head and Norris, 1989), as well as in the North Sea (Bujak and Mudge, 1994; Mudge and Bujak, 1996). However, studies of central Italian successions (Brinkhuis and Biffi, 1993; Wilpshaar et al., 1996) place the LO of A. diktyoplokum above the hantkeninid extinction horizon, at the top of the early Oligocene Adi interval zone, calibrated against lower planktonic foraminifera P18 zone, mid nannoplankton NP21 zone, and the basal part of magnetic polarity chronozone C13n. Although previous (Costa and Manum, 1988; Stover and Williams, 1988; Williams and Bujak, 1985) and later (Bujak and Mudge, 1994; Mudge and Bujak, 1996) surveys have demonstrated the possibility that the alleged later occurrences in central Italy could be due to reworking processes, recent dinocyst bio-stratigraphies from the Norwegian–Greenland seas (Eldrett et al., 2004; Eldrett and Harding, 2009) confirmed a post-hantkeninid age for the extinction of A. diktyoplokum, with an age assigned of 33.47 Ma (Westerhold et al., 2014; Williams et al., 2004). Although this species is rare in the Mossy Grove succession, based on correlations to nannofossil biostratigraphy, the topmost occurrence has an estimated age of 34.12 Ma, which is very close to the EOB.
4.4 Integrated age model
Using these ages, we present a significantly refined age model for the Mossy Grove core (Fig. 5) based on dinocyst bioevents as discussed in the previous section (Table 2), integrated with new age constraints from calcareous nannofossil assemblages as well as existing radiometric dates. We show previously published foraminiferal-based age control for reference (Table 1).
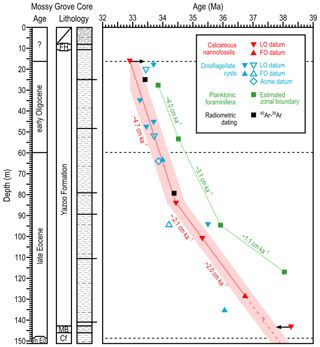
Figure 5Refined age–depth model of the Mossy Grove core. Lithology follows Dockery III et al. (1991) and the timescale follows Westerhold et al. (2014). Best fit lines for the models of Fluegeman et al. (2009) and this work are represented as green and red lines, respectively. Sedimentation rates are also indicated. The shaded area in light red reproduces an error of ∼0.3 Myr, simulating the inclusion of the stated error on radiometric dating of both bentonites. Empty markers refer to bioevents regionally correlated (see Fig. 2).
This new age model can be interpreted to represent sedimentation within two intervals with distinct rates: between the bottom of the analysed section, i.e. ∼152.1 m (499 ft; 37.49 Ma) and ∼89.2 m (292 ft; 34.44 Ma), the sedimentation rate was 2.1 cm kyr−1 and between ∼89.2 m (292 ft; 34.44 Ma) and the top of the analysed section, i.e. ∼16.8 m (55 ft; 33.05 Ma), the sedimentation rate was 4.7 cm kyr−1. This demonstrates that the depositional processes supplied the basin at a relatively constant rate for at least 3 million years, with a significant change only at ∼34.4 Ma. This new age model also allows us to place the Priabonian–Rupelian boundary (EOB: 33.89 Ma) at ∼63.4 m (208 ft) and is more consistent with radiometric dating: the bentonites previously dated at 33.40 and 34.36 Ma here are 33.11 and 34.34 Ma in age, respectively.
Another direct consequence of this model is the reassessment of the age of some dinocyst bioevents. As already mentioned, the extinction of R. borussica, for example, is usually correlated with a late Bartonian age in several sites of the North Sea and the Norwegian–Greenland sea. Meanwhile, middle Priabonian ages were assigned to this event in the central Danish basin (Heilmann-Clausen and Van Simaeys, 2005), corroborating similar dating in the North Atlantic (Costa and Downie, 1979) and offshore Florida (Van Mourik et al., 2001). The last occurrence of this taxon at Mossy Grove was observed at ∼36.77 Ma, consistent with a middle Priabonian age. Two other events are worth mentioning: the earliest appearance of A. alcicornu is similar in age to sites in the Mediterranean (Brinkhuis and Biffi, 1993; Wilpshaar et al., 1996), being an event prior to EOB; on the other hand, the extinction of D. colligerum, here identified in the lower Oligocene, is a post-EOB event, as suggested by several authors (e.g. Kothe, 1990; Brinkhuis and Biffi, 1993).
Comparisons with nearby sites in Mississippi and Alabama (Houben et al., 2018; Jaramillo and Oboh-Ikuenobe, 1999) (Fig. 3) show a similar sequence of bioevents as the Mossy Grove section. The following key events within the Gulf Coast Plain show a high degree of consistency (from the older to the younger): FO D. cladoides, LO H. semilunifera, FO A. alcicornu, LO D. colligerum, LO L. serrata, and LO C. tenuitabulatum, and they are judged to be reliable biohorizons for future biozonation of the upper Eocene to lower Oligocene of the Gulf Coastal Plain.
The Mossy Grove core recorded a rich upper Eocene to lower Oligocene section with excellently preserved palynomorph content, including 52 genera and 70 species of dinocysts identified. Furthermore, rich diversity in other palynological groups was observed, revealing the enormous potential of the study site for the elaboration of future palynofacies models, useful in palaeobathymetric studies. High-resolution analysis (∼26 kyr) of the dinocyst content, integrated with calcareous nannofossil bioevents, generated a more robust age–depth model than previous models based on planktonic foraminifera alone. The new age–depth model is also more consistent with 40Ar∕39Ar radiometric dating. On the basis of the new age model, the cored section spans ∼5 Ma, including a ∼4 Ma of the late Eocene and ∼1 Ma of the earliest Oligocene, including the critical Eocene–Oligocene transition. The age model also documents a substantial increase in sedimentation rate from ∼2.1 to ∼4.7 cm kyr−1 at ∼34.4 Ma, indicating that the EOT climatic event caused a major change in the sedimentary regime.
All semi-quantitative data are provided within the body of the article.
Achomosphaera alcicornu (Eisenack 1954) Roger Jack Davey and Williams 1966 (Plate 1, fig. 1)
Achomosphaera ramulifera (Deflandre 1937) Evitt 1963 (Plate 7, fig. 1)
Araneosphaera araneosa Eaton 1976 (Plate 1, fig. 2)
Areoligera sentosa Eaton 1976 (Plate 1, figs. 3, 4)
Areosphaeridium diktyoplokum (Klumpp 1953) Eaton 1971 emend. Stover and Williams 1995 (Plate 1, figs. 5, 6)
Cannosphaeropsis spp. Wetzel 1933 emend. Marheinecke 1992 (Plate 7, fig. 2)
Charlesdowniea coleothrypta (Williams and Downie 1966b) Lentin and Vozzhennikova 1989 (Plate 1, fig. 7)
Chatangiella spp. Vozzhennikova 1967 emend. Marshall 1988 (Plate 7, figs. 3, 4)
Cleistosphaeridium ancyreum (Cookson and Eisenack 1965) Eaton et al. 2001 (Plate 1, figs. 8, 9)
Cleistosphaeridium polypetellum (Islam 1983c) Stover and Williams 1995 (Plate 1, fig. 10)
Cordosphaeridium cantharellus (Brosius 1963) Gocht 1969 (Plate 1, fig. 11)
Cordosphaeridium fibrospinosum R J Davey and Williams 1966 emend. Davey 1969 (Plate 1, figs. 12, 13)
Cordosphaeridium inodes (Klumpp 1953) Eisenack 1963 emend. Sarjeant 1981 (Plate 1, figs. 14, 15)
Corrudinium incompositum (Drugg 1970) Stover and Evitt 1978 (Plate 1, figs. 16-19)
Cribroperidinium tenuitabulatum (Gerlach 1961) Helenes 1984 (Plate 1, fig. 20)
Cymososphaeridium? phoenix (Duxbury 1980) Fauconnier et al. 2004 (Plate 7, fig. 5)
Dapsilidinium pastielsii (R J Davey and Williams 1966) Bujak et al. 1980 (Plate 2, fig. 1)
Deflandrea heterophlycta Deflandre and Cookson 1955 (Plate 2, fig. 2)
Deflandrea phosphoritica Eisenack 1938 (Plate 2, figs. 3, 4)
Dinogymnium sibiricum (Vozzhennikova 1967) Lentin and Williams 1973 emend. Lentin and Vozzhennikova 1990 (Plate 7, fig. 6)
Dinopterygium cladoides Deflandre 1935 (Plate 2, figs. 5, 6)
Diphyes colligerum (Deflandre and Cookson 1955) Cookson 1965 emend. Goodman and Witmer 1985 (Plate 2, fig. 7)
Diphyes ficusoides Islam 1983 (Plate 2, figs. 8, 9)
Distatodinium biffii Brinkhuis et al. 1992 (Plate 2, figs. 10, 11)
Distatodinium ellipticum (Cookson 1965) Eaton 1976 (Plate 2, fig. 12)
Distatodinium paradoxum (Brosius 1963) Eaton 1976 (Plate 2, fig. 13)
Echinidinium spp. Zonneveld 1997 ex Head et al. 2001 (Plate 2, fig. 14)
Enneadocysta arcuata (Eaton 1971) Stover and Williams 1995 emend. Stover and Williams 1995 (Plate 2, figs. 15, 16)
Enneadocysta deconinckii Stover and Williams 1995 (Plate 2, fig. 17)
Glaphyrocysta laciniiformis (Gerlach 1961) Stover and Evitt 1978 (Plate 2, figs. 18, 19)
Glaphyrocysta retiintexta (Cookson 1965) Stover and Evitt 1978 (Plate 2, fig. 20)
Glaphyrocysta semitecta (Bujak et al. 1980) Lentin and Williams 1981 (Plate 3, figs. 1-4)
Hemiplacophora semilunifera Cookson and Eisenack 1965 (Plate 3, fig. 5)
Heteraulacacysta leptalea Eaton 1976 (Plate 3, fig. 6)
Heteraulacacysta porosa Bujak et al. 1980 (Plate 3, fig. 7)
Homotryblium abbreviatum Eaton 1976 (Plate 3, figs. 8, 9)
Homotryblium floripes (Deflandre and Cookson 1955) Stover 1975 (Plate 3, figs. 10-12)
Homotryblium oceanicum Eaton 1976 (Plate 3, fig. 13)
Horologinella pentagonalis Heilmann-Clausen and Van Simaeys 2005 (Plate 3, fig. 14)
Hystrichokolpoma granulatum Eaton 1976 (Plate 3, fig. 15)
“Hystrichokolpoma pseudooceanicum” Zevenboom 1995 (Plate 3, fig. 16)
Hystrichokolpoma rigaudiae Deflandre and Cookson 1955 (Plate 3, fig. 17)
Hystrichokolpoma salacia Eaton 1976 (Plate 3, fig. 18,19)
Hystrichosphaeridium tubiferum (Ehrenberg 1837) Deflandre 1937 emend. R J Davey and Williams 1966 (Plate 3, fig. 20)
Impagidinium paradoxum (Wall 1967) Stover and Evitt 1978 (Plate 4, figs. 1, 2)
Lejeunecysta spp. Artzner and Dörhöfer 1978 emend. Bujak et al. 1980 (Plate 4, fig. 3)
Lentinia serrata Bujak et al. 1980 (Plate 4, figs. 4, 5)
Lingulodinium “brevispinosum” Matsuoka and Bujak 1988 (Plate 4, figs. 6, 7)
Lingulodinium machaerophorum (Deflandre and Cookson 1955) Wall 1967 (Plate 4, figs. 8, 9)
Litosphaeridium siphoniphorum (Cookson and Eisenack 1960) R J Davey and Williams 1966 emend. Lucas-Clark 1984 (Plate 7, fig. 7)
Melitasphaeridium pseudorecurvatum (Morgenroth 1966a) Bujak et al. 1980 (Plate 4, fig. 10)
Minisphaeridium latirictum (Morgenroth 1966a) Fensome et al. 2009 (Plate 4, fig. 11)
Nematosphaeropsis spp. Deflandre and Cookson 1955 emend. Wrenn 1988 (Plate 4, figs. 12, 13)
Operculodinium centrocarpum (Deflandre and Cookson 1955) Wall 1967 (Plate 4, fig. 14)
Operculodinium microtriainum (Klumpp 1953) Islam 1983b (Plate 4, figs. 15, 16)
Palaeohystrichophora infusorioides Deflandre 1935 (Plate 7, fig. 8)
Phthanoperidinium comatum (Morgenroth 1966b) Eisenack and Kjellström 1972 (Plate 4, fig. 17)
Phthanoperidinium distinctum Bujak 1994 (Plate 4, fig. 18)
Piladinium columna (Michoux 1988) Williams et al. 2015 (Plate 4, fig. 19)
Rhombodinium spinula (Bujak 1979) Williams et al. 2015 (Plate 5, fig. 1)
Rhombodinium spp. Gocht 1955 emend. Fensome et al. 2009 (endocyst: Plate 4, fig. 20)
Rottnestia borrusica (Eisenack 1954) Cookson and Eisenack 1961 (Plate 5, fig. 2)
Saturnodinium pansum (Stover 1977) Brinkhuis et al. 1992 (Plate 5, figs. 3, 4)
Senegalinium spp. Jain and Millepied 1973 emend. Stover and Evitt 1978 (Plate 5, fig. 5)
Sophismatia tenuivirgula (Williams and Downie 1966b) Williams et al. 2015 (Plate 5, fig. 6)
Spiniferites bentorii (Rossignol 1964) Wall and Dale 1970 (Plate 5, fig. 7)
Spiniferites mirabilis (Rossignol 1964) Sarjeant 1970 (Plate 5, fig. 8)
Spiniferites pseudofurcatus (Klumpp 1953) Sarjeant 1970 emend. Sarjeant 1981 (Plate 5, figs. 9, 10)
Spiniferites ramosus group (Ehrenberg 1837) Mantell 1854 (Plate 5, fig. 11)
Svalbardella partimtabulata Heilmann-Clausen and Van Simaeys 2005 (Plate 6, figs. 1, 2)
Tectatodinium pellitum Wall 1967 emend. Head 1994 (Plate 5, fig. 12)
Thalassiphora fenestrata Liengjarern et al. 1980 (Plate 6, fig. 3)
Thalassiphora pelagica (Eisenack 1954) Eisenack and Gocht 1960 emend. Benedek and Gocht 1981 (Plate 6, figs. 4, 5)
Thalassiphora spinifera (Cookson and Eisenack 1965) Stover and Evitt 1978 (Plate 5, figs. 13, 14)
Turnhosphaera hypoflata (Yun 1981) Slimani 1994 (Plate 5, fig. 15)
Wetzeliella articulata Eisenack 1938 (Plate 5, fig. 16)
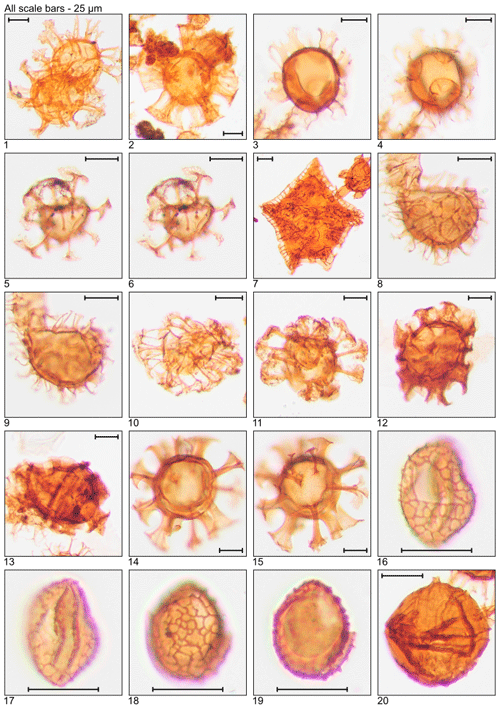
Plate 1Illustration of taxa and sample or slide number. (1) Achomosphaera alcicornu (MG55; 16.8 m; U15). (2) Araneosphaera araneosa (MG479; 146.0 m; C19-1). (3, 4) Areoligera sentosa (MG423; 128.9 m; C7). (5, 6) Areosphaeridium diktyoplokum (MG243; 74.1 m; C11-1). (7) Charlesdowniea coleothrypta (MG271; 82.6 m; L17-1). (8, 9) Cleistosphaeridium ancyreum (MG55; 16.8 m; N23-1). (10) Cleistosphaeridium polypetellum (MG499; 152.1 m; D9). (11) Cordosphaeridium cantharellus (MG215; 65.5 m; C11-1). (12, 13) Cordosphaeridium fibrospinosum (MG383; 116.7 m; D12; MG371; 113.1 m; E18-2). (14, 15) Cordosphaeridium inodes (MG347; 105.8 m; C15). (16–19) Corrudinium incompositum (MG59; 18.0 m; G37, K11-2). (20) Cribroperidinium tenuitabulatum (MG363; 110.6 m; C18-2).
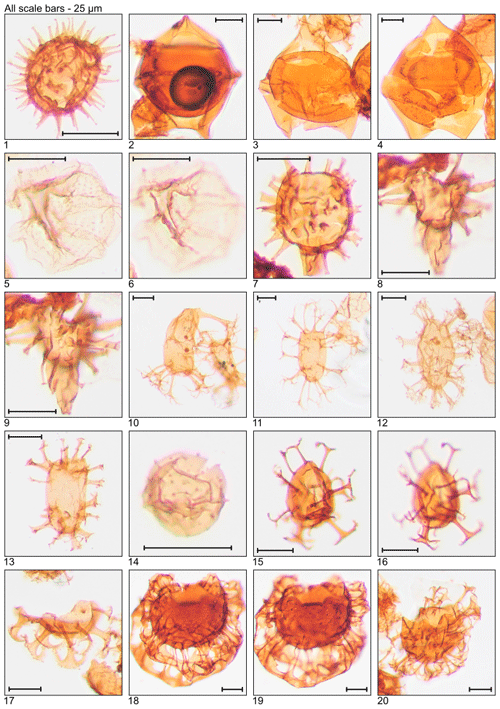
Plate 2Illustration of taxa and sample or slide number. (1) Dapsilidinium pastielsii (MG391; 119.2 m; D11). (2) Deflandrea heterophlycta (MG111; 33.8 m; C22-3). (3, 4) Deflandrea phosphoritica (MG111; 33.8 m; C10-4). (5, 6) Dinopterygium cladoides (MG187; 57.0 m; C6). (7) Diphyes colligerum (MG259; 78.9 m; H16). (8, 9) Diphyes ficusoides (MG231; 70.4 m; D20). (10, 11) Distatodinium biffii (MG71; 21.6 m; E5; MG471; 143.6 m; C18). (12) Distatodinium ellipticum (MG59; 18.0 m; F24-2). (13) Distatodinium paradoxum (MG103; 31.4 m; D14). (14) Echidinium sp. (MG59; 18.0 m; M42-4). (15, 16) Enneadocysta arcuata (MG263; 80.2 m; F12). (17) Enneadocysta deconinckii (MG127; 38.7 m; C10). (18, 19) Glaphyrocysta laciniiformis (MG371; 113.1 m; C8-1). (20) Glaphyrocysta retiintexta (MG427; 130.2 m; E12).
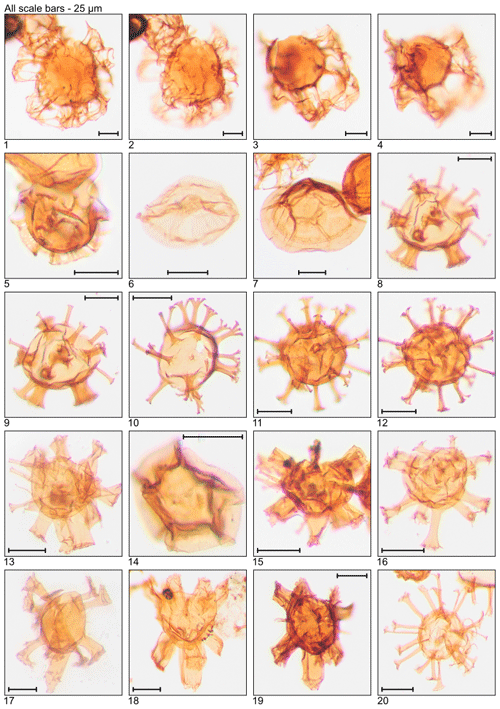
Plate 3Illustration of taxa and sample or slide number. (1–4) Glaphyrocysta semitecta (MG331; 100.9 m; C16, C20-4). (5) Hemiplacophora semilunifera (MG471; 143.6 m; C19-1). (6) Heteraulacacysta leptalea (MG487; 148.4 m; D14-4). (7) Heteraulacacysta porosa (MG111; 33.8 m; C8-2). (8, 9) Homotryblium abbreviatum (MG319; 97.2 m; C10-4). (10–12) Homotryblium floripes (MG55; 16.8 m; K12-4, Q7). (13) Homotryblium oceanicum (MG59; 18.0 m; F8-3). (14) Horologinella pentagonalis (MG319; 97.2 m; O22). (15) Hystrichokolpoma granulatum (MG63; 19.2 m; B21-4). (16) “Hystrichokolpoma pseudooceanicum” (MG455; 138.7 m). (17) Hystrichokolpoma rigaudiae (MG59; 18.0 m; H24-2). (18, 19) Hystrichokolpoma salacia (MG299; 91.1 m; E12-4; MG307; 93.6 m; F20-4). (20) Hystrichosphaeridium tubiferum (MG299; 91.1 m; C6-4).
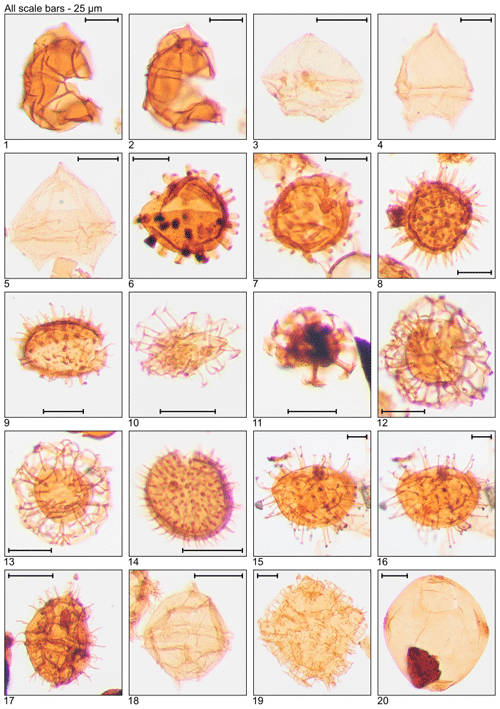
Plate 4Illustration of taxa and sample or slide number. (1, 2) Impagidinium paradoxum (MG459; 139.9 m; D5). (3) Lejeunecysta sp. (MG411; 125.3 m; C10-2). (4, 5) Lentinia serrata (MG59; 18.0 m; N16-4, Q14-3). (6, 7) Lingulodinium “brevispinosum” (MG299; 91.1 m; D12; MG259; 78.9 m; D23-3). (8, 9) Lingulodinium machaerophorum (MG215; 65.5 m; D18; MG311; 94.8 m; C10-2). (10) Melitasphaeridium pseudorecurvatum (MG199.5; 60.8 m; C14). (11) Minisphaeridium latirictum (MG275; 83.8 m; K7). (12, 13) Nematosphaeropsis sp. (MG451; 137.5 m; H15-1, J17-3). (14) Operculodinium centrocarpum (MG459; 139.9 m; D11-1). (15, 16) Operculodinium microtriainum (MG451; 137.5 m; J17-3). (17) Phthanoperidinium comatum (MG323; 98.5 m; E8). (18) Phthanoperidinium distinctum (MG95; 29.0 m; D8-4). (19) Piladinium columna (MG55; 16.8 m; F20). 20. Rhombodinium sp. endocyst (MG55; 16.8 m; K11-1).
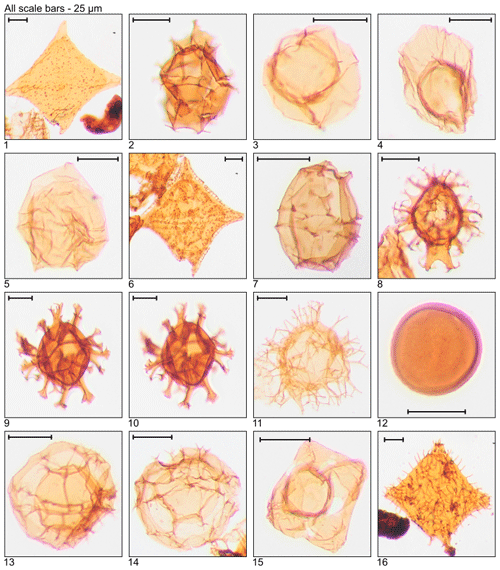
Plate 5Illustration of taxa and sample or slide number. (1) Rhombodinium spinula (MG447; 136.3 m; C21). (2) Rottnestia borussica (MG459; 139.9 m; C13-1). (3, 4) Saturnodinium pansum (MG311; 94.8 m; T8-4; MG411; 125.3 m; C9-4). (5) Senegalinium sp. (MG55; 16.8 m; C15). (6) Sophismatia tenuivirgula (MG55; 16.8 m; E9-3). (7) Spiniferites bentorii (MG55; 16.8 m; G18-1). (8) Spiniferites mirabilis (MG259; 78.9 m; H11). (9, 10) Spiniferites pseudofurcatus (MG459; 139.9 m; E7-2). (11) Spiniferites ramosus group (MG59; 18.0 m; E10). (12) Tectatodinium pellitum (MG59; 18.0 m; H9-1). (13, 14) Thalassiphora spinifera (MG463; 141.1 m; C9; MG363; 110.3 m; C20). (15) Turnhosphaera hypoflata (MG343; 104.6 m; E22). (16) Wetzeliella articulata (MG319; 97.2 m; N22).
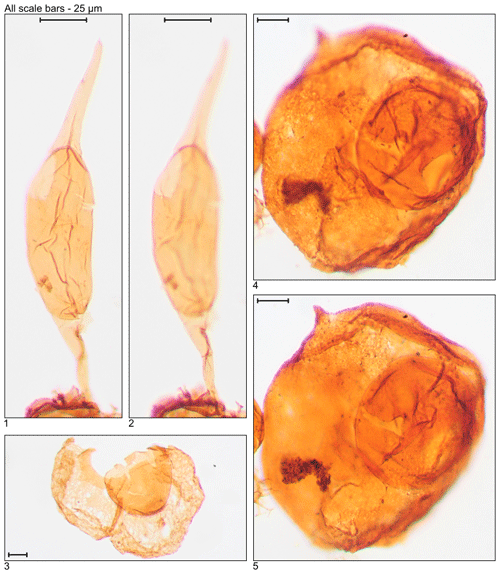
Plate 6Illustration of taxa and sample or slide number. (1, 2) Svalbardella partimtabulata (MG419; 127.7 m; D7-3). (3) Thalassiphora fenestrata (MG175; 53.3 m; E21-2). (4, 5) Thalassiphora pelagica (MG499; 152.1 m; C6-2).
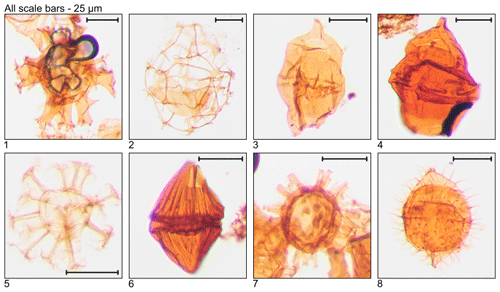
Plate 7Illustration of reworked taxa and sample or slide number. (1) Achomosphaera ramulifera (MG363; 110.6 m; C20). (2) Cannosphaeropsis sp. (MG167; 50.9 m; C20-1). (3, 4) Chatangiella sp. (MG283; 86.3 m; D10-4; MG271; 82.6 m; L19-3). (5) Cymososphaeridium? phoenix (MG167; 50.9 m; C21-1). (6) Dinogymnium sibiricum (MG371; 113.1 m; D18). (7) Litosphaeridium siphoniphorum (MG363; 110.6 m; C17-2). (8) Palaeohystrichophora infusorioides (MG275; 83.8 m; K5-3).
MADLM conceived the study, processed and analysed samples, interpreted results, and wrote and edited the article; GH analysed the samples and participated in interpretation of the article; TDJ collected samples and participated in interpretation, writing, and editing of the article.
The authors declare that they have no conflict of interest.
We thank Carlos d'Apolito Júnior (Federal University of Mato Grosso, Brazil) and Manuel Vieira (Shell, UK), as well as James A. P. Bendle and Kirsty M. Edgar (University of Birmingham, UK) for their numerous and helpful suggestions, which have greatly improved this work; we thank Roger Burgess (University of Aberdeen, UK) for the initial pilot study, revealing the excellent level of preservation of the samples. We also thank PetroStrat Ltd, particularly Gary Smith, Marcel Polling, Neil Campion, and Paul Cornick, for allowing us access to their facilities during the slide preparation step.
This research has been supported by the National Council for Scientific and Technological Development (CNPq, Brazil) (grant no. 206218/2014-1) and the Natural Environment Research Council (NERC, UK) (standard grant NE/P013112/1).
This paper was edited by Francesca Sangiorgi and reviewed by Henk Brinkhuis, Kasia K. Sliwinska, and two anonymous referees.
Agnini, C., Fornaciari, E., Raffi, I., Catanzariti, R., Pälike, H., Backman, J., and Rio, D.: Biozonation and biochronology of Paleogene calcareous nannofossils from low and middle latitudes, Newsl. Stratigr., 47, 131–181, https://doi.org/10.1127/0078-0421/2014/0042, 2014.
Aubry, M.-P.: Biostratigraphie du Paléogène épicontinental de l'Europe du Nord-Ouest: Étude fondée sur les nannofossiles calcaires, Université Claude Bernard-Lyon I, Département des sciences de la terre, Vol. 1, 317 pp., 1983.
Aubry, M.-P.: Northwestern European Paleogene Magnetostratigraphy, biostratigraphy, and paleogeography: Calcareous nannofossil evidence, Geology, 13, 198–202, 1985.
Baum, G. R. and Vail, P. R. Sequence Stratigraphic Concepts Applied to Paleogene Outcrops, Gulf and Atlantic Basins, in: Sea Level Changes: An Integrated Approach, edited by: Wilgus, C. K., Hastings, B. S., Posamentier, H., Van Wagoner, J., Ross, C. A., and Kendall, C. G., Society of Economic Paleontologists and Mineralogists, Tulsa, 309–326, 1988.
Berggren, W. A. and Pearson, P. N.: A Revised Tropical To Subtropical Paleogene Planktonic Foraminiferal Zonation, J. Foramin.l Res., 35, 279–298, https://doi.org/10.2113/35.4.279, 2005.
Berggren, W. A., Kent, D. V., Swisher, C. C., and Aubry, M.-P.: A Revised Cenozoic Geochronology and Chronostratigraphy, Geochronology Time Scales and Global Stratigraphic Correlation, SEPM Special Publication, 54, 129–212, 1995.
Bijl, P. K., Houben, A. J. P., Bruls, A., Pross, J., and Sangiorgi, F.: Stratigraphic calibration of Oligocene–Miocene organic-walled dinoflagellate cysts from offshore Wilkes Land, East Antarctica, and a zonation proposal, J. Micropalaeontol., 37, 105–138, https://doi.org/10.5194/jm-37-105-2018, 2018.
Bordiga, M., Henderiks, J., Tori, F., Monechi, S., Fenero, R., Legarda-Lisarri, A., and Thomas, E.: Microfossil evidence for trophic changes during the Eocene–Oligocene transition in the South Atlantic (ODP Site 1263, Walvis Ridge), Clim. Past, 11, 1249–1270, https://doi.org/10.5194/cp-11-1249-2015, 2015.
Bown, P. R. and Young, J.: Techniques, in: Calcareous Nannofossil Biostratigraphy, edited by: Bown, P. R., British Micropalaeontological Society Publications Series, Kluwer Academic, London, 16–28, 1998.
Brinkhuis, H.: Late Eocene to Early Oligocene dinoflagellate cysts from the Priabonian type-area (Northeast Italy): biostratigraphy and paleoenvironmental interpretation, Palaeogeogr. Palaeocl., 107, 121–163, https://doi.org/10.1016/0031-0182(94)90168-6, 1994.
Brinkhuis, H. and Biffi, U.: Dinoflagellate cyst stratigraphy of the Eocene/Oligocene transition in central Italy, Mar. Micropaleontol., 22, 131–183, https://doi.org/10.1016/0377-8398(93)90007-K, 1993.
Brinkhuis, H., Sengers, S., Sluijs, A., Warnaar, J., and Williams, G. L.: Latest Cretaceous-Earliest Oligocene and Quaternary Dinoflagellate Cysts, ODP site 1172, East Tasman Plateau, Proceedings of the Ocean Drilling Program, Sci. Res., 189, 1–48, 2003.
Bujak, J. P. and Mudge, D. C.: A high-resolution North Sea Eocene dinocyst zonation, J. Geol. Soc., 151, 449–462, https://doi.org/10.1144/gsjgs.151.3.0449, 1994.
Bujak, J. P. and Williams, G. L.: Mesozoic and Cenozoic dinoflagellates, Plankton Stratigraphy. Cambridge University Press, Cambridge, 847–965, 1985.
Burgess, R.: Analysis of the palynomorph assemblage through the Eocene/Oligocene transition within the Mossy Grove core, Mississippi, University of Birmingham, Master Dissertation, 88, 2015.
Bybell, L. M. and Poore, R. Z.: Reworked Hantkenina specimens at Little Stave Creek, Alabama: Gulf Coast Association of Geological Societies Transactions, AAPG Bull., 33, 253–256, 1983.
Costa, L. I. and Downie, C.: Cenozoic dinocyst stratigraphy of sites 403 to 406 (Rockall Plateau), IPOD, Leg 48, Initial Rep. Deep Sea, 48, 513–529, 1979.
Costa, L. I. and Manum, S. B.: The description of the interregional zonation of the Paleogene (D1–D15) and the Miocene (D16–D20), Geologisches Jahrbuch, Reihe A, 100, 321–330, 1988.
Costa, L. I., Downie, C., and Eaton, G. L.: Palynostratigraphy of some middle Eocene sections from the Hampshire basin (England), Proceedings of the Geologists' Association, 87, 273–284, 1976.
Cotton, L. J. and Pearson, P. N.: Larger benthic foraminifera from the middle Eocene to Oligocene of Tanzania, Austrian J. Earth Sci., 105, 189–199, 2012.
Coxall, H. K. and Pearson, P. N.: The Eocene-Oligocene transition, in: Deep-Time Perspectives on Climate Change: Marrying the Signal from Computer Models and Biological Proxies, edited by: Williams, M., Haywood, A. M., Gregory, F. J., and Schmidt, D. N., The Micropalaeontological Society, Special Publications, The Geological Society, London, 351–387, 2007.
Coxall, H. K., Wilson, P. A., Pälike, H., Lear, C. H., and Backman, J.: Rapid stepwise onset of Antarctic glaciation and deeper calcite compensation in the Pacific Ocean, Nature, 433, 53–57, https://doi.org/10.1038/nature03186.1, 2005.
Cramer, B. S., Miller, K. G., Barrett, P. J. and Wright, J. D.: Late Cretaceous – Neogene trends in deep ocean temperature and continental ice volume?: Reconciling records of benthic foraminiferal geochemistry (δ18O and Mg∕Ca) with sea level history, 116, 1–23, https://doi.org/10.1029/2011JC007255, 2011.
Cushing, E. M., Boswell, E. H., and Hosman, R. L.: General Geology of the Mississippi Embayment, US Geological Survey Professional Paper 448-B, 28, 1964.
DeConto, R. M. and Pollard, D.: Rapid Cenozoic glaciation of Antarctica induced by declining atmospheric CO2, Nature, 421, 245–249, https://doi.org/10.1038/nature01290, 2003.
DeConto, R. M., Pollard, D., Wilson, P. A., Pälike, H., Lear, C. H., and Pagani, M.: Thresholds for Cenozoic bipolar glaciation, Nature, 455, 652–656, https://doi.org/10.1038/nature07337, 2008.
Dockery, D. T.: Lower Oligocene bivalvia of the Vicksburg group in Mississippi, Mississippi Department of Natural Resources, Bureau Geol., 261 pp., 1982.
Dockery III, D. T., Stover, C. W., Weathersby, P., Stover Jr., C. W., and Ingram, S. L.: A continuous core through the undifferentiated Yazoo Clay (late Eocene, Jackson Group) of central Mississippi, Mississippi Geology, 12, 21–27, 1991.
Dunkley Jones, T., Bown, P. R., Pearson, P. N., Wade, B. S., Coxall, H. K., and Lear, C. H.: Major shifts in calcareous phytoplankton assemblages through the Eocene-Oligocene transition of Tanzania and their implications for low-latitude primary production, Paleoceanography, 23, 1–14, https://doi.org/10.1029/2008PA001640, 2008.
Dunkley Jones, T., Bown, P. R., and Pearson, P. N.: Exceptionally well preserved upper Eocene to lower Oligocene calcareous nannofossils (Prymnesiophyceae) from the Pande Formation (Kilwa Group), Tanzania, J. Syst. Palaeontol., 7, 359–411, https://doi.org/10.1017/S1477201909990010, 2009.
Duxbury, S. and Vieira, M.: A Stratigraphic Review of the Late Callovian to Oxfordian Interval, Fisher Bank Basin Area (UK Sector, Central North Sea), J. Petrol. Geol., 41, 47–65, https://doi.org/10.1111/jpg.12692, 2018.
Echols, R. J., Armentrout, J. M., Root, S. A., Fearn, L. B., Cooke, J. C., Rodgers, B. K., and Thompson, P. R.: Sequence stratigraphy of the Eocene/Oligocene boundary interval: Southeastern Mississippi, in: From Greenhouse to Ice House: The Marine Eocene–Oligocene Transition, edited by: Prothero, D. R., Nesbitt, E., and Ivany, L., 189–222, 2003.
Egger, L. M., Śliwińska, K. K., van Peer, T. E., Liebrand, D., Lippert, P. C., Friedrich, O., Wilson, P. A., Norris, R. D., and Pross, J.: Magnetostratigraphically-calibrated dinoflagellate cyst bioevents for the uppermost Eocene to lowermost Miocene of the western North Atlantic (IODP Expedition 342, Paleogene Newfoundland sediment drifts), Rev. Palaeobot. Palyno., 234, 159–185, https://doi.org/10.1016/j.revpalbo.2016.08.002, 2016.
Eldrett, J. S. and Harding, I. C.: Palynological analyses of Eocene to Oligocene sediments from DSDP Site 338, Outer Vøring Plateau, Mar. Micropaleontol., 73, 226–240, https://doi.org/10.1016/j.marmicro.2009.10.004, 2009.
Eldrett, J. S., Harding, I. C., Firth, J. V., and Roberts, A. P.: Magnetostratigraphic calibration of Eocene-Oligocene dinoflagellate cyst biostratigraphy from the Norwegian-Greenland Sea, Mar. Geol., 204, 91–127, https://doi.org/10.1016/S0025-3227(03)00357-8, 2004.
Fluegeman, R. H.: Preliminary paleontological report on the foraminifera of the Mossy Grove core, Hinds County, Mississippi, Mississippi Geology, 17, 9–15, 1996.
Fluegeman, R. H., Grigsby, J. D., and Hurley, J. V: Eocene-Oligocene greenhouse to icehouse transition on a subtropical clastic shelf; the Jackson-Vicksburg Groups of the eastern Gulf Coastal Plain of the United States, Special Paper – Geological Society of America, 452, 261–277, https://doi.org/10.1130/2009.2452(17), 2009.
Friedrich, O., Norris, R. D., and Erbacher, J.: Evolution of middle to late Cretaceous oceans-A 55 m.y. Record of Earth's temperature and carbon cycle, Geology, 40, 107–110, https://doi.org/10.1130/G32701.1, 2012.
Gradstein, F. M., Kristiansen, I. L., Loemo, L., and Kaminski, M. A.: Cenozoic foraminiferal and dinoflagellate cyst biostratigraphy of the central North Sea, Micropaleontology, 38, 101–137, https://doi.org/10.2307/1485991, 1992.
Hansen, J. M.: Dinoflagellate stratigraphy and echinoid distribution in Upper Maastrichtian and Danian deposits from Denmark, B. Geol. Soc. Denmark, 26, 1–26, 1977.
Head, M. J. and Norris, G.: Palynology and Dinocyst Stratigraphy of the Eocene and Oligocene in ODP Leg 105, Hole 647A, Labrador Sea, in: Proceedings of the Ocean Drilling Program, Sci. Res., 105, 515–550, 1989.
Heilmann-Clausen, C. and Van Simaeys, S.: Dinoflagellate cysts from the Middle Eocene to lowermost Oligocene succession in the Kysing Research Borehole, central Danish Basin, Palynology, 29, 143–204, 2005.
Hosman, R. L.: Regional stratigraphy and subsurface geology of Cenozoic deposits, Gulf Coastal Plain, South-central United States, US Geological Survey, Professional Paper 1416-G, 34 pp., 1996.
Houben, A. J. P., van Mourik, C. A., Montanari, A., Coccioni, R., and Brinkhuis, H.: The Eocene-Oligocene transition: Changes in sea level, temperature or both?, Palaeogeogr. Palaeocl., 335/336, 75–83, https://doi.org/10.1016/j.palaeo.2011.04.008, 2012.
Houben, A. J. P., Bijl, P. K., Pross, J., Bohaty, S. M., Passchier, S., Stickley, C. E., Röhl, U., Sugisaki, S., Tauxe, L., van de Flierdt, T., Olney, M., Sangiorgi, F., Sluijs, A., Escutia, C., Brinkhuis, H., and Scientists, and Exp. 318 Scientists: Reorganization of Southern Ocean Plankton Ecosystem at the Onset of Antarctic Glaciation, Science, 340, 341–344, https://doi.org/10.1126/science.1223646, 2013.
Houben, A. J. P., Quaijtaal, W., Wade, B. S., Schouten, S., and Brinkhuis, H.: Quantitative organic-walled dinoflagellate cyst stratigraphy across the Eocene-Oligocene Transition in the Gulf of Mexico: A record of climate- and sea level change during the onset of Antarctic glaciation, Newsl. Stratigr., 52, 131–154, https://doi.org/10.1127/nos/2018/0455, 2018.
Jaramillo, C. A. and Oboh-Ikuenobe, F. E.: Sequence stratigraphic interpretations from palynofacies, dinocyst and lithological data of upper eocene-lower oligocene strata in southern Mississippi and Alabama, US Gulf Coast, Palaeogeogr. Palaeocl., 145, 259–302, https://doi.org/10.1016/S0031-0182(98)00126-6, 1999.
Kamikuri, S. and Wade, B. S.: Radiolarian Magnetobiochronology and faunal turnover across the middle/late Eocene boundary at Ocean Drilling Program Site 1052 in the western North Atlantic Ocean, Mar. Micropaleontol., 88, 41–53, 2012.
Katz, M. E., Miller, K. G., Wright, J. D., Wade, B. S., Browning, J. V., Cramer, B. S., and Rosenthal, Y.: Stepwise transition from the Eocene greenhouse to the Oligocene icehouse, Nat. Geosci., 1, 329–334, https://doi.org/10.1038/ngeo179, 2008.
Kennett, J. P.: Cenozoic evolution of Antarctic glaciation, the circum-Antarctic Ocean, and their impact on global paleoceanography, J. Geophys. Res., 82, 3843–3860, https://doi.org/10.1029/JC082i027p03843, 1977.
Kennett, J. P. and Shackleton, N. J.: Oxygen isotopic evidence for the development of the psychrosphere 38 Myr ago, Nature, 260, 513–515, 1976.
Kothe, A.: Paleogene dinoflagellates from Northwest Germany: biostratigraphy and paleoenvironments, Geologisches Jahrbuch, 118, 3–111, 1990.
Lear, C. H., Elderfield, H., and Wilson, P. A.: Cenozoic deep-sea temperatures and global ice volumes from Mg∕Ca in benthic foraminiferal calcite, Science, 287, 269–272, https://doi.org/10.1126/science.287.5451.269, 2000.
Lear, C. H., Rosenthal, Y., and Wright, J. D.: The closing of a seaway: Ocean water Masses and global climate change, Earth Planet. Sc. Lett., 210, 425–436, https://doi.org/10.1016/S0012-821X(03)00164-X, 2003.
Lear, C. H., Bailey, T. R., Pearson, P. N., Coxall, H. K., and Rosenthal, Y.: Cooling and ice growth across the Eocene-Oligocene transition, Geology, 36, 251–254, https://doi.org/10.1130/G24584A.1, 2008.
Liu, Z., Pagani, M., Zinniker, D., Deconto, R. M., Huber, M., Brinkhuis, H., Shah, S. R., Leckie, R. M., and Pearson, A.: Global Cooling During the Eocene-Oligocene Climate Transition, Science, 970, 1187–1190, 2009.
Loutit, T. S., Hardenbol, J., Vail, P. R., and Baum, G. R.: Condensed sections: The key to age determination and correlation of continental margin sequences, in: Sea Level Changes – An Integrated Approach, edited by: Wilgus, C. K., Hastings, B. S., Kendall, C. G. St. C., Posamentier, H. V., Ross, C. A., and Van Wagoner, J. C., SEPM Special Publication, 42, 183–213, 1988.
Mancini, E. A. Eocene-Oligocene boundary in southwest Alabama, Gulf Coast Association of Geological Societies Transactions, 29, 282–286, 1979.
Mancini, E. A. and Tew, B. H.: Relationships of Paleogene stage and planktonic foraminiferal zone boundaries to lithostratigraphic and allostratigraphic contacts in the eastern Gulf Coastal Plain, J. Foramin. Res., 21, 48–66, 1991.
Manum, S. B.: Dinocysts in Tertiary Norwegian-Greenland Sea sediments (Deep Sea Drilling Project Leg 38), with observations on palynomorphs and palynodebris in relation to environment, Initial Rep. Deep Sea, 38, 897–919, 1976.
Manum, S. B., Boulter, M. C., Gunnarsdottir, H., Rangnes, K., and Scholze, A.: Eocene to Miocene Palynology of the Norwegian Sea (ODP Leg 104), in: Proceedings of the Ocean Drilling Program, 104, 61–74, 1989.
Martini, E.: Standard Tertiary and Quaternary calcareous nannoplankton zonation, in: Proc. II Planktonic Conference, Roma 1970, Roma, Tecnoscienza, 2, 739–785, 1971.
Miller, K. G., Fairbanks, R. G., and Mountain, G. S.: Tertiary Oxygen Isotope Synthesis, Sea Level History, and Continental Margin Erosion, Paleoceanography, 2, 1–19, 1987.
Miller, K. G., Thompson, P. R., and Kent, D. V.: Integrated Late Eocene-Oligocene Stratigraphy of the Alabama Coastal Plain: Correlation of Hiatuses and Stratal Surfaces to Glacioeustatic Lowerings, Paleoceanography, 8, 313–331, https://doi.org/10.1029/93PA00203, 1993.
Miller, K. G., Browning, J. V, Aubry, M. P., Wade, B. S., Katz, M. E., Kulpecz, A. A., and Wright, J. D.: Eocene-Oligocene global climate and sea-level changes: St. Stephens Quarry, Alabama, B. Geol. Soc. Am., 120, 34–53, https://doi.org/10.1130/B26105.1, 2008.
Mohr, B. A. R.: Eocene and Oligocene sporomorphs and dinoflagellate cysts from Leg 113 drill sites, Weddell Sea, Antarctica, in: Proceedings of the Ocean Drilling Program, US Government Printing Office College Station, Texas, Sci. Res., 113, 595–612,1990.
Moore, T. C., Kamikuri, S. ichi, Erhardt, A. M., Baldauf, J., Coxall, H. K., and Westerhold, T.: Radiolarian stratigraphy near the Eocene-Oligocene boundary, Mar. Micropaleontol., 116, 50–62, https://doi.org/10.1016/j.marmicro.2015.02.002, 2015.
Mudge, D. C. and Bujak, J. P.: Eocene stratigraphy of the North Sea basin, Mar. Petrol. Geol., 11, 166–181, 1994.
Mudge, D. C. and Bujak, J. P.: An integrated stratigraphy for the Paleocene and Eocene of the North Sea, Geological Society, London, Special Publications, 101, 91–113, https://doi.org/10.1144/GSL.SP.1996.101.01.06, 1996.
Nocchi, M., Monechi, S., Coccioni, R., Madile, M., Monaco, P., Orlando, M., Parisi, G., and Premoli Silva, I.: The extinction of the Hantkeninidae as a marker for recognizing the Eocene–Oligocene boundary: a proposal, The Eocene–Oligocene Boundary in the Marche–Umbria Basin (Italy), International Union of Geological Sciences Commission on Stratigraphy, 249–252, 1988.
Oboh-Ikuenobe, F. E. and Jaramillo, C. A.: Palynological Patterns in the Uppermost Eocene to Lower Oligocene Sedimentary, in: From Greenhouse to Icehouse: The Marine Eocene-Oligocene Transition, Columbia University Press, p. 269, 2003.
Obradovich, J. D. and Dockery III, D. T.: Revisions to the geochronology of the uppermost Yazoo Formation, central Mississippi, and a new estimate for the age of the Eocene, Oligocene boundary: Journal of the Mississippi Academy of Sciences, 41, p. 54, 1996.
Obradovich, J. D., Dockery III, D. T., and Swisher III, C. C.: 40Ar-39Ar ages of bentonite beds in the upper part of the Yazoo Formation (Upper Eocene), west-central Mississippi, Mississippi Geol., 14, 1–9, 1993.
Pagani, M., Huber, M., Liu, Z., Bohaty, S. M., Henderiks, J., Sijp, W., Krishnan, S., and DeConto, R. M.: The role of carbon dioxide during the onset of antarctic glaciation, Science, 334, 1261–1264, https://doi.org/10.1126/science.1203909, 2011.
Pälike, H., Norris, R. D., Herrle, J. O., Wilson, P. A., Coxall, H. K., Lear, C. H., Shackleton, N. J., Tripati, A. K., and Wade, B. S.: The heartbeat of the Oligocene climate system (SOM), Science, 314, 1894–1898, https://doi.org/10.1126/science.1133822, 2006.
Pasley, M. A. and Hazel, J. E.: Revised sequence stratigraphic interpretation of the Eocene-Oligocene boundary interval, Mississippi and Alabama, Gulf Coast Basin, USA, J. Sediment. Res., 65, 160–169, 1995.
Pearson, P. N., McMillan, I. K., Wade, B. S., Jones, T. D., Coxall, H. K., Bown, P. R., and Lear, C. H.: Extinction and environmental change across the Eocene-Oligocene boundary in Tanzania, Geology, 36, 179–182, https://doi.org/10.1130/G24308A.1, 2008.
Pearson, P. N., Foster, G. L., and Wade, B. S.: Atmospheric carbon dioxide through the Eocene–Oligocene climate transition, Nature, 461, 1110–1113, https://doi.org/10.1038/nature08447, 2009.
Pekar, S. F., Christie-Blick, N., Kominz, M. A., and Miller, K. G.: Calibration between eustatic estimates from backstripping and oxygen isotopic records for the Oligocene, Geology, 30, 903–906, https://doi.org/10.1130/0091-7613(2002)030<0903:CBEEFB>2.0.CO;2, 2002.
Persico, D. and Villa, G.: Eocene-Oligocene calcareous nannofossils from Maud Rise and Kerguelen Plateau (Antarctica): Paleoecological and paleoceanographic implications, Mar. Micropaleontol., 52, 153–179, https://doi.org/10.1016/j.marmicro.2004.05.002, 2004.
Powell, A. J.: Dinoflagellate cysts of the Tertiary System, in: A Stratigraphic Index of Dinoflagellate Cysts, edited by: Powell, A. J., 155–251, Chapman & Hall, 1992.
Premoli Silva, I. and Jenkins, D. G.: Decision on the Eocene-Oligocene boundary stratotype, Episodes, 16, 379–382, 1993.
Priddy, R. R.: Madison County Geology, Mississippi State Geological Survey, 88, 123 pp., 1960.
Pross, J., Houben, A. J. P., van Simaeys, S., Williams, G. L., Kotthoff, U., Coccioni, R., Wilpshaar, M., and Brinkhuis, H.: Umbria-Marche revisited: A refined Magnetostratigraphic calibration of dinoflagellate cyst events for the Oligocene of the Western Tethys, Rev. Palaeobot. Palyno., 158, 213–235, https://doi.org/10.1016/j.revpalbo.2009.09.002, 2010.
Prothero, D. R.: The Eocene-Oligocene Transition: Paradise Lost, Columbia University Press, 291 pp., 1994.
Quaijtaal, W. and Brinkhuis, H.: Pentadinium alabamensis: A new, unusual dinoflagellate from the early Oligocene of the Gulf Coast, Alabama, USA, Rev. Palaeobot. Palyno., 175, 47–54, https://doi.org/10.1016/j.revpalbo.2012.03.002, 2012.
Raup, D. M. and Sepkoski, J. J.: Mass extinctions in the Marine fossil record, Science, 215, 1501–1503, 1982.
Scher, H. D., Bohaty, S. M., Zachos, J. C., and Delaney, M. L.: Two-stepping into the icehouse?: East Antarctic weathering during progressive ice-sheet expansion at the Eocene – Oligocene transition, Geology, 39, 383–386, https://doi.org/10.1130/G31726.1, 2011.
Śliwińska, K. K., Abrahamsen, N., Beyer, C., Brünings-Hansen, T., Thomsen, E., Ulleberg, K., and Heilmann-Clausen, C.: Bio-and magnetostratigraphy of Rupelian–mid Chattian deposits from the Danish land area, Rev. Palaeobot. Palyno., 172, 48–69, 2012.
Stickley, C. E., Brinkhuis, H., McGonigal, K. L., Chaproniere, G. C. H., Fuller, M., Kelly, D. C., Nürnberg, D., Pfuhl, H. A., Schellenberg, S. A., Schoenfeld, J., Suzuki, N., Touchard, Y., Wei, W., Williams, G. L., Lara, J., and Stant, S. A.: Late Cretaceous-Quaternary Biomagnetostratigraphy of ODP Sites 1168, 1170, 1171, and 1172, Tasmanian Gateway, Proceedings of the Ocean Drilling Program, Sci. Res., 189, 1–57, 2004.
Stover, L. E. and Williams, G. L.: Morphology and stratigraphy of the the Paleogene dinoflagellate genus Areosphaeridium Eaton, 1971, in: Proc. 7th Int. Palynol. Conf., Brisbane (Abstracts), p. 157, 1988.
Stover, L. E., Brinkhuis, H., Damassa, S. P., De Verteuil, L., Helby, R. J., Monteil, E., Partridge, A. D., Powell, A. J., Riding, J. B., and Smelror, M.: Mesozoic-Tertiary dinoflagellates, acritarchs and prasinophytes, Palynology: principles and applications, 2, 641–750, 1996.
Tew, B. H.: Sequence stratigraphy, lithofacies relationships, and paleogeography of Oligocene strata in southeastern Mississippi and southwestern Alabama, Geological Survey of Alabama, Stratigraphy and Paleontology Division, 146, 73 pp., 1992.
Tew, B. H. and Mancini, E. A.: An Integrated Stratigraphic Method for Paleogeographic Reconstruction: Examples from the Jackson and Vicksburg Groups of the Eastern Gulf Coastal Plain, Palaios, 10, 133–153, https://doi.org/10.2307/3515179, 1995.
Thomsen, E., Abrahamsen, N., Heilmann-Clausen, C., King, C., and Nielsen, O. B.: Middle Eocene to earliest Oligocene development in the eastern North Sea Basin: Biostratigraphy, Magnetostratigraphy and palaeoenvironment of the Kysing-4 borehole, Denmark, Palaeogeogr. Palaeocl., 350–352, 212–235, https://doi.org/10.1016/j.palaeo.2012.06.034, 2012.
Van Mourik, C. A. and Brinkhuis, H.: The Massignano Eocene-Oligocene golden spike section revisited, Stratigraphy, 2, 13–29, 2005.
Van Mourik, C. A., Brinkhuis, H., and Williams, G. L.: Mid- to Late Eocene organic-walled dinoflagellate cysts from ODP Leg 171B, offshore Florida, Geological Society, London, Special Publications, 183, 225–251, https://doi.org/10.1144/GSL.SP.2001.183.01.11, 2001.
Vieira, M., Mahdi, S., and Osterloff, P.: New Early Paleocene (Danian) dinoflagellate cyst species from the Ormen Lange Field, Møre Basin, Norwegian Continental Shelf, Palynology, 42, 180–198, https://doi.org/10.1080/01916122.2017.1314390, 2018.
Villa, G., Fioroni, C., Pea, L., Bohaty, S., and Persico, D.: Middle Eocene-late Oligocene climate variability: Calcareous nannofossil response at Kerguelen Plateau, Site 748, Mar. Micropaleontol., 69, 173–192, https://doi.org/10.1016/j.marmicro.2008.07.006, 2008.
Wade, B. S., Pearson, P. N., Berggren, W. A., and Pälike, H.: Review and revision of Cenozoic tropical planktonic foraminiferal biostratigraphy and calibration to the geomagnetic polarity and astronomical time scale, Earth-Sci. Rev., 104, 111–142, https://doi.org/10.1016/j.earscirev.2010.09.003, 2011.
Wade, B. S., Houben, A. J. P., Quaijtaal, W., Schouten, S., Rosenthal, Y., Miller, K. G., Katz, M. E., Wright, J. D., and Brinkhuis, H.: Multiproxy record of abrupt sea-surface cooling across the Eocene-Oligocene transition in the Gulf of Mexico, Geology, 40, 159–162, https://doi.org/10.1130/G32577.1, 2012.
Westerhold, T., Röhl, U., Pälike, H., Wilkens, R., Wilson, P. A., and Acton, G.: Orbitally tuned timescale and astronomical forcing in the middle Eocene to early Oligocene, Clim. Past, 10, 955–973, https://doi.org/10.5194/cp-10-955-2014, 2014.
Williams, G. L.: Dinoflagellate and spore stratigraphy of the Mesozoic-Cenozoic, offshore eastern Canada, Geological Survey of Canada, Paper 74–30, 3, 107–161, 1975.
Williams, G. L.: Dinocysts: their classification, biostratigraphy and palaeoecology, Oceanic Micropalaeontology, Academic Press, London, 2, 1231–1325, 1977.
Williams, G. L.: Morphology and stratigraphic ranges of selected Mesozoic-Cenozoic dinoflagellate taxa in the Northern Hemisphere, Geol. Surv. Can. Pap., 92, 137 pp., 1993.
Williams, G. L. and Bujak, J. P.: Mesozoic and Cenozoic Dinoflagellates, in: Plankton Stratigraphy: Vol. 2, Radiolaria, Diatoms, Silicoflagellates, Dinoflagellates and Ichthyoliths, edited by: Bolli, H. M., Saunders, J. B., and Perch-Nielsen, K., Cambridge Earth Science Series, 847–964, 1985.
Williams, G. L. and Manum, S. B.: Oligocene – early Miocene dinocyst stratigraphy of Hole 985A (Norwegian Sea), Proceedings of the Ocean Drilling Program, Sci. Res., 162, 99–109, 1999.
Williams, G. L., Brinkhuis, H., Pearce, M. A., Fensome, R. A., and Weegink, J. W.: Southern Ocean and global dinoflagellate cyst events compared: index events for the Late Cretaceous–Neogene, in Proceedings of the Ocean Drilling Program, Sci. Res., 189, 1–98, 2004.
Williams, G. L., Fensome, R. A., and Macrae, R. A.: The Lentin and Williams Index of Fossil Dinoflagellates 2017 Edition Aasp Contributions Series Number 48, American Association of Stratigraphic Palynologists Contributions Series, 48, 1–1097, 2017.
Wilpshaar, M., Santarelli, A., Brinkhuis, H., and Visscher, H.: Dinoflagellate cysts and mid-Oligocene chronostratigraphy in the central Mediterranean region, J. Geol. Soc., 153, 553–561, https://doi.org/10.1144/gsjgs.153.4.0553, 1996.
Wilson, G. J.: Paleocene and Eocene dinoflagellate cysts from Waipawa, Hawkes Bay, New Zealand, New Zealand Geological Survey, 57, 96 pp., 1988.
Zachos, J., Pagani, M., Sloan, L., Thomas, E., and Billups, K.: Trends, Rhythms, and Aberrations in Global Climate 65 Ma to Present, Science, 292, 686–693, https://doi.org/10.1126/science.1059412, 2001.
Zachos, J. C., Quinn, T. M., and Salamy, K. A.: High-resolution (10 4 years) deep-sea foraminiferal stable isotope records of the Eocene-Oligocene climate transition, Paleoceanography, 11, 251–266, https://doi.org/10.1029/96PA00571, 1996.
Zachos, J. C., Opdyke, B. N., Quinn, T. M., Jones, C. E., and Halliday, A. N.: Early cenozoic glaciation, antarctic weathering, and seawater 87Srr 86Sr: is there a link?, Chem. Geol., 161, 165–180, 1999.
Zachos, J. C., Dickens, G. R., and Zeebe, R. E.: An early Cenozoic perspective on greenhouse warming and carbon-cycle dynamics, Nature, 451, 279–283, https://doi.org/10.1038/nature06588, 2008.


