the Creative Commons Attribution 4.0 License.
the Creative Commons Attribution 4.0 License.
 | 22 Oct 2021
Semantic segmentation of vertebrate microfossils from computed tomography data using a deep learning approach
Mario Canul-Ku
Xindong Cui
Rogelio Hasimoto-Beltran
Vertebrate microfossils have broad applications in evolutionary biology and stratigraphy research areas such as the evolution of hard tissues and stratigraphic correlation. Classification is one of the basic tasks of vertebrate microfossil studies. With the development of techniques for virtual paleontology, vertebrate microfossils can be classified efficiently based on 3D volumes. The semantic segmentation of different fossils and their classes from CT data is a crucial step in the reconstruction of their 3D volumes. Traditional segmentation methods adopt thresholding combined with manual labeling, which is a time-consuming process. Our study proposes a deep-learning-based (DL-based) semantic segmentation method for vertebrate microfossils from CT data. To assess the performance of the method, we conducted extensive experiments on nearly 500 fish microfossils. The results show that the intersection over union (IoU) performance metric arrived at least 94.39 %, meeting the semantic segmentation requirements of paleontologists. We expect that the DL-based method could also be applied to other fossils from CT data with good performance.
- Article
(3294 KB) - Full-text XML
- BibTeX
- EndNote


Paleozoic vertebrate microfossils provide important evidence for biostratigraphy, paleobiodiversity, and paleogeography (Zhao and Zhu, 2014; Zhao et al., 2018; Ogg et al., 2016; Märss et al., 1995; Žigaitė et al., 2011; Wang, 2006), as well as oil and gas exploration (Hackley et al., 2017; Funkhouser and Evitt, 1959). As one subset of vertebrate microfossils, fish microfossils significantly contribute to the study of early vertebrate evolution (Janvier, 1996; Cui et al., 2020; Wang, 1984; Chen et al., 2016; Botella et al., 2007; Cui et al., 2021).
In recent years, thanks to the widespread use of computed tomography (CT) technologies in paleontology, virtual paleontology (VP) has rapidly developed (Lautenschlager, 2016; Sutton et al., 2017; Sutton, 2008; Cunningham et al., 2014). Paleontologists can nondestructively obtain more comprehensive three-dimensional (3D) fossil CT data, including 3D microstructures from inside to the surface (Fernandez et al., 2012, 2013, 2015). Digital techniques have also been used to classify fish microfossils in 3D volumes (Cui et al., 2020, 2021). Semantic image segmentation is a crucial step in the reconstruction of 3D volumes. However, this task requires a lot of time in addition to expertise in paleontology.
The purpose of this research paper is to create an effective method for semantic segmentation of vertebrate microfossils from CT data. We chose the deep-learning-based (DL-based) U-Net (Ronneberger et al., 2015) and ResNet34 (He et al., 2016) model for semantic image segmentation. First, we compiled a dataset containing four types of fish microfossils from CT data, which were segmented and labeled by reconstructors. Second, we used ResNet34 as the main encoder part of the U-Net model. An end-to-end U-Net model with ResNet34 was designed and trained to solve the semantic segmentation problem. The weights of the optimal network were saved during the training process and then used to semantically segment the microfossils from CT data. Finally, the performance of the DL-based segmentation method was compared to the popular segmentation methods and verified using the global intersection over union (IoU) scores.
2.1 Popular segmentation method
In practice, paleontologists usually use 3D virtual models of microfossils to classify them (Andreev et al., 2016; Cui et al., 2020; Qu et al., 2017). They collect microfossil CT data using micro-CT, segment the data, and generate 3D models. This part provides an introduction to the popular binary segmentation methods. The CT data quality may be degraded by various factors including ring artifacts and background noise. To achieve accurate segmentation, the CT data stack should be optimized, which usually includes noise reduction, image enhancement, and image simplification (Buser et al., 2020). Popular binary segmentation methods include thresholding, morphological filtering, region growing, and boundary detecting (Serra and Vincent, 1992; Ziou and Tabbone, 1998; Sahoo et al., 1988). Various image segmentation methods have been applied to fossil images (Ni et al., 2012; Pérez-Ramos and Figueirido, 2020). Thresholding is performed by assigning a visual attention level to the greyscale values. Any part of the CT data above this level is considered a region of interest (ROI) (Goh et al., 2018). Region-growing methods employ seed points manually added by reconstructors. A segmented ROI is then spread from the seed to neighboring voxels that meet certain predefined criteria (Adams and Bischof, 1994). Segmentation based on an edge detector offers an alternative method that discerns the boundary between ROIs and defines these voxels as an edge (Bhardwaj and Mittal, 2012).
2.2 Manual semantic segmentation method
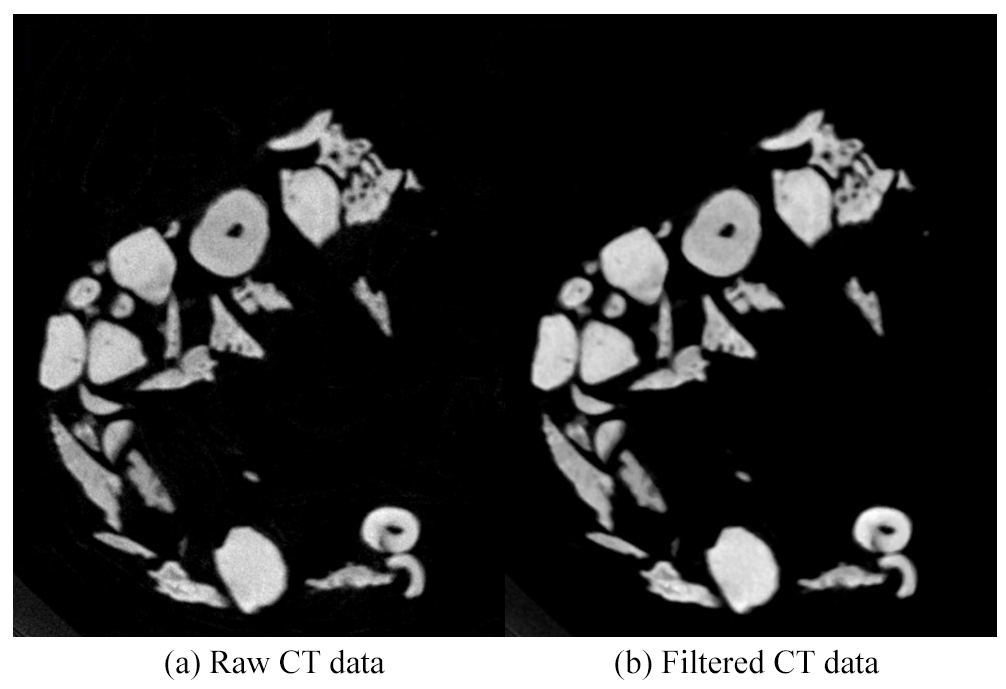
In our laboratory, image processing technologies were used to segment fish microfossils in CT data. First, we filtered out the influence of random noise from the data. Based on the excellent performance of a median filtering algorithm, we used a 3×3 median filter to eliminate the random noise generated during the scanning process (Omer et al., 2018), defined as follows:
where I(i,j) is the output of the median filter, IH(i,j) is the grey value of the pixels in the neighborhood, and the median function is the median of sequence IH(i,j). The CT data before and after median filtering are shown in Fig. 1. The random noise was reduced after median filtering, especially inside the microfossils.
Fish microfossils have a much higher mass density than the surrounding air and transparent plastic wrap for fossil support. The microfossil images have significantly different grey values from the surrounding background. We used this contrast to segment the fossils in CT data. A typical binary thresholding algorithm such as the Otsu (Otsu, 1979) selects objects of interest from the background, producing binary images of the objects (fish microfossils in our case). A binarization process converts the grey value of each pixel to 0 (black) or 1 (white) using black to represent the background and white to represent the objects of interest. In this paper, black denotes air and plastic wrap, while white denotes fish microfossils. With an appropriate threshold, most fish microfossils in CT data can be binarized using the Otsu method (see Fig. 2a).
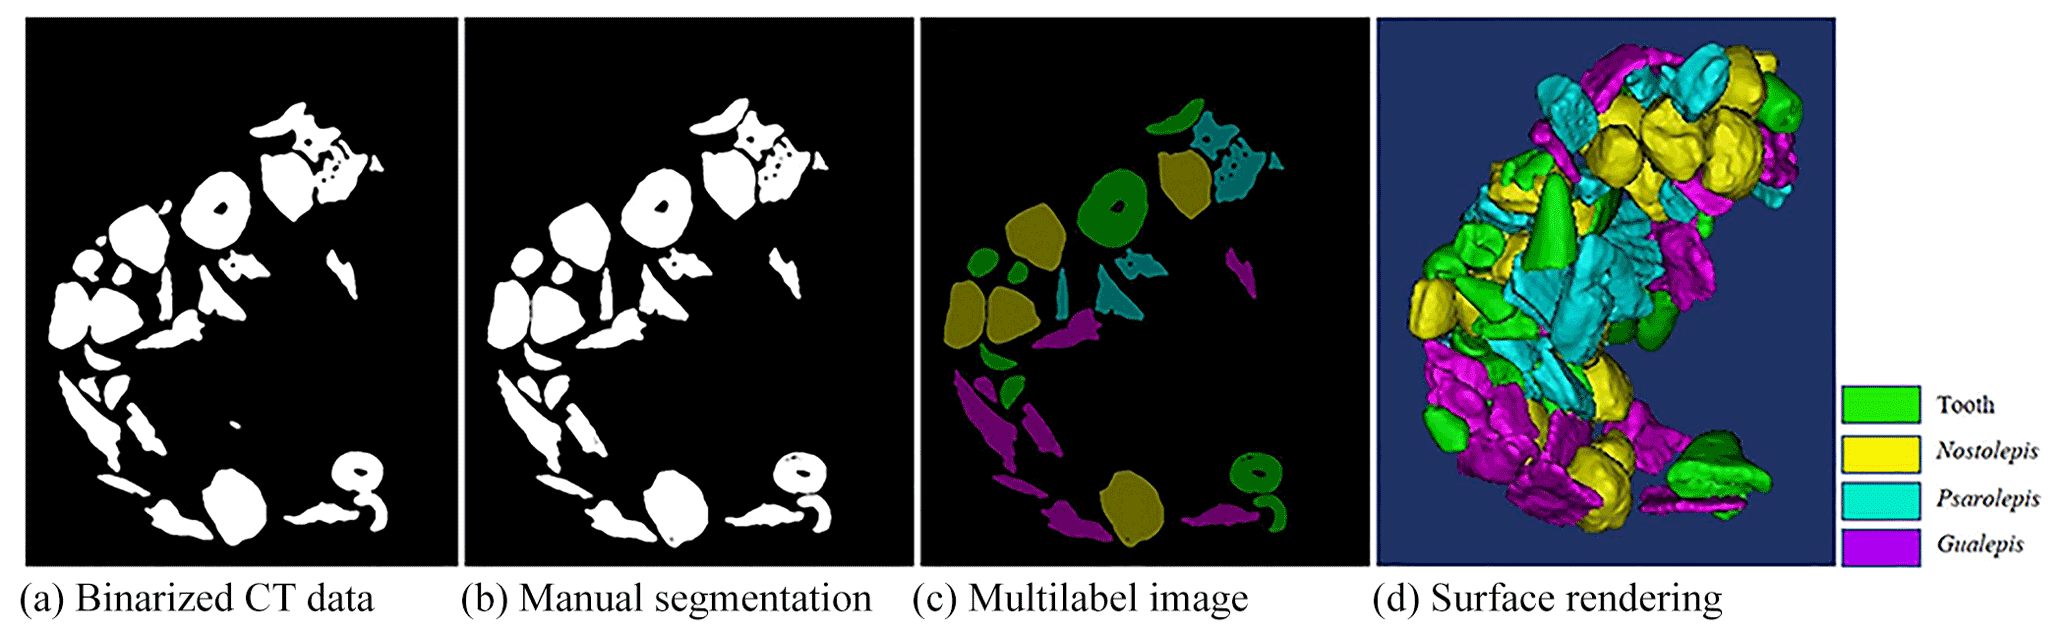
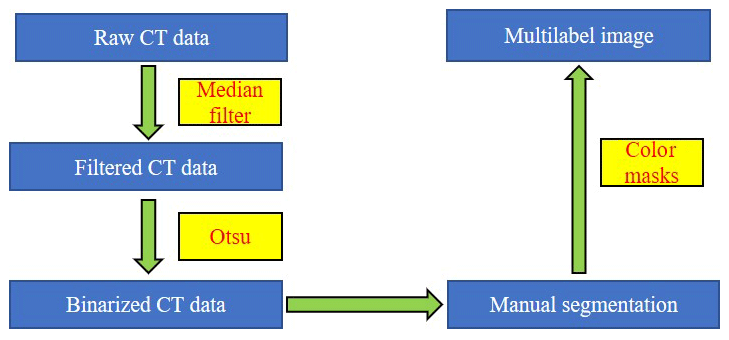
The fish microfossils are inevitably in contact during the scanning process. It is difficult to obtain ideal object segmentation on some digitally connected areas. We can only manually segment these areas one by one. Fish microfossils are manually segmented by reconstructors, who usually determine the assignment or affinity of the fish microfossil image regions based on their gross morphology (see Fig. 2b). The reconstructors apply color to the masks automatically and create multilabel images for training the network (see Fig. 2c). Finally, 3D models of the microfossils are generated using a surface-rendering technique (Racicot, 2017) with different colors, each color associated with a unique type of microfossil (see Fig. 2d). This process is one of the main methods to reconstruct the 3D structure of fish microfossils. Figure 3 shows the workflow of the manual semantic segmentation of fish microfossils in our laboratory.
3.1 Network structure
Manual semantic segmentation consumes a lot of time and requires expertise in paleontology to accomplish. We need to find an alternative technique. Deep learning is a popular research area in the field of machine learning and artificial intelligence, which has made great progress in the last decade (LeCun et al., 2015). DL-based techniques have achieved excellent performance in various computer vision tasks such as image denoising (Tian et al., 2020), target detection (Khan et al., 2017), image classification (Xu et al., 2020), and image segmentation (Jin et al., 2018). Paleontologists are utilizing the capabilities of deep neural networks (DNNs) to solve paleontological problems (Marchant et al., 2020; Tetard et al., 2020; Bourel et al., 2020). DNNs can be exploited not only for the accurate classification of vertebrate fossils from their 3D volumes (Hou et al., 2020), but also for the rapid documentation of discrete fossiliferous levels (Martín-Perea et al., 2020). DNNs have achieved impressive performance and present great potential in the field of paleontology.
Semantic image segmentation is also an important application of deep learning that separates a single image into different parts. U-Net is a classic network for semantic segmentation that performs well in microfossil images, especially CT data. The U-Net model has been successfully utilized for planktonic foraminifera recognition (Carvalho et al., 2020; Ge et al., 2020), charcoal particle identification (Rehn et al., 2019), and other micropaleontology tasks. In this paper, we chose an improved U-Net model to semantically segment fish microfossils from CT data. We used the CT data with manual semantic segmentation as the training set. The boundaries between touching particles in the dataset were manually labeled by reconstructors. The DNNs could continuously learn the marked boundaries through feature extraction. Therefore, we could use the data to train the network and solve the separation problem of touching particles.
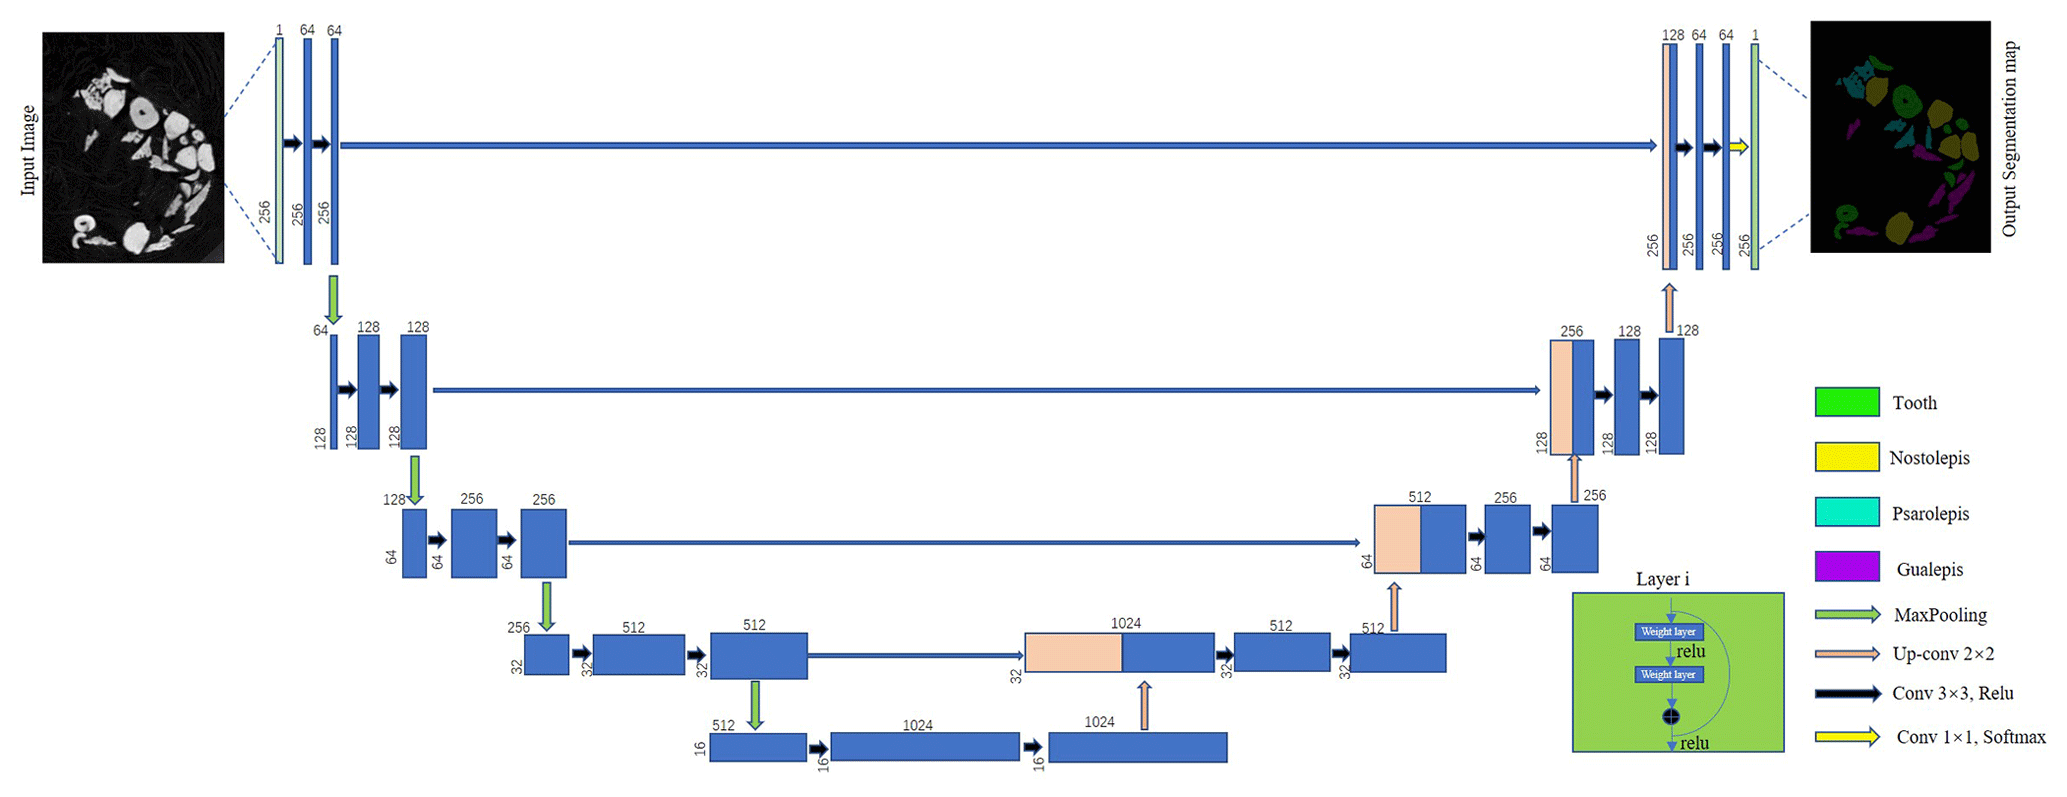
The U-Net model can perform semantic segmentation of CT data at the pixel level. The model consists of three parts: encoder, connector, and decoder. The encoder uses a convolutional layer to extract features from the input images. Within the encoder layer, pooling layers are applied to decrease the scale, speed up feature detection, and reduce the computational burden. The connector represents a copy operation to concatenate the features at the same scale extracted by down-sampling and up-sampling on the same channel. The decoder uses a deconvolution layer to restore the characteristic image to the size of the input images and predict the results.
Similarly, our defined network also comprises three parts: encoder, connector, and decoder. A residual module is introduced into the encoder part. The calculation of the residual module is shown in Eqs. (2) and (3):
where xl and xl+1 are the input and output of the lth residual module, F(xl,Wl) is the residual function, h(xl) is the identity mapping function, and f(yl) is the rectified linear unit (ReLU) activation function. Under normal circumstances, h(xl)=xl, and the size and quantity of feature maps are the same at the same stage. When entering the next stage, the feature map size becomes of the original and the number is doubled.
Our network uses a pre-trained ResNet34 as the backbone for the encoder. ResNet34 is a residual network based on the convolutional neural network (CNN). Compared to traditional neural networks, the most significant difference is that the original input is added to the output of the convolution block. When the layers of the network are deeper, more features can be extracted and the image semantics can be better expressed. Traditional neural networks face serious vanishing gradient and network degradation problems (Wu et al., 2019). The addition of a residual block solves this problem, and the resulting network is much easier to optimize. ResNet34 in the encoder part is used to extract features. In this process, there are four stages and each stage has several residual modules.
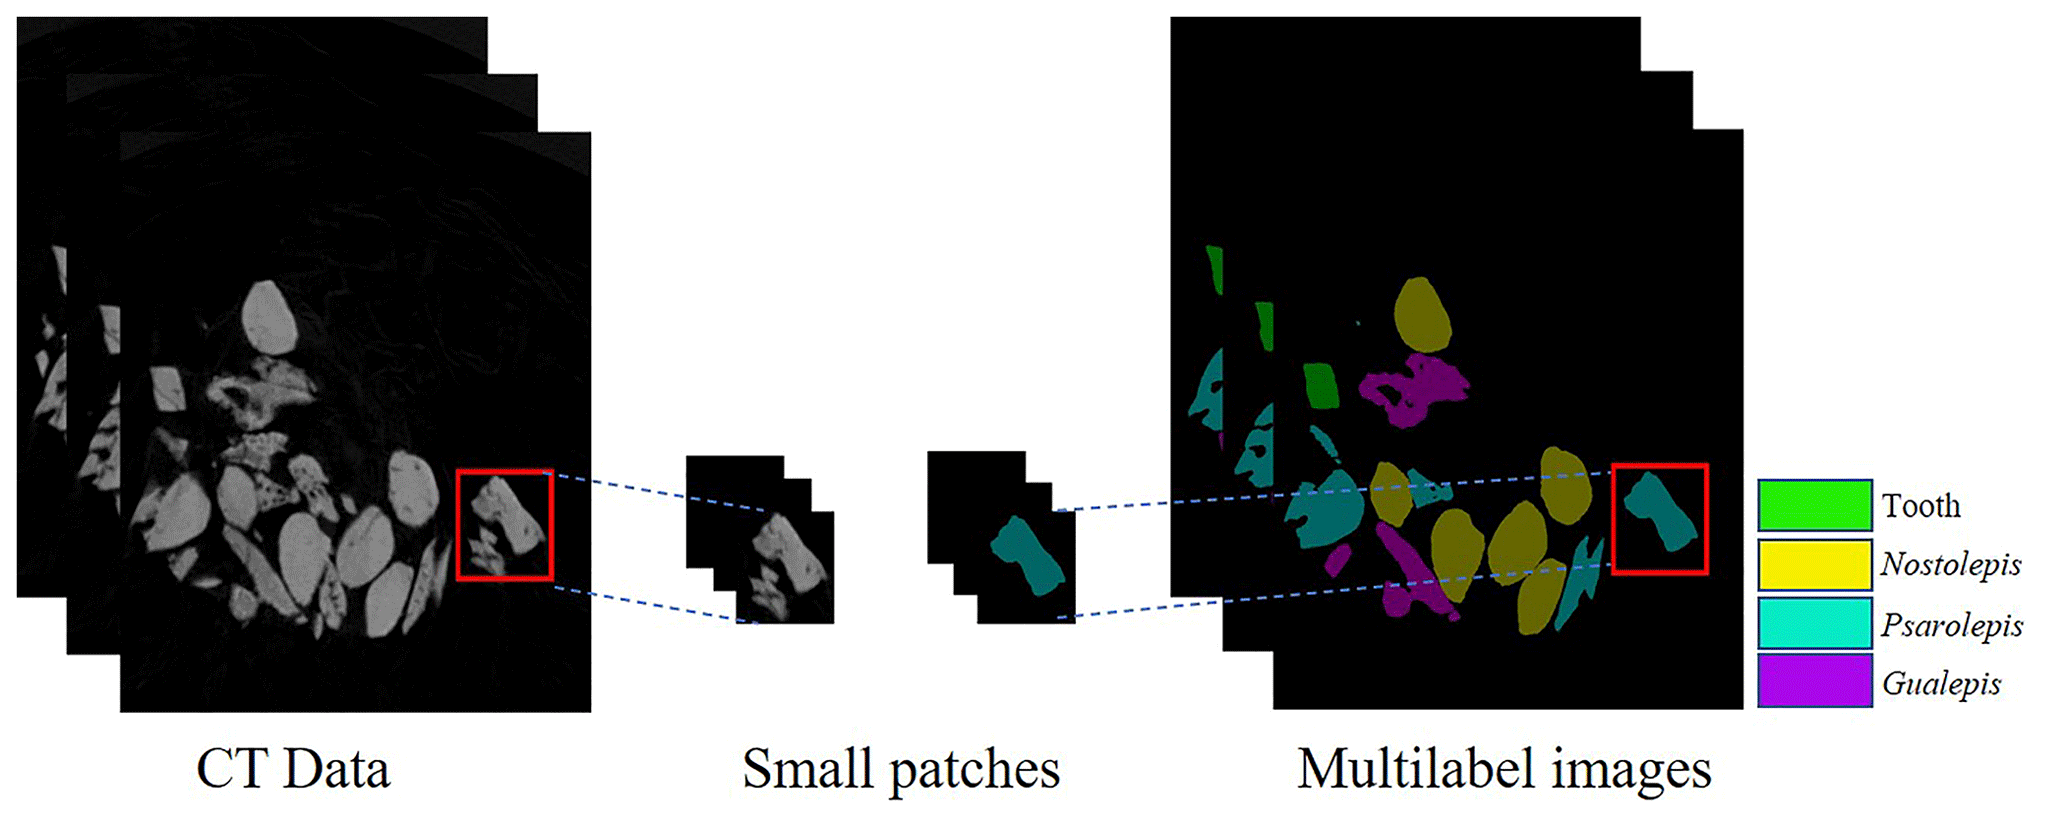
The pixel level has a great influence on the computing costs and prediction results. To support the training process and graphics processing unit (GPU) memory limit, the CT data and labels on the datasets are randomly cropped into small patches of 256×256 pixels in size (see Fig. 4). Our method can crop an arbitrarily sized image, and therefore it can be applied to different image sizes according to the hardware capacity. This process can also be regarded as data enhancement to prevent overfitting and obtain a more robust network. Our method can perform image segmentation at the pixel level when the network and GPU meet its constraints.
The input image is designed to be a patch of 256×256 pixels. The input layer is followed by a normalization layer and a maximum pooling layer. The activation function of the network is based on the ReLU activation function. Four 2×2 max pooling layers perform down-sampling, which plays a crucial role in dimensionality reduction and image feature extraction.
The connector, the middle jump connection part inspired by the feature pyramid network (FPN), is designed as a pyramidal hierarchical structure (Lin et al., 2017). The connector concatenates the feature maps from the encoding unit to the decoding unit to achieve multiscale feature fusion. Then the feature maps are input to the decoder to semantically segment the fish microfossils from CT data.
The decoder part also consists of four stages. Each stage includes an up-sampling process that uses a transposed convolutional layer with a 2×2 kernel, feature connection, and two convolutional layers with 3×3 kernels. The size and number of feature maps are the same at the same stage as in the encoder part. Finally, the feature maps are output through a convolutional layer with a 1×1 kernel and a softmax activation function. The different types of fish microfossils and backgrounds are semantically segmented from CT data with multiclass probabilities.
The U-Net + ResNet34 network in this paper solves the vanishing gradient problem caused by the increased numbers of layers. The network's pyramid structure combines multiscale features at different levels, helping to restore the edge profiles of fish microfossils from CT data. Figure 5 shows the network of the DL-based semantic segmentation method.
3.2 Network training
The U-Net model can perform semantic segmentation for an arbitrarily sized image. To match the network and GPU memory, we randomly cropped the CT data and labels with a sliding window to patches having a fixed size of 256×256 pixels (see Fig. 4).
Semantic segmentation is like a multiclass classification problem that assigns labels to pixels in an image. We chose a multiclass cross-entropy function as our loss function. The function calculated the difference between true labels and predicted labels. Then we updated the weights of the network and improved its performance on the training set with this function. To obtain better-performing model parameters, the Adam algorithm was chosen to optimize the weights (Kingma and Ba, 2014). The training process ran a total of 20 iterations. The batch size was set to 8, and the initial learning rate was given to 0.0001. The formula of the loss function is shown in Eq. (4):
where n is the pixel number in the images and k is the number of categories. is the predicted category. yi is the true label.
We applied the U-Net + ResNet34 model for semantic segmentation at the pixel level. We trained the model to minimize the loss function with a training set and a cross-validation set. We used the test sets to verify the effectiveness of the DL-based method. However, the final network needs to have not only a good structure but also labels as a “gold standard”. We used the manual semantic segmentation method to create experimental datasets for training the network.
The method proposed in this paper was implemented using Keras (Chollet, 2015), which has been widely used in many other tasks such as medical image segmentation and fossil classification (Hou et al., 2020). The computer has an Nvidia RTX 2080Ti GPU, 128 GB of memory, and an Intel XEON silver 4114 CPU.
4.1 Data preparation
We dissolved the matrix surrounding the samples from the Xitun Formation (Early Devonian) (Zhao et al., 2021) with a 3 %–7 % acetic acid solution. The fish microfossils were separated under a microscope from the processed samples (Cui et al., 2020; Li et al., 2021; Cui et al., 2021). All fish microfossils were collected and examined at the Institute of Vertebrate Paleontology and Paleoanthropology (IVPP) of the Chinese Academy of Sciences (CAS). We applied plastic wrap and a specially customized plastic tube to fix the specimens. We scanned the fixed microfossils with a 225 kV micro-CT scanner that had three main parts: X-ray tube (Phoenix XS-225D), detector (Varian 4030CB), and rotary table (HUBER 410). The scanner was designed by the Institute of High-Energy Physics (IHEP), CAS (Wang et al., 2019). The potential difference applied to the tube was 100 kV. The target current was set to 100 µA. The voxel size of the CT data was given as 5.96 µm. A total of 1440 projections were collected from 360∘ in 0.25∘ steps. The software for the computed tomography process was developed by IHEP, CAS. We obtained 1536 CT data points, each of which was 2048×2048 pixels in size with a 16 bit greyscale. We analyzed the data using Materialise's interactive medical image control system (Mimics) 18.0 software. To ensure that the dataset was at a “gold standard” level, we used the manual semantic segmentation method to create our experimental dataset. We set the appropriate grey-level thresholds, generated the masks, and separated different types of fish microfossils. Finally, we marked them with different colors as true labels in the experimental datasets. Figure 6 shows the process of the data preparation.

4.2 Experimental dataset
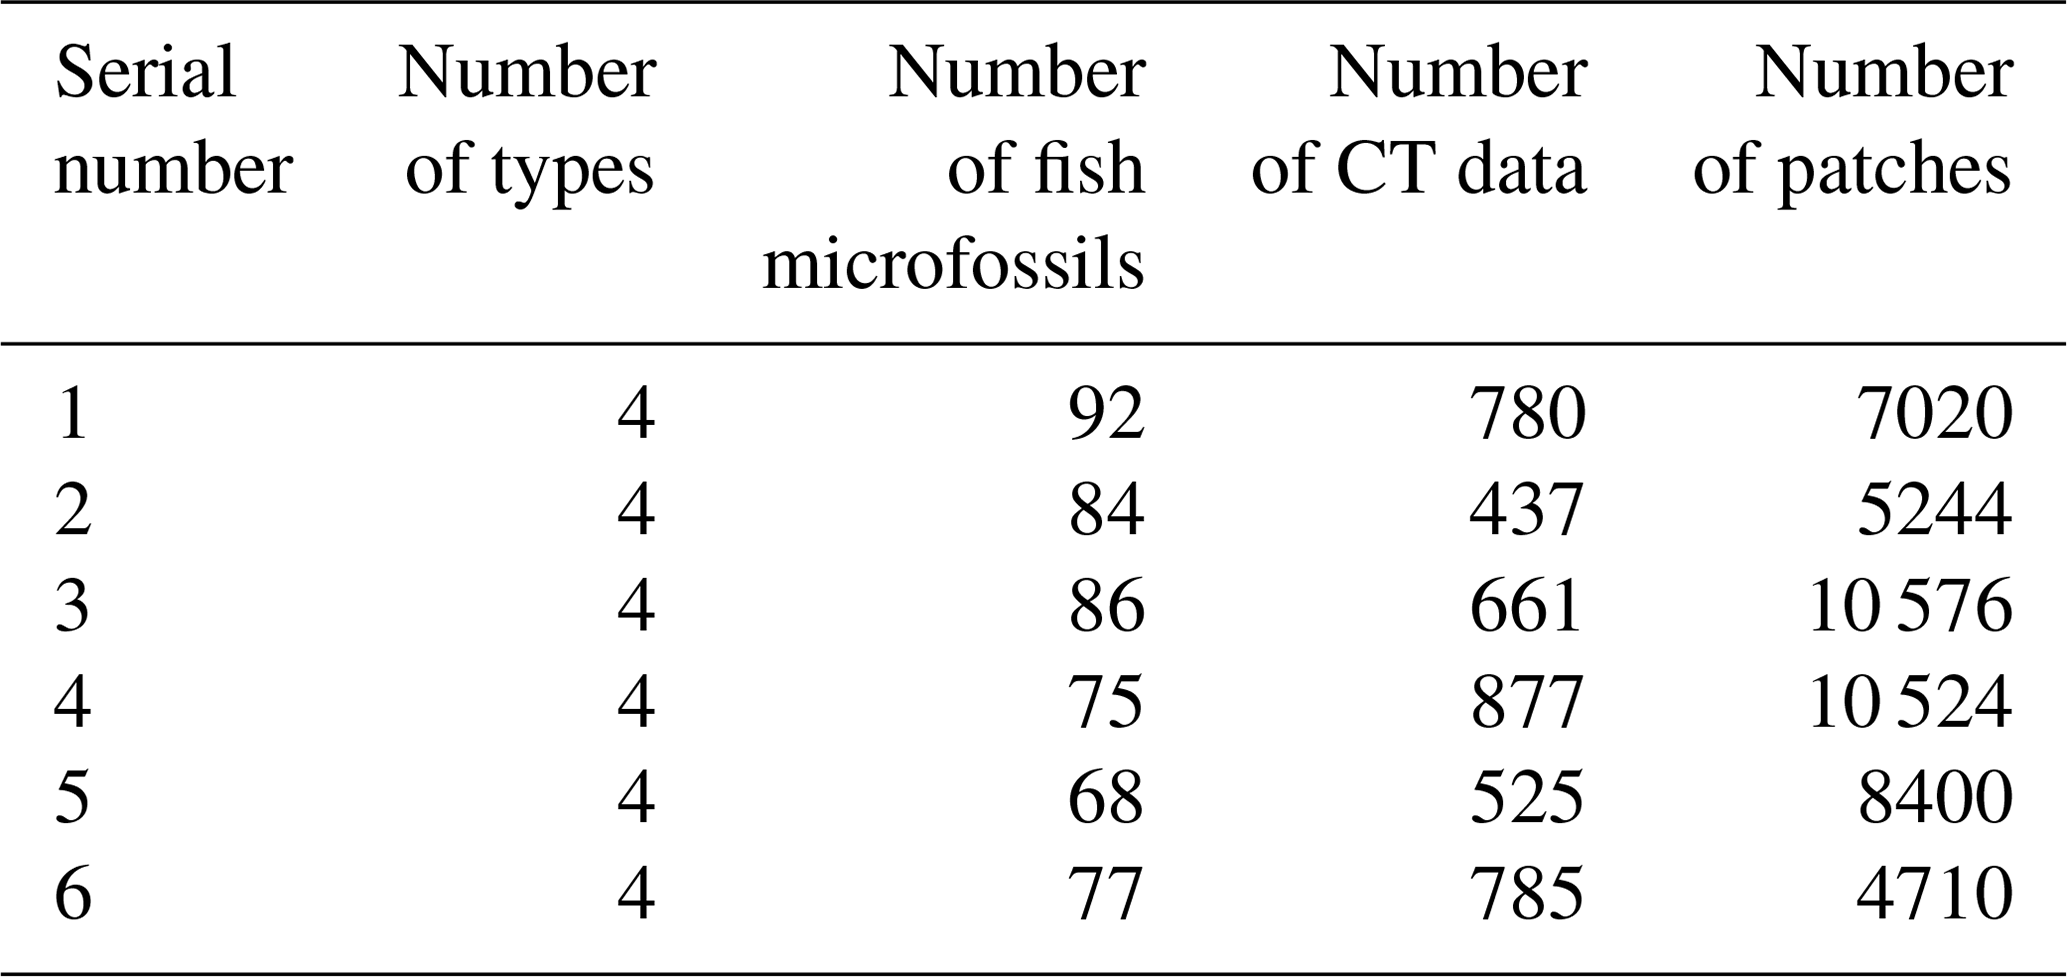
A total of six experimental datasets were compiled for this research. The number and placement of microfossils were different in different datasets. The details of the datasets are shown in Table 1. All the CT data in the datasets were manually marked with color masks as true labels, such as yellow associated with Nostolepis, green associated with teeth, blue associated with Psarolepis, and purple associated with Gualepis (see Fig. 2). We divided each experimental dataset into a training set and a test set. We used 80 % of the experimental dataset as the training set, 20 % of the training set as the cross-validation set, and 20 % of the experimental dataset as the test set.
4.3 Evaluation criteria
The multiclass approach was used to semantically segment all the pixels in CT data. Therefore, we performed a multiclass IoU as the evaluation criterion. IoU is a popular evaluation metric for DL-based semantic segmentation. We evaluated both the popular methods and the DL-based method using IoU. The IoU score is defined as the size of the intersection divided by the size of the union of the sample sets and computed as follows:
where TP is the true positive value, FP is the false positive value, and FN is the false negative value. The values were computed using all true labels and predicted labels at the pixel level in CT data.
The predicted labels were evaluated based on manually marked true labels. We performed semantic image segmentation of multiple types of fish microfossils. We calculated the IoU score of each type and their average to obtain a global index. IoUmacro is the average score, and the calculation formula is as follows:
where IoUi is the IoU of each type, IoUmacro is the average of the total type IoUs, and k is the number of types. When working with CT data, a global IoUmacro is reported to evaluate the data at their original resolution, and a local IoUmacro is used to evaluate all the patches in the test set.
5.1 Comparison with the popular segmentation method
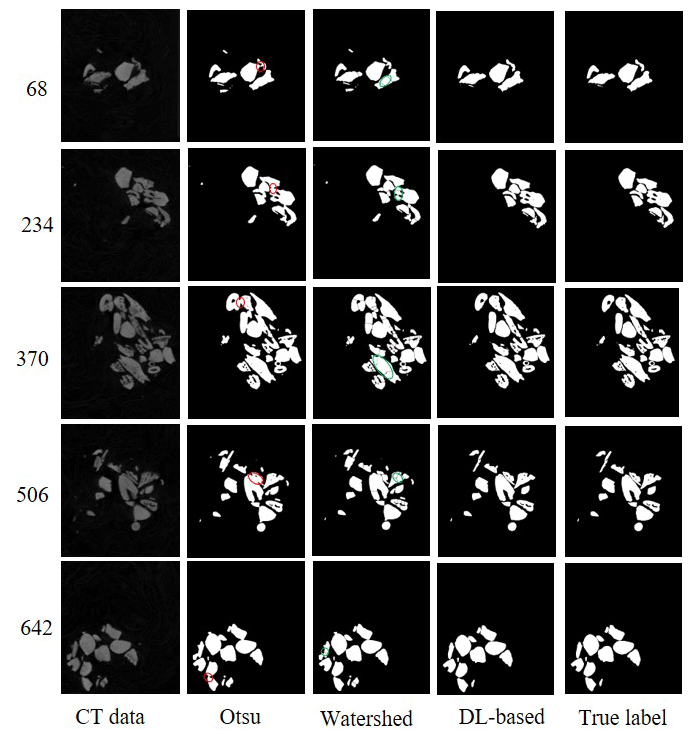
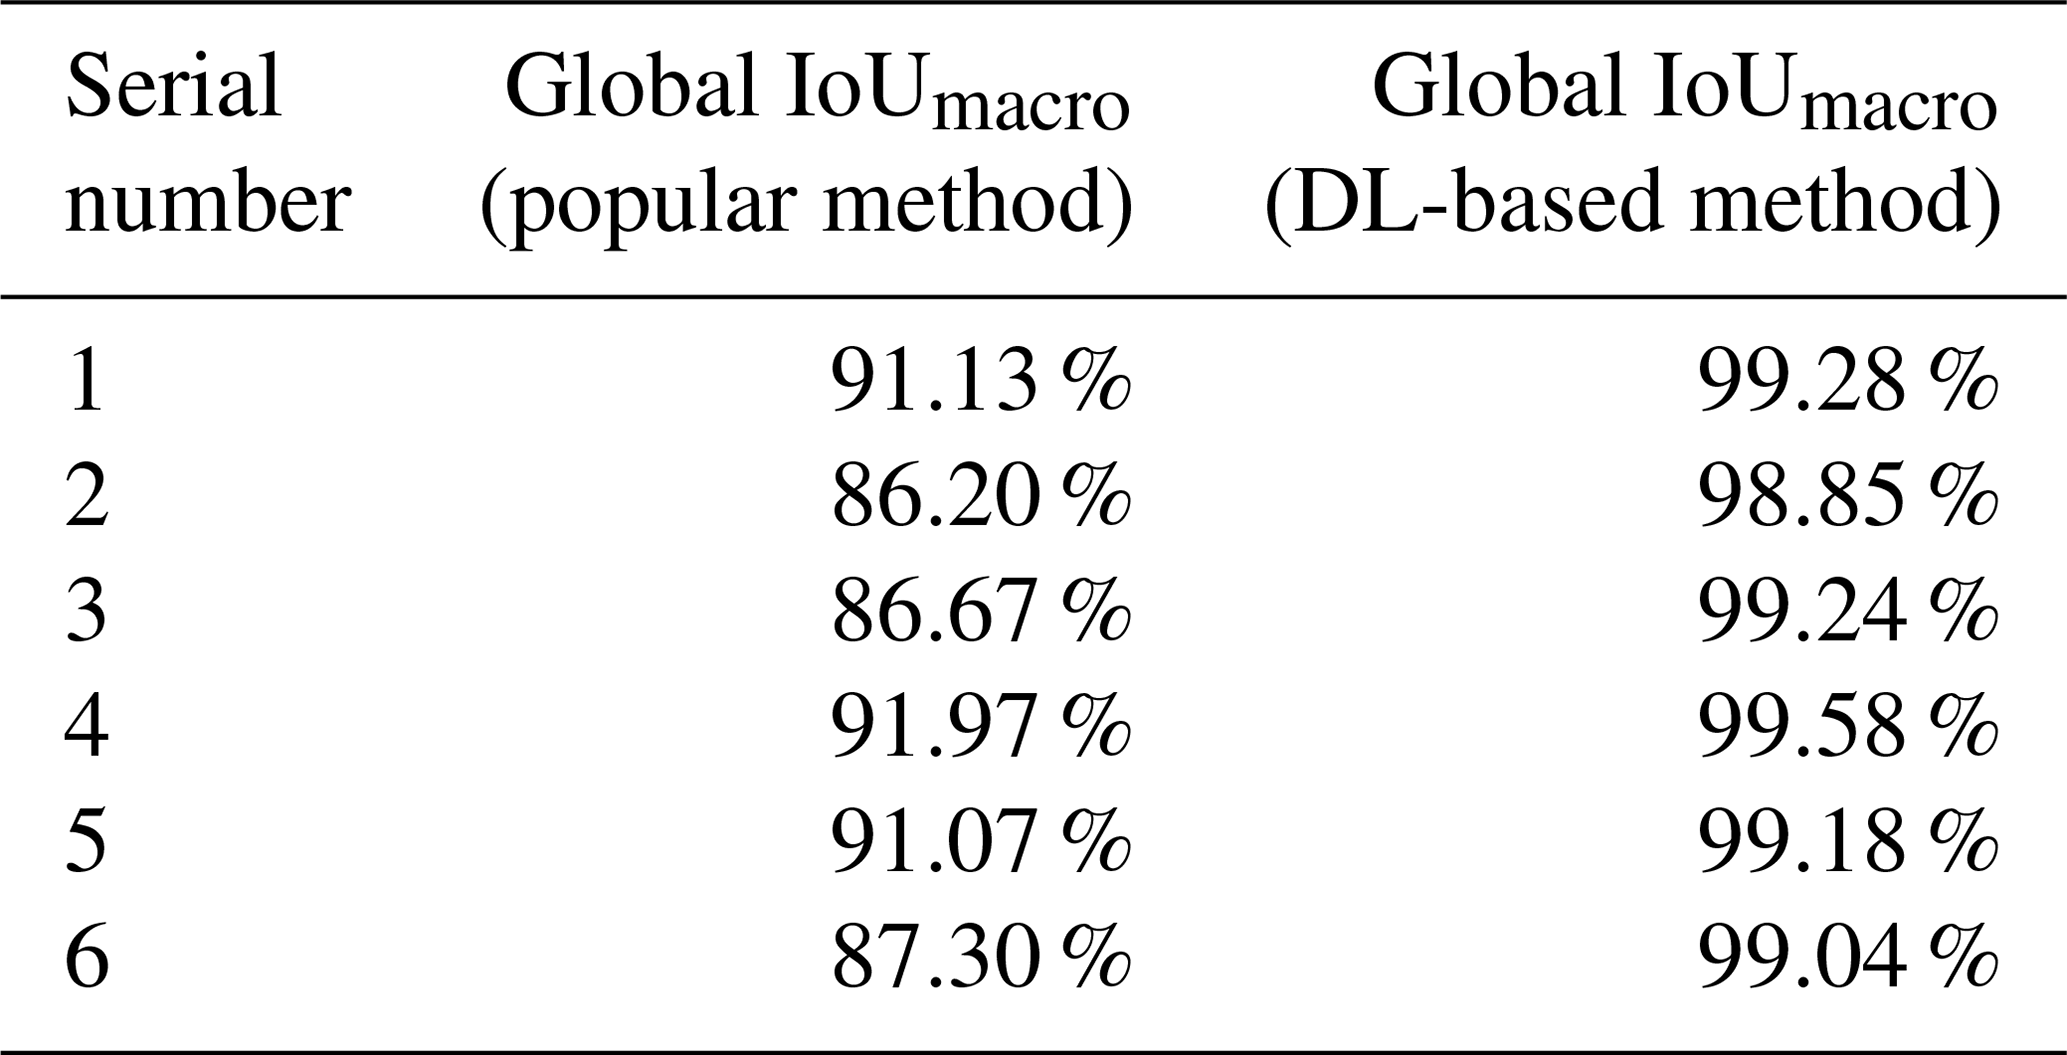
We compared the DL-based method with the popular method for all six experimental datasets. The popular segmentation method was based on automatic thresholding and watersheds (Roerdink and Meijster, 2000). For example, on the dataset SN1, we used the Otsu method for binary image segmentation. The digital connection problem of fish microfossils appeared as indicated by the red circles in Fig. 7. We also tried to use the watershed method to separate the fossils, yet the results were not as expected. It was difficult to isolate individual fossils using the watershed algorithm. A single fish microfossil was divided into several parts as indicated by the green circles in Fig. 7. The DL-based method showed better performance in segmenting the details than the popular method. Table 2 shows the global IoUmacro scores of the popular method and the DL-based method in binary image segmentation for all six experimental datasets. It can be seen from the experimental results that the DL-based method improved the global IoUmacro scores so that they were close to those of the reconstructors' manual segmentation.
Table 2Global IoUmacro scores of the binary image segmentation method.
5.2 Semantic image segmentation result
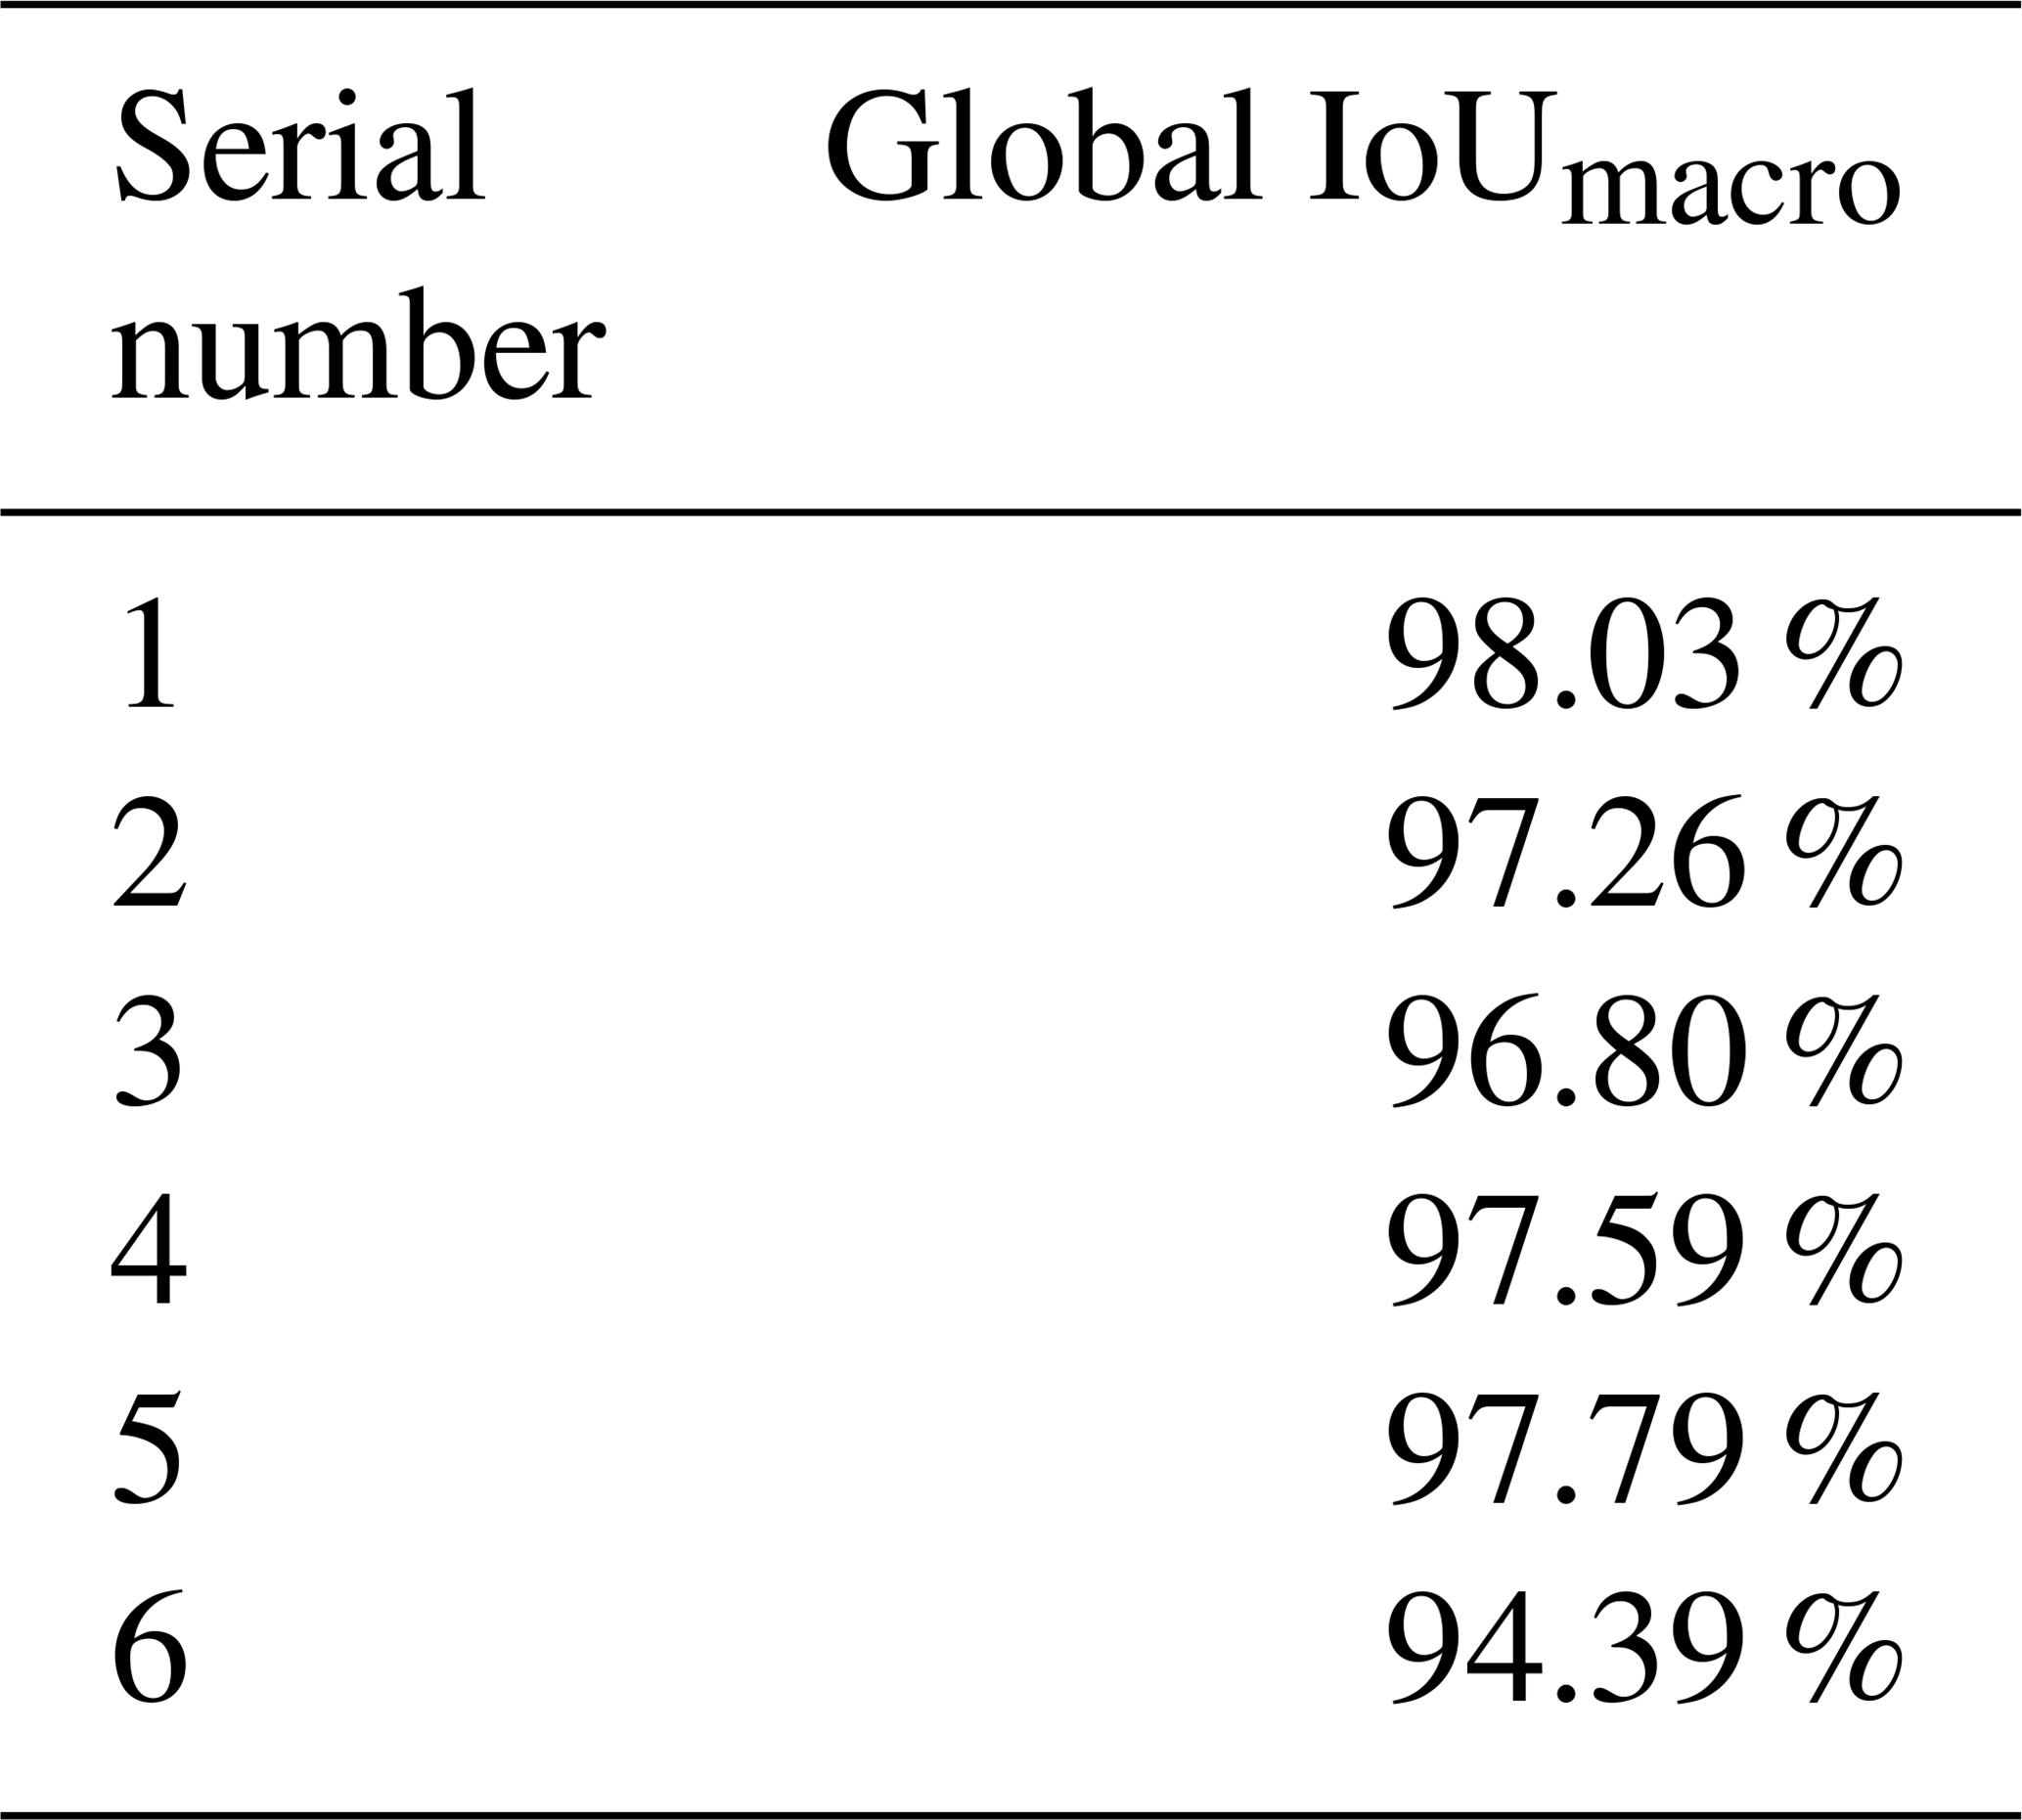
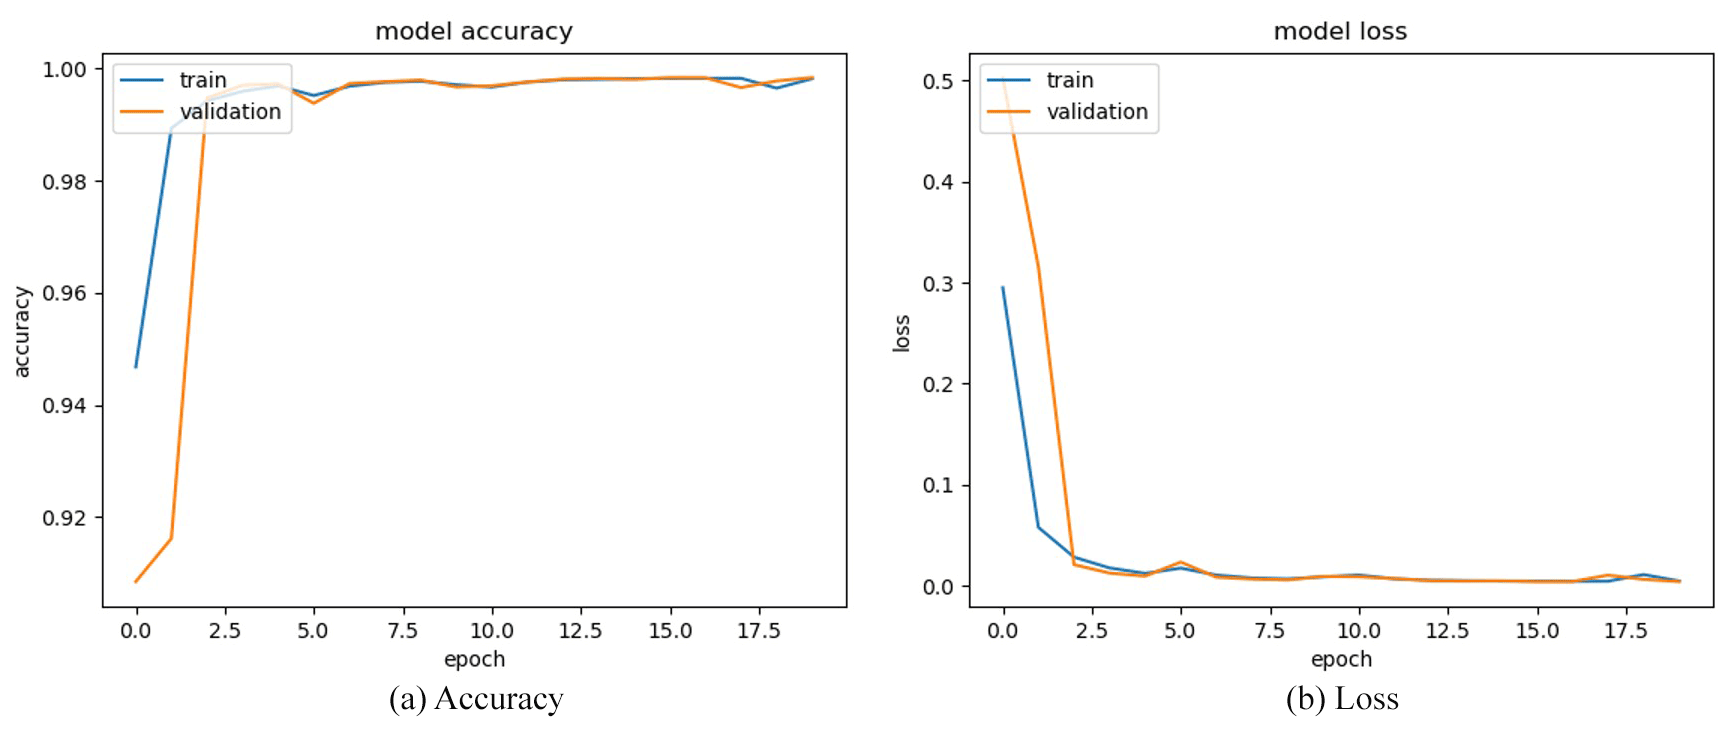
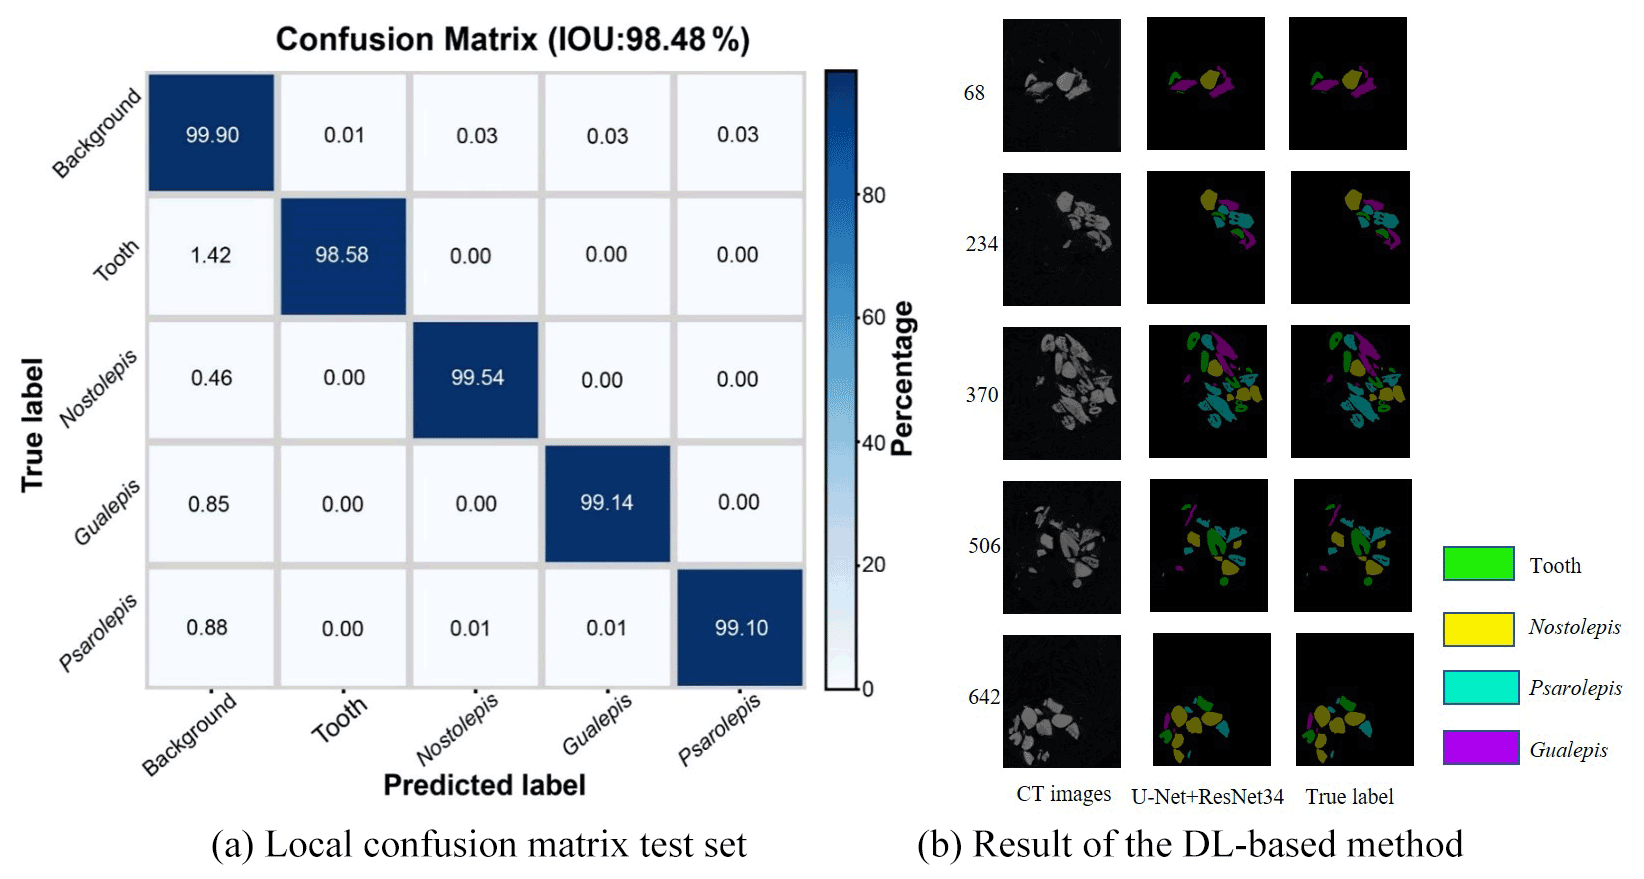
We obtained a limited number of tomograms and labels manually segmented by reconstructors to train the network. Then, we employed the full CT dataset with the trained DL program to accomplish semantic segmentation. We chose the global IoUmacro scores as the evaluation criteria for semantic image segmentation and obtained the scores for all six experimental datasets. The segmentation results showed that global IoUmacro scores were between 94 % and 98 %, as depicted in Table 3. The results demonstrate the versatility of the DL-based method. From the experimental results, the DL-based method achieved good performance and avoided overfitting. For example, on the dataset SN1, the segmentation accuracy and loss function curves of the experimental process showed few iterations reaching 99 % accuracy (Fig. 8a) with a small loss function result (Fig. 8b). The good performance was also supported by the local confusion matrix and the results of the DL-based semantic segmentation method on the test set, as shown in Fig. 9. The diagonal elements represent the classification accuracy for each category, while the off-diagonal elements are the percentage of classifier mislabels.
Table 3Global IoUmacro scores of the DL-based semantic segmentation method.
We proposed a DL-based semantic segmentation method for fish microfossils from CT data. We demonstrated that our method is effective and produces results close to those of manual segmentation. Our methodology was compared favorably with the popular segmentation method.
An essential step in the popular segmentation method selects the threshold for optimal binarization segmentation in the absence of prior knowledge (Nosrati and Hamarneh, 2016). The noise in images is manifested in different ways that depend on the target application (Sagheer and George, 2020). On the experimental dataset, for instance, the light grey-level noise from CT data corresponds to the relatively low-density plastic wrap used to fix the microfossils, while the remaining high grey represents the fish microfossils, mainly scales and teeth. The plastic wrap could not cleanly isolate each microfossil, leading to problems of digital connections between two or more fish microfossils. Experimental results show that the watershed algorithm (Roerdink and Meijster, 2000) cannot automatically detect the boundaries of fish microfossils. Therefore, the reconstructors have to manually segment the fish microfossils digitally connected. This process is time-consuming and requires expertise.
In this paper, we used the U-Net + ResNet34 network to semantically segment fish microfossils in CT data. We inserted ResNet34 into the U-Net model, which effectively solved the problems of overfitting, parameter redundancy, and deep degradation caused by too many network layers. The comparative experiments show that we achieved better results from binarization segmentation than the popular method. The global IoUmacro scores of the semantic segmentation also reached at least 94.39 % on the experimental datasets, meeting the requirements of paleontologists for segmenting fish microfossils from CT data.
Similarly, the DL-based method also encountered some challenges. The digitization of microfossils requires a series of tasks, such as the selection of specimens, the cost of using micro-CT, and the process of labeling each fossil by reconstructors. We do not have enough data to verify whether our method could be successfully applied to other types of fish microfossils. The universality of the DL-based method should be tested in follow-up studies.
However, our contribution is a well-established method for semantically segmenting vertebrate microfossils, specifically fish microfossils. Our goal at this research stage is to obtain more CT data on fish microfossils to expand our dataset. We have a professional labeling team that can provide high-quality data. Our proposed method is relatively successful and promising. Currently, for four types of fish microfossils, we have obtained nearly 500 specimens, which represent an abundance of samples. There is no other publicly available CT dataset of fish microfossils that is comparable in size, let alone containing expert-labeled images. We believe that our work may be helpful in the processing of CT data from fish microfossils and even data from other microfossils. The fully labeled CT dataset and DL-based semantic segmentation method that we will make public in a publicly accessible repository (ADMorph) at http://admorph.ivpp.ac.cn/ (last access: 20 June 2020) can potentially provide research support to other paleontologists and experts in the field of computer sciences.
In summary, we have provided a labeled CT dataset and proposed a baseline for a DL-based method of semantically segmenting vertebrate microfossils in CT data. Our preliminary study by means of extensive experiments on nearly 500 fish microfossils shows that the intersection over union (IoU) performance metric arrived at least 94.39 %, meeting the semantic segmentation requirements of paleontologists. Along with improving our existing hardware and framework structure, our future work aims to increase the types of fossils in our dataset. Further network training could lead to the automatic segmentation of more types of microfossils and add to the knowledge of the distribution of vertebrate microfossils in the strata.
The images and the original material used and published here are stored at the Institute of Vertebrate Paleontology and Paleoanthropology, Chinese Academy of Sciences, Beijing, China.
YH performed the experiments, acquired CT data for the datasets, and was the primary author of the paper. MCK performed the experiments and edited the paper. XC acquired and labeled the data for the datasets and edited the paper. RHB edited the paper. MZ organized the project and also wrote the publication.
The contact author has declared that neither they nor their co-authors have any competing interests.
Publisher's note: Copernicus Publications remains neutral with regard to jurisdictional claims in published maps and institutional affiliations.
The authors would like to thank Liping Dong and Zhikun Gai for discussions and Liantao Jia, Pengfei Yin, Qiang Li, and Penghe Wang for specimen preparation and data collection. We thank Vincent Fernandez and an anonymous reviewer for their constructive suggestions. This paper was edited by Emanuela Mattioli, who provided additional insights and comments that improved the paper.
This research has been supported by the Chinese Academy of Sciences (grant nos. XDA19050102, XDB26000000, and QYZDJ-SSW-DQC002) and the National Natural Science Foundation of China (grant no. 42130209).
This paper was edited by Emanuela Mattioli and reviewed by two anonymous referees.
Adams, R. and Bischof, L.: Seeded region growing, IEEE Trans. Pattern Anal. Mach. Intell., 16, 641–647, https://doi.org/10.1109/34.295913, 1994.
Andreev, P., Coates, M. I., Karatajute-Talimaa, V., Shelton, R. M., Cooper, P. R., Wang, N., and Sansom, I. J.: The systematics of the Mongolepidida (Chondrichthyes) and the Ordovician origins of the clade, PeerJ, 4, e1850, https://doi.org/10.7717/peerj.1850, 2016.
Bhardwaj, S. and Mittal, A.: A survey on various edge detector techniques, Proc. Technol., 4, 220–226, https://doi.org/10.1016/j.protcy.2012.05.033, 2012.
Botella, H., Blom, H., Dorka, M., Ahlberg, P. E., and Janvier, P.: Jaws and teeth of the earliest bony fishes, Nature, 448, 583–586, https://doi.org/10.1038/nature05989, 2007.
Bourel, B., Marchant, R., de Garidel-Thoron, T., Tetard, M., Barboni, D., Gally, Y., and Beaufort, L.: Automated recognition by multiple convolutional neural networks of modern, fossil, intact and damaged pollen grains, Comput. Geosci., 140, 104498, https://doi.org/10.1016/j.cageo.2020.104498, 2020.
Buser, T. J., Boyd, O. F., Cortés, Á., Donatelli, C. M., Kolmann, M. A., Luparell, J. L., Pfeiffenberger, J. A., Sidlauskas, B. L., and Summers, A. P.: The natural historian's guide to the CT galaxy: step-by-step instructions for preparing and analyzing computed tomographic (CT) data using cross-platform, open access software, Integr. Org. Biol., 2, obaa009, https://doi.org/10.1093/iob/obaa009, 2020.
Carvalho, L., Fauth, G., Fauth, S. B., Krahl, G., Moreira, A., Fernandes, C., and Von Wangenheim, A.: Automated microfossil identification and segmentation using a deep learning approach, Mar. Micropaleontol., 158, 101890, https://doi.org/10.1016/j.marmicro.2020.101890, 2020.
Chen, D., Blom, H., Sanchez, S., Tafforeau, P., and Ahlberg, P. E.: The stem osteichthyan Andreolepis and the origin of tooth replacement, Nature, 539, 237–241, https://doi.org/10.1038/nature19812, 2016.
Chollet, F.: Keras, available at: https://keras.io, last access: 27 March 2015.
Cui, X., Li, Q., Qiao, T., and Zhu, M.: New material of thelodonts from Lochkovian (Lower Devonian) of Qujing, Yunnan, China, Vert. PalAsiat., 58, 1–15, https://doi.org/10.19615/j.cnki.1000-3118.190612, 2020.
Cui, X., Qu, Q., Andreev, P. S., Li, Q., Mai, H., and Zhu, M.: Modeling scale morphogenesis in a Devonian chondrichthyan and scale growth patterns in crown gnathostomes, J. Vert. Paleont., 41, e1930018, https://doi.org/10.1080/02724634.2021.1930018, 2021.
Cunningham, J. A., Rahman, I. A., and Lautenschlager, S. E. A.: A virtual world of paleontology, Trends. Ecol. Evol., 29, 347–357, https://doi.org/10.1016/j.tree.2014.04.004, 2014.
Fernandez, V., Buffetaut, E., Maire, E., Adrien, J., Suteethorn, V., and Tafforeau, P.: Phase contrast synchrotron microtomography: improving noninvasive investigations of fossil embryos in ovo, Microsc. Microanal., 18, 179–185, https://doi.org/10.1017/S1431927611012426, 2012.
Fernandez, V., Abdala, F., Carlson, K. J., Cook, D. C., Rubidge, B. S., Yates, A., and Tafforeau, P.: Synchrotron reveals Early Triassic odd couple: injured amphibian and aestivating therapsid share burrow, PLoS One, 8, e64978, https://doi.org/10.1371/journal.pone.0064978, 2013.
Fernandez, V., Buffetaut, E., Suteethorn, V., Rage, J.-C., Tafforeau, P., and Kundrát, M.: Evidence of egg diversity in squamate evolution from Cretaceous anguimorph embryos, PLoS One, 10, e0128610, https://doi.org/10.1371/journal.pone.0128610, 2015.
Funkhouser, J. W. and Evitt, W. R.: Preparation techniques for acid-insoluble microfossils, Micropaleontology, 5, 369–375, https://doi.org/10.2307/1484431, 1959.
Ge, Q., Richmond, T., Zhong, B., Marchitto, T. M., and Lobaton, E.: Enhancing the morphological segmentation of microscopic fossils through Localized Topology-Aware Edge Detection, Auton. Robots, 45, 709–723, https://doi.org/10.1007/s10514-020-09950-9, 2020.
Goh, T. Y., Basah, S. N., Yazid, H., Safar, M. J. A., and Saad, F. S. A.: Performance analysis of image thresholding: Otsu technique, Measurement, 114, 298–307, https://doi.org/10.1016/j.measurement.2017.09.052, 2018.
Hackley, P. C., Walters, C. C., Kelemen, S. R., Mastalerz, M., and Lowers, H. A.: Organic petrology and micro-spectroscopy of Tasmanites microfossils: applications to kerogen transformations in the early oil window, Org. Geochem., 114, 23–44, https://doi.org/10.1016/j.orggeochem.2017.09.002, 2017.
He, K., Zhang, X., Ren, S., and Sun, J.: Deep residual learning for image recognition, in: IEEE Conference on Computer Vision and Pattern Recognition (CVPR), Las Vegas, NV, 27–30 June 2016, 770–778, https://doi.org/10.1109/CVPR.2016.90, 2016.
Hou, Y., Cui, X., Canul-Ku, M., Jin, S., Hasimoto-Beltran, R., Guo, Q., and Zhu, M.: ADMorph: a 3D digital microfossil morphology dataset for deep learning, IEEE Access, 8, 148744–148756, 2020.
Janvier, P.: Early Vertebrates, Oxford Univ. Press, New York, 173–186, 1996.
Jin, S., Su, Y., Gao, S., Wu, F., Hu, T., Liu, J., Li, W., Wang, D., Chen, S., and Jiang, Y.: Deep learning: individual maize segmentation from terrestrial lidar data using faster R-CNN and regional growth algorithms, Front. Plant Sci., 9, 866–875, https://doi.org/10.3389/fpls.2018.00866, 2018.
Khan, M. J., Yousaf, A., Javed, N., Nadeem, S., and Khurshid, K.: Automatic target detection in satellite images using deep learning, J. Sp. Technol., 7, 44–49, 2017.
Kingma, D. P. and Ba, J.: Adam: A method for stochastic optimization, arXiv [preprint], arXiv:1412.6980, available at: https://arxiv.org/abs/1412.6980 (last access: 30 January 2017), 2014.
Lautenschlager, S.: Reconstructing the past: methods and techniques for the digital restoration of fossils, R. Soc. Open Sci., 3, 160342, https://doi.org/10.1098/rsos.160342, 2016.
LeCun, Y., Bengio, Y., and Hinton, G.: Deep learning, Nature, 521, 436–444, https://doi.org/10.1038/nature14539, 2015.
Li, Q., Cui, X., Andreev, P. S., Zhao, W., Wang, J., Peng, L., and Zhu, M.: Nostolepis scale remains (stem Chondrichthyes) from the Lower Devonian of Qujing, Yunnan, China, PeerJ, 9, e11093, https://doi.org/10.7717/peerj.11093, 2021.
Lin, T., Dollár, P., Girshick, R., He, K., Hariharan, B., and Belongie, S.: Feature pyramid networks for object detection, in: IEEE Conference on Computer Vision and Pattern Recognition (CVPR), Honolulu, HI, 21–26 July 2017, 936–944, https://doi.org/10.1109/CVPR.2017.106, 2017.
Marchant, R., Tetard, M., Pratiwi, A., Adebayo, M., and de Garidel-Thoron, T.: Automated analysis of foraminifera fossil records by image classification using a convolutional neural network, J. Micropalaeontol., 39, 183–202, https://doi.org/10.5194/jm-39-183-2020, 2020.
Märss, T., Fredholm, D., Karatajute-Talimaa, V., Turner, S., Jeppsson, L., and Nowlan, G.: Silurian vertebrate biozonal scheme, Geobios, 19, 369–372, https://doi.org/10.1016/S0016-6995(95)80140-5, 1995.
Martín-Perea, D. M., Courtenay, L. A., Domingo, M. S., and Morales, J.: Application of artificially intelligent systems for the identification of discrete fossiliferous levels, PeerJ, 8, e8767, https://doi.org/10.7717/peerj.8767, 2020.
Ni, X., Flynn, J. J., and Wyss, A. R.: Imaging the inner ear in fossil mammals: high-resolution CT scanning and 3-D virtual reconstructions, Palaeontol. Electronica., 15, 1–10, https://doi.org/10.26879/288, 2012.
Nosrati, M. S. and Hamarneh, G.: Incorporating prior knowledge in medical image segmentation: a survey, arXiv [preprint], arXiv:1607.01092, available at: https://arxiv.org/abs/1607.01092, last access: 5 July 2016.
Ogg, J. G., Ogg, G. M., and Gradstein, F. M.: A concise geologic time scale 2016, Elsevier, Amsterdam, the Netherlands, 2016.
Omer, A. A., Hassan, O. I., Ahmed, A. I., and Abdelrahman, A.: Denoising CT images using median based filters: a review, in: International Conference on Computer, Control, Electrical, and Electronics Engineering (ICCCEEE), Sudan, 12–14 August 2018, 1–6, https://doi.org/10.1109/ICCCEEE.2018.8515829, 2018.
Otsu, N.: A threshold selection method from gray-level histograms, IEEE Trans. Sys. Man. Cyber., 9, 62–66, https://doi.org/10.1109/TSMC.1979.4310076, 1979.
Pérez-Ramos, A. and Figueirido, B.: Toward an “ancient” virtual world: improvement methods on X-ray CT data processing and virtual reconstruction of fossil skulls, Front. Earth Sci., 8, 345–367, https://doi.org/10.3389/feart.2020.00345, 2020.
Qu, Q., Sanchez, S., Zhu, M., Blom, H., and Ahlberg, P. E.: The origin of novel features by changes in developmental mechanisms: ontogeny and three-dimensional microanatomy of polyodontode scales of two early osteichthyans, Biol. Rev., 92, 1189–1212, https://doi.org/10.1111/brv.12277, 2017.
Racicot, R.: Fossil secrets revealed: X-ray CT scanning and applications in paleontology, Paleontol. Soc. Pap., 22, 21–38, https://doi.org/10.1017/scs.2017.6, 2017.
Rehn, E., Rehn, A., and Possemiers, A.: Fossil charcoal particle identification and classification by two convolutional neural networks, Quaternary Sci. Rev., 226, 106038, https://doi.org/10.1016/j.quascirev.2019.106038, 2019.
Roerdink, J. B. and Meijster, A.: The watershed transform: Definitions, algorithms and parallelization strategies, Fund. Inform., 41, 187–228, https://doi.org/10.3233/FI-2000-411207, 2000.
Ronneberger, O., Fischer, P., and Brox, T.: U-net: convolutional networks for biomedical image segmentation, in: Medical Image Computing and Computer-Assisted Intervention (MICCAI), Munich, 5–9 October 2015, 234–241, https://doi.org/10.1007/978-3-319-24574-4_28, 2015.
Sagheer, S. V. M. and George, S. N.: A review on medical image denoising algorithms, Biomed. Signal Process. Control, 61, 102036, https://doi.org/10.1016/j.bspc.2020.102036, 2020.
Sahoo, P. K., Soltani, S., and Wong, A. K.: A survey of thresholding techniques, Comput. Vis. Graph. Image Process., 41, 233–260, https://doi.org/10.1016/0734-189X(88)90022-9, 1988.
Serra, J. and Vincent, L.: An overview of morphological filtering, Circuits Syst. Signal Process., 11, 47–108, https://doi.org/10.1007/BF01189221, 1992.
Sutton, M., Rahman, I., and Garwood, R.: Virtual paleontology-an overview, Paleontol. Soc. Pap., 22, 1–20, https://doi.org/10.1017/scs.2017.5, 2017.
Sutton, M. D.: Tomographic techniques for the study of exceptionally preserved fossils, Proc. Biol. Sci., 275, 1587–1593, https://doi.org/10.1098/rspb.2008.0263, 2008.
Tetard, M., Marchant, R., Cortese, G., Gally, Y., de Garidel-Thoron, T., and Beaufort, L.: Technical note: a new automated radiolarian image acquisition, stacking, processing, segmentation and identification workflow, Clim. Past, 16, 2415–2429, https://doi.org/10.5194/cp-16-2415-2020, 2020.
Tian, C., Fei, L., Zheng, W., Xu, Y., Zuo, W., and Lin, C.: Deep learning on image denoising: An overview, Neural Netw., 131, 251–275, https://doi.org/10.1016/j.neunet.2020.07.025, 2020.
Wang, N.: Thelodont, acanthodian, and chondrichthyan fossils from the Lower Devonian of southwestern China, Proc. Linn. Soc. N. S. W., 107, 419–441, 1984.
Wang, N.: 20 years of the studies of palaeozoic vertebrate microfossils from China, J. Stratigr., 30, 1–10, https://doi.org/10.1007/s11442-006-0415-5, 2006.
Wang, Y., Wei, C., Que, J., Zhang, W., Sun, C., Shu, Y., Hou, Y., Zhang, J., Shi, R., and Wei, L.: Development and applications of paleontological computed tomography, Vert. PalAsiat., 57, 84–92, https://doi.org/10.19615/j.cnki.1000-3118.170921, 2019.
Wu, Z., Shen, C., and Van Den Hengel, A.: Wider or deeper: revisiting the ResNet model for visual recognition, Pattern. Recognit., 90, 119–133, https://doi.org/10.1016/j.patcog.2019.01.006, 2019.
Xu, S., Zhang, S., Zeng, J., Li, T., Guo, Q., and Jin, S.: A framework for land use scenes classification based on landscape photos, IEEE J. Sel. Top. Appl. Earth Obs. Remote Sens., 13, 6124–6141, 2020.
Zhao, W. and Zhu, M.: A review of the Silurian fishes from China, with comments on the correlation of fish-bearing strata, Earth Sci. Front., 21, 185–202, https://doi.org/10.13745/j.esf.2014.02.014, 2014.
Zhao, W., Zhu, M., Gai, Z., Pan, Z., Cui, X., and Cai, J.: A review of Silurian fishes from north-western Hunan, China and related biostratigraphy, Acta Geol. Pol., 68, 475–486, 2018.
Zhao, W., Zhang, X., Jia, G., Shen, Y., and Zhu, M.: The Silurian-Devonian boundary in East Yunnan (South China) and the minimum constraint for the lungfish-tetrapod split, Sci. China Earth Sci., 64, 1–14, https://doi.org/10.1007/s11430-020-9794-8, 2021.
Žigaitė, Živilė, Karatajūtė-Talimaa, V., and Blieck, A.: Vertebrate microremains from the Lower Silurian of Siberia and Central Asia: palaeobiodiversity and palaeobiogeography, J. Micropalaeontol., 30, 97–106, https://doi.org/10.1144/0262-821X11-016, 2011.
Ziou, D. and Tabbone, S.: Edge detection techniques-an overview, Pattern Recognit. Image Anal., 8, 537–559, 1998.