the Creative Commons Attribution 4.0 License.
the Creative Commons Attribution 4.0 License.
 | 18 Nov 2025
Paleoproductivity and coccolith carbonate export in the northern Bay of Bengal during the late Pleistocene
Luc Beaufort
Franck Bassinot
Katarína Holcová
The Bay of Bengal (BoB) is a unique oceanographic and sedimentary environment because of the influence of the South Asian monsoon, which causes seasonal reversals of wind-driven ocean circulation and results in massive inputs of freshwater and sediment into the northern margins. Monsoon dynamics also control primary productivity in the Bay of Bengal, causing nutrient inputs that stimulate productivity when wind-driven or eddy mixing is intense but also limiting oceanic productivity when salinity stratification resulting from runoff and precipitation is intense. In the modern Bay of Bengal, coccolithophores (calcifying unicellular phytoplankton) are an important component of primary productivity, in particular in the deep photic zone, and are a key contributor to organic and inorganic carbon export. Here, we present a revised age model and new high-resolution (mean 1200 years) calcareous nannofossil records from core MD12-3412 in the central northern Bay of Bengal, drilled in the Bengal Fan (18° N, 89° E; 2368 m water depth), spanning the last 279 000 years. We document significant orbital timescale variations in total coccolith accumulation rates (ARs) and coccolith carbonate mass accumulation rates (MARs), suggesting a strong influence of monsoon dynamics on coccolithophore productivity on both glacial–interglacial and precessional timescales. We find that productivity (coccolith accumulation rates) maxima in the northern Bay of Bengal generally coincide with South Asian monsoon minima as inferred from other independent proxies. This pattern is opposite to that observed in the southern Bay of Bengal and likely results from a weakening of salinity stratification in the north during periods of weaker monsoon, allowing entrainment of nutrients into the mixed layer fueling coccolithophore productivity. The abundance of Florisphaera profunda coccoliths, a species typically inhabiting the deep photic zone in the tropical ocean, is high in core MD12-3412 sediments (mean 80 % of total coccoliths and > 60 % of coccolith mass accumulation rates, cMARs), suggesting an important role of deep photic zone productivity in carbon and carbonate export. Significant precession-scale variance in F. profunda accumulation rates is resolved; however, peaks in this species' accumulation rates are in phase with maximum accumulation rates of Noelaerhabdaceae coccoliths (the dominant upper-photic-zone group), and no clear variations in the relative percent of F. profunda are observed. This suggests that percent F. profunda cannot be universally applied as a paleoproductivity proxy in the Bay of Bengal.
- Article
(9036 KB) - Full-text XML
-
Supplement
(760 KB) - BibTeX
- EndNote


Coccolithophores are single-celled phytoplankton that produce calcium carbonate scales, called coccoliths, which cover their cell surface (Young, 1998). Coccoliths are significant contributors to deep-sea sediments (Giraudeau and Beaufort, 2007). In tropical oceans, coccolithophores are major primary producers (Baumann et al., 2005), contributing up to 20 % of total carbon fixation even in oligotrophic open-ocean regions (Poulton et al., 2007) and between 1 % and 40 % of net primary productivity (Li et al., 2024). Organic carbon fixed by coccolithophores during photosynthesis, along with precipitated carbonate, is exported out of the euphotic zone via the biological carbon pumps, playing a crucial role in marine carbon cycling. Coccolithophores are sensitive to upper-ocean physicochemical parameters, and the abundance, species composition, and geochemistry of their fossil remains, calcareous nannofossils, can be used to reconstruct paleoceanographic conditions (Bolton et al., 2013; Bolton and Stoll, 2025; Flores et al., 2014; Lee et al., 2020; Sett et al., 2014).
In the modern Bay of Bengal (BoB), oceanography, climate, and sediment delivery are strongly influenced by the seasonally reversing South Asian, or Indian, monsoon. Maximum freshwater inputs (precipitation plus runoff) to the BoB occur during the Indian summer monsoon (ISM; from May to September), inducing a northeast–southwest salinity gradient and strong stratification that persist year-round in the northern part of the BoB (Fig. 1). Freshwater input into the BoB significantly impacts surface water circulation (Schott and McCreary, 2001) and vertical water column structure, with a shallower mixed layer during the summer months (Fig. 1a, b). The river systems draining into the BoB (Fig. 1), most notably the Ganges and Brahmaputra, also deliver vast quantities of sediment, contributing to the Bengal Fan sedimentary system (Curray et al., 2002). Oceanic productivity and associated biogenic CaCO3 precipitation in the BoB are also influenced by the seasonal cycle of the monsoon because of strong salinity stratification, wind-driven mixing entraining nutrients into the surface layer, and turbidity that accompanies freshwater inputs (Prasanna Kumar et al., 2002). One key characteristic of the northern Indian Ocean is the presence of two annual productivity peaks (Lévy et al., 2007; Longhurst, 2007). Primary productivity across the BoB is highly heterogeneous, with some regions displaying maximum productivity during the summer monsoon and some during the winter monsoon (Koné et al., 2009). In water samples taken from several depths (between 0 and 90 m) over spring to winter in the northern and western BoB, complex controls on productivity were observed, including light limitation due to cloud cover (in summer), nutrient input from runoff (in winter), and nutrient enrichment from eddies and coastal currents (in spring) (Gomes et al., 2000). The importance of physical processes, such as halocline erosion and Ekman-driven nutrient influx, in sustaining phytoplankton blooms in offshore regions of the BoB is also demonstrated in modeling studies (Vinayachandran et al., 2005). In addition, cyclones and eddies can trigger phytoplankton blooms in the BoB (e.g., Kuttippurath et al., 2021), and interannual climate phenomena, such as the El Niño–Southern Oscillation and the Indian Ocean Dipole (Currie et al., 2013), also have the potential to affect productivity patterns in the BoB.
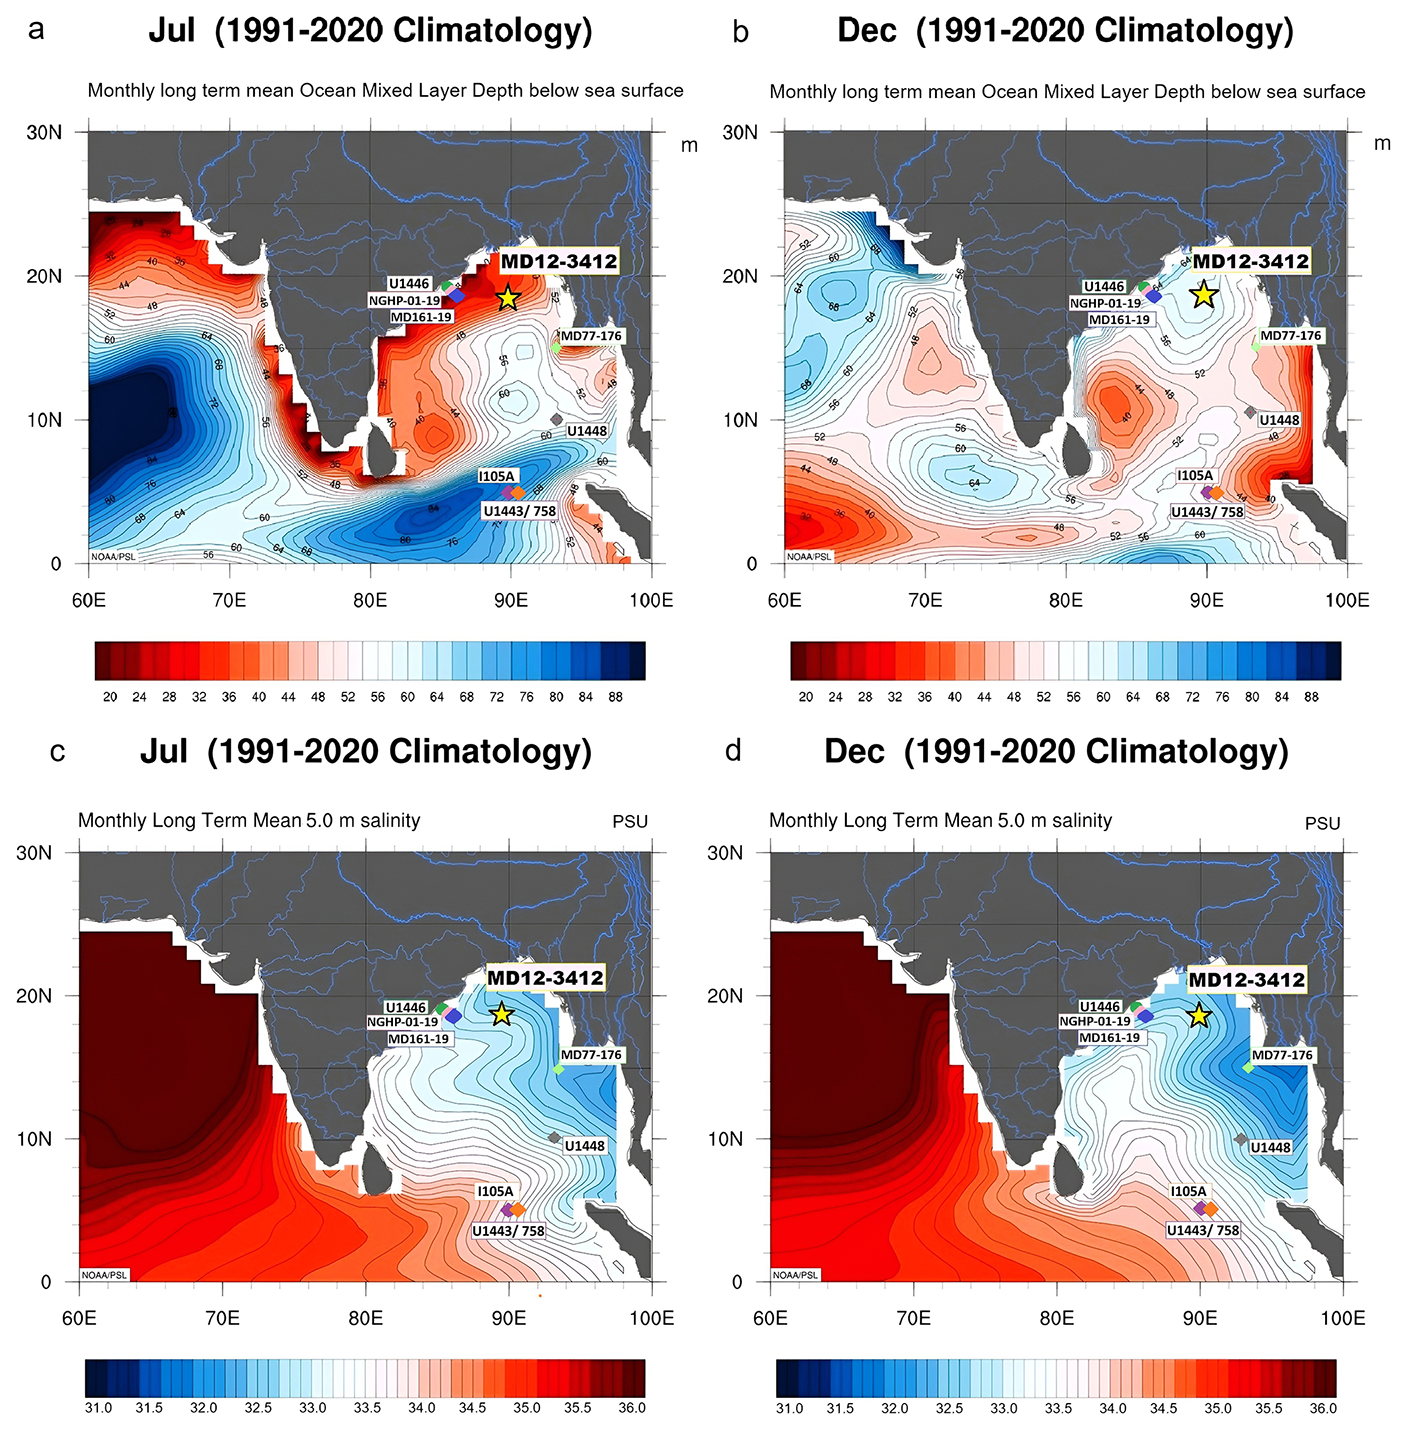
Figure 1Location of core MD12-3412 in the northern BoB (yellow star) and differences in summer (July) vs. winter (December) oceanographic conditions. Monthly mean (1991–2020) ocean mixed-layer depth (meters) in July (a) and December (b); monthly mean salinity (1991–2020) at 5 m depth in July (c) and December (d). Maps were created using GODAS data from the NOAA Physical Sciences Laboratory (https://psl.noaa.gov/, last access: June 2025). The locations of all BoB cores discussed in the paper are also shown.
The BoB shows relatively high downward fluxes of total particulates and high organic carbon export efficiency, despite having generally lower plankton biomass, biogenic export fluxes, and chlorophyll a concentrations than the neighboring Arabian Sea. This is attributed to the ballasting of biogenic particles by riverine terrigenous material in the BoB and to different phytoplankton community dynamics (Gauns et al., 2005; Ramaswamy and Gaye, 2006; Rixen et al., 2019; Stoll et al., 2007). Northern BoB sediment trap data show highly seasonal coccolith fluxes, with maximum fluxes during July to September (Stoll et al., 2007) or in spring and late autumn (Mergulhao et al., 2013; Ramaswamy and Gaye, 2006). In these sediment traps, coccolith assemblages were strongly dominated (up to 90 %) by F. profunda, a species that thrives in the low-light, high-nutrient environment of the deep photic zone (DPZ). In addition, peak organic carbon export preceded coccolith and foraminiferal upwelling indicators in northern BoB traps, suggesting that deep photic zone (DPZ) production by low-light-adapted taxa like F. profunda is the primary driver of carbon fluxes, rather than upper-photic-zone species (Stoll et al., 2007). Calcareous nannofossil assemblages in surface sediment samples from the northern and western BoB show notable regional differences, with northern sites showing lower-productivity assemblages and western sites displaying higher species diversity and a dominance of species indicative of higher productivity (i.e., Gephyrocapsa oceanica and Emiliania huxleyi) (Uddandam et al., 2015).
During the Pleistocene, existing downcore studies from the BoB, mainly from the runoff-influenced coastal northwestern part of the bay (Mahanadi Basin), generally suggest that paleoproductivity was higher during cooler periods, linked to Indian monsoon variability. For example, the higher total CaCO3 mass accumulation rate (MAR) in core NGHP-01-19 from the northwestern BoB (Fig. 1) during the last glacial was interpreted to indicate higher productivity due to reduced stratification and increased nutrient availability during weaker ISM conditions (Phillips et al., 2014). This productivity response to ISM forcing is opposite to that reconstructed in the Arabian Sea, where a weaker monsoon during cooler periods results in less upwelling and lower productivity (Singh et al., 2011). In core MD161-19, also from the northwestern BoB (Fig. 1), large variations in total CaCO3 and total organic carbon accumulation rate (AR) over the past 300 000 years (kyr) on millennial and marine isotope substage timescales were documented, with colder stadial periods showing enhanced productivity interpreted to reflect reduced salinity stratification due to a weaker monsoon, although a clear glacial–interglacial pattern was not evident (Da Silva et al., 2017). However, a recent high-resolution study based on planktic foraminiferal geochemistry and abundances from a nearby northwestern BoB core concluded that the ISM has exhibited extreme variability since the Last Glacial Maximum, with productivity declines occurring during both strong (early Holocene) and weak (Heinrich Stadial 1) monsoon states as a result of upper-ocean stratification and its impact on nutrient availability (Thirumalai et al., 2025). These patterns are broadly coherent with a synthesis of BoB records spanning the last 30 kyr from across the BoB, highlighting ISM strengthening during interglacials and weakening during Heinrich events, the Last Glacial Maximum, and the Younger Dryas (Haridas et al., 2022). However, it is unlikely that these productivity patterns can be extrapolated to the BoB as a whole.
One such late Pleistocene record is based on the relative abundance of F. profunda in core MD77-176 (northeastern BoB; Fig. 1) and also suggests that productivity was suppressed when runoff and salinity stratification was stronger during the Holocene (Zhou et al., 2020). In contrast, paleoproductivity may have been higher during warm interglacial periods with an enhanced ISM in the southern BoB due to stronger wind-driven mixing (Banerjee et al., 2024; Bolton et al., 2013) and in the Arabian Sea as a result of intensified upwelling (Palanisamy et al., 2024; Sijinkumar et al., 2021). However, a primary productivity record based on the percent of F. profunda from core I105A in the southern BoB (Fig. 1) instead suggests higher primary productivity in the last glacial (when the ISM was thought to be weaker) relative to the Holocene interglacial (Su et al., 2025), similar to the pattern seen in sites further north nearer the margins.
Aside from biostratigraphic studies (Bhaumik et al., 2024; Chakraborty et al., 2021; Flores et al., 2014; Robinson et al., 2016), very few studies have assessed late Pleistocene calcareous nannofossil assemblages and productivity dynamics in the BoB (Bolton et al., 2024; Su et al., 2025; Zhou et al., 2020), and none extend beyond the Last Glacial Maximum. To fill this knowledge gap and further understand coccolithophore productivity and the contribution of coccoliths to carbonate burial in the BoB over several recent glacial–interglacial cycles, we examine variations in calcareous nannofossil assemblages, Noelaerhabdaceae coccolith morphology (size and mass), and coccolith-specific CaCO3 MAR in samples from core MD12-3412, located in the central northern BoB, over the last 279 kyr at high resolution (mean 1.2 kyr).
2.1 Sediment core
Core MD12-3412 was collected during the MD191/MONOPOL expedition of the French R/V Marion Dufresne in 2012 at a water depth of 2368 m in the northeastern Bay of Bengal (18°18.62′ N, 89°34.26′ E; 32 m long) using a giant piston (Calypso) corer. Sediments of the Bengal Fan are deposited by turbidity current deposits via channel levee systems during active fan progradation and by hemipelagic sedimentation during periods of local fan inactivity, making it a mixed-sedimentation environment with both turbidite and hemipelagic deposits (Fauquembergue et al., 2019).
The lithology of core MD12-3412 was studied in detail by Fauquembergue et al. (2019) using grain size analyses, XRF elemental data, X-ray imaging, microscopy, and physical property data. These authors describe alternating intervals of fine-grained (clay, 4–15 µm grain size) hemipelagic sediments and 91 thin (1 cm scale) turbidite layers, identified by their sharp basal contacts, coarser grain size fining upwards, and elevated and ratios at their base (Fauquembergue et al., 2019). Analysis of turbidite frequency showed that periods of higher turbidite activity mainly occurred during the glacial periods MIS 6 and MIS 2–4, as illustrated by peaks in median grain size (Fauquembergue et al., 2019; Fig. 2b). Clay mineral assemblages and Sr–Nd isotopic compositions confirm a consistent sediment source from the Ganges–Brahmaputra system with a more minor contribution of sediments from the western part of the Indo–Burman Ranges, with higher contributions from the Indo–Burman Ranges during glacial stages (Joussain et al., 2016). Regardless of sediment source, smectite/(illite + chlorite) ratios suggest more detrital material from highland areas of river basins during glacial periods (Joussain et al., 2016).
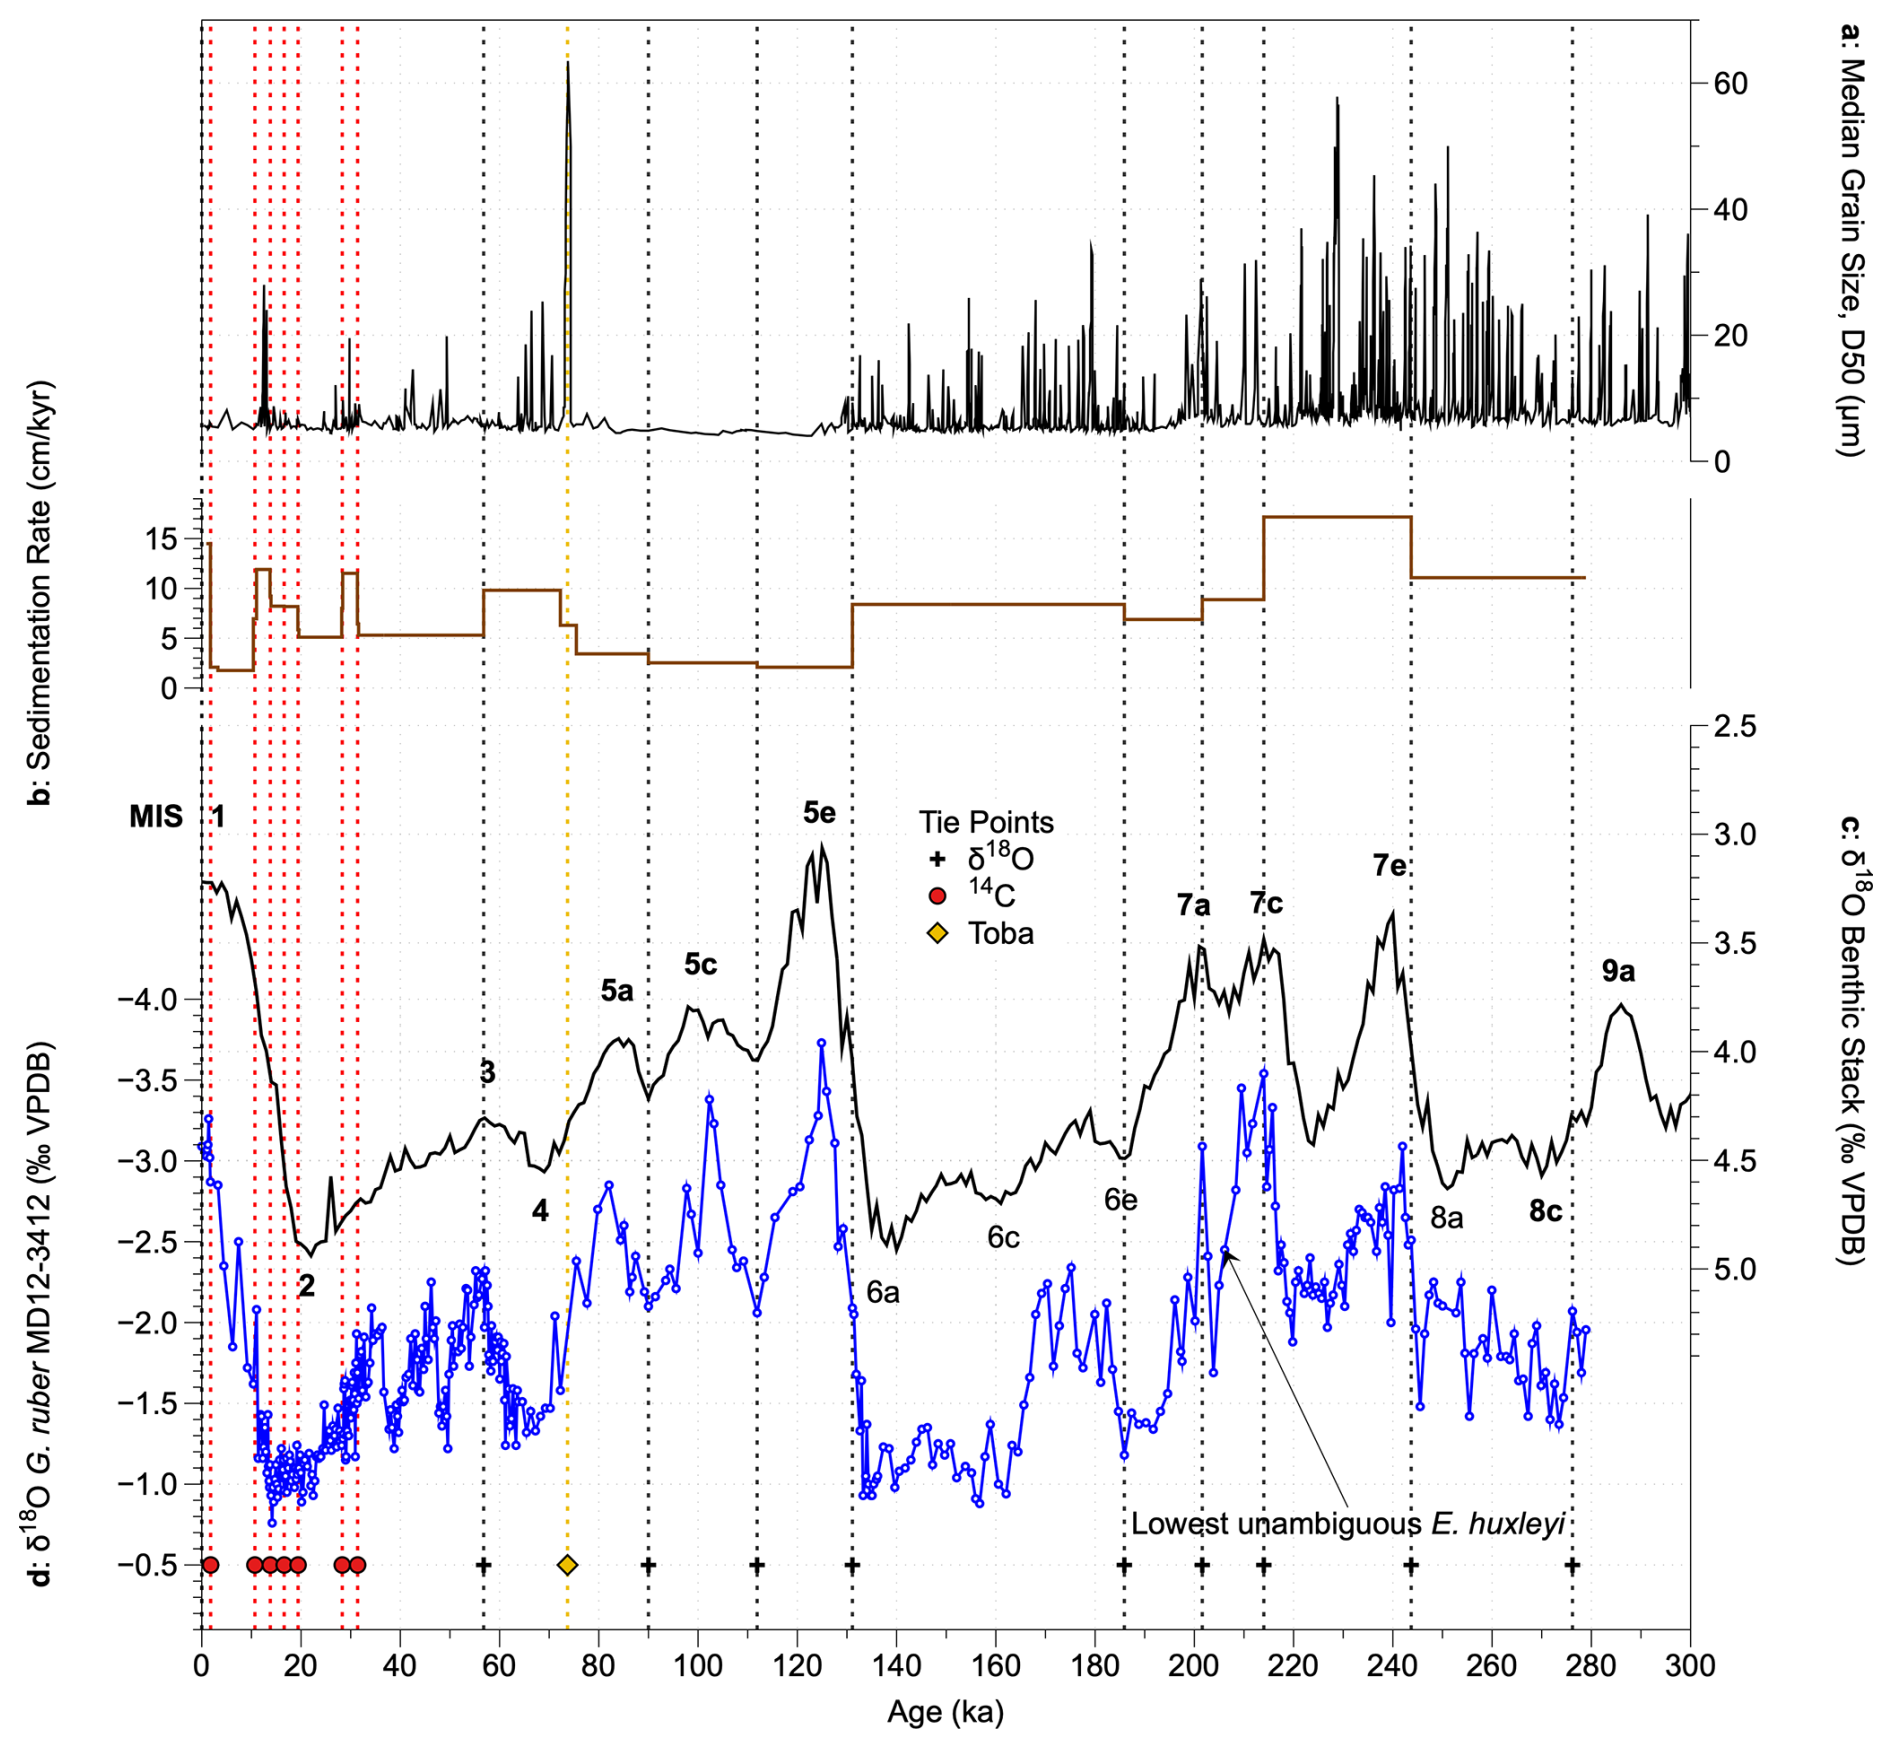
Figure 2Revised age model of core MD12-3412. (a) Median grain size, indicating the presence of turbidites (Fauquembergue et al., 2019); (b) sedimentation rate based on the new age model; (c) global benthic foraminiferal δ18O stack (Ahn et al., 2017) (black, tuning target); (d) MD12-3412 G. ruber δ18O record (Fauquembergue et al., 2019, and this study). Symbols and dashed vertical lines show tie points based on radiocarbon dates (red circles), the Toba ash layer (yellow diamond), and G. ruber δ18O tie points (black crosses). The deepest sample in which E. huxleyi was unambiguously identified is noted; this may represent its first occurrence in the core, although coccoliths in older samples are highly diluted, so we cannot be certain of this.
2.2 Slide preparation and microscopy
A total of 232 samples were taken from the core (resulting in a mean time resolution of 1.2 kyr) and were prepared and analyzed for calcareous nannofossils at CEREGE, Aix-en-Provence. Coccolith samples were taken at 10 cm intervals in the core without discrimination between hemipelagic and turbidite layers. Microscope slides were prepared using a quantitative random settling technique modified from Beaufort et al. (2014), allowing absolute coccolith abundances to be calculated. Samples were weighed (∼ 5 mg), suspended in tap water, and briefly ultrasonicated to disaggregate. 1 mL of sample solution was then placed into decantation vessels, with pre-weighed (on a Mettler Toledo XP2U microbalance) glass coverslips (12×12 mm) positioned at the bottom. The samples were left undisturbed for 4 h, allowing all particles to settle onto the coverslips. Water was then gently removed using a pipette. Following this, samples were dried in the oven overnight at 50 °C. Dry coverslips were then weighed and mounted onto standard microscope slides using Norland Optical Adhesive No. 74.
Automated image acquisition was performed on a Leica DM6000 microscope, equipped with bidirectional circular polarization (Beaufort et al., 2021) and fitted with an automated XY stage holding two slides (16 samples), at 1000× magnification. In each sample, 150 fields of view (FoVs; area 125× 125 µm each) were imaged, with each image composed of a stack of seven images at 5 µm z intervals, using a Hamamatsu black and white digital camera (C11440). Nannofossil classes were identified using SYstème de Reconnaissance Automatique de COccolithes (SYRACO), an automated recognition system based on artificial neural networks (Beaufort and Dollfus, 2004; Dollfus and Beaufort, 1999). The software analyzes specimens across 33 morphological classes of coccolithophores. The underlying model architecture of SYRACO is continuously updated to enhance accuracy and processing speed. In this study, we employed a combination of ResNet50 and YOLOv8 architectures. SYRACO also enables detailed morphometric analysis of each identified coccolith, including measurements of length and mass (e.g., Beaufort et al., 2022).
To confirm our results based on the automated system, we also carried out traditional manual coccolith counts to determine the relative abundance of F. profunda on a subset of 10 samples spanning the study interval. For these 10 samples, two experienced micropaleontologists (Bolton and Beaufort) independently carried out counts. Random FoVs were counted at 1000× magnification on a Leica DMRBE microscope under circular-polarized light, until a total of at least 200 coccoliths or 20 FoVs were counted.
2.3 Coccolith abundances and accumulation rates
Coccolith absolute abundances (CAs; number of coccoliths per g of sediment) were calculated, both for total coccoliths and for the two main groups (F. profunda and Noelaerhabdaceae coccoliths), according to the equation
where A = the total area of the coverslip (mm2), N = the total number of coccoliths counted, f = the area of one field of view (mm2), n = the number of fields of view counted, and W = the weight of dry sediment on the coverslip (g).
Relative abundances of groups/species were also calculated, and 95 % confidence intervals were determined using multiple proportion confidence intervals, calculated with PAST software (version 4.03).
Total sediment mass accumulation rates (tMARs; g m−2 yr−1) were calculated as
where SR = sedimentation rate (cm kyr−1) and DBD = dry bulk density (g cm−3). DBD was calculated from wet bulk density (WBD) data measured on core MD12-2412 at 2 cm resolution using a multi-sensor core logger. For this calculation, we applied a linear regression between DBD and WBD, developed from discrete measurements at the nearby International Ocean Discovery Program (IODP) Site U1446, in the northwestern Bay of Bengal (Clemens et al., 2016).
Coccolith accumulation rates (ARs; number of coccoliths m−2 yr−1), both for total coccoliths and for specific groups (F. profunda and Noelaerhabdaceae coccoliths), were calculated using the equation
Coccolith mass accumulation rates (cMARs; g of coccolith calcite m−2 yr−1) were calculated using the equation
where cM is coccolith mass (total mass of coccolith CaCO3 per g of sediment).
We also calculated cMAR for F. profunda coccoliths and Noelaerhabdaceae coccoliths (NoMAR).
To obtain cM, we used the coccolith CaCO3 mass measured by SYRACO, calculated as
where total CaCO3 mass on coverslip = × area of total coverslip.
2.4 Spectral analyses
Spectral analyses (multi-taper method, robust AR(1) noise model) and phase and coherence analysis on coccolith AR and MAR records were performed using Acycle v2.8 (Li et al., 2019). The cAR and cMAR records were filtered to isolate significant variance in the precession band, using a Gaussian filter and a frequency range of 0.04–0.06 cycles kyr−1 (17–25 kyr), also in Acycle v2.8.
3.1 Age model
Following Fauquembergue et al. (2019), we applied a depth correction to Calypso core MD12-3412 based on the correlation of magnetic susceptibility measurements with those in a CASQ (9 m long gravity core) from the same location, to correct for any potential sediment thickness bias in the upper part of the Calypso core. An age model for the upper 13.46 m corrected depth of core MD12-3412 was published by Fauquembergue et al. (2019) based on seven radiocarbon dates, the identified Toba ash layer (dated at ∼ 73.7 ± 0.3 thousand years ago (ka); Mark et al., 2017), and tuning of a high-resolution Globigerinoides ruber oxygen isotope (δ18O) stratigraphy to the LR04 benthic foraminiferal δ18O stack (Lisiecki and Raymo, 2005).
Here, we propose a revised age model for the interval 0 to 22.35 m corrected depth of core MD12-3412, based on the same radiocarbon and Toba age–depth tie points as Fauquembergue et al. (2019) but with a different tuning of the G. ruber δ18O record and the inclusion of additional G. ruber δ18O data between 13.46 and 22.35 m corrected depth (80 new samples). For all G. ruber analyses from core MD12-3412, 15 tests of G. ruber (sensu stricto) were picked from the 250–315 µm size fraction. New and published isotopic analyses on G. ruber tests were conducted at the LSCE using an ISOPRIME mass spectrometer. Samples were calibrated to PDB values with a laboratory standard referenced to NBS19. The internal reproducibility, estimated from replicate analyses of the standard, was ±0.06 ‰ for δ18O (1σ). We first performed a tuning using imposed radiocarbon and Toba age–depth tie points using the “get age estimate” MATLAB code, which automatically tunes isotope records to the updated global benthic δ18O stack (Ahn et al., 2017). We then performed some manual adjustments, based on visual assessment and inferences based on expected sedimentation rates given the frequency and thickness of turbidites identified by Fauquembergue et al. (2019) and on the presence of coccolith biostratigraphic markers (Fig. 2).
The main difference between our revised age model and that of Fauquembergue et al. (2019) occurs below 12 m corrected depth, where we suggest that the minimum in G. ruber δ18O of −3.54‰ at 16.30 m corresponds to MIS 7c rather than MIS 7e (Figs. 2 and S1 in the Supplement; Table S1 in the Supplement). This tuning results in significantly higher sedimentation rates for MIS 7 than in the original age model, coherent with the high frequency of turbidites identified during this interval (Fig. 2a), with low coccolith abundances suggesting dilution (see Sect. 3.2), and with the stratigraphic position of the lowest confirmed occurrence of coccoliths belonging to the species E. huxleyi at 15.60 m (the first occurrence of this species is dated at 265–291 ka; Raffi et al., 2006). The end of the acme of Gephyrocapsa caribbeanica (dated at ∼ 300 ka; Beaufort et al., 2022, and references therein) near the core base (25.30 m) further supported a younger age for these sediments than previously suggested. Sedimentation rates are on average 10 cm kyr−1 and are in the range ∼ 2 cm kyr−1 (early Holocene, MIS 5a–e) to ∼ 17 cm kyr−1 (MIS 7d–e) (Fig. 2b). Our age model is supported by the median grain size record (Fig. 2a; Fauquembergue et al., 2019) that shows highest turbidite frequency during periods of highest estimated sedimentation rate. The original and revised age–depth models for core MD12-3412 are shown in Fig. S1.
3.2 Composition, preservation, and dilution of calcareous nannofossil assemblages
The calcareous nannofossil assemblage mainly consists of F. profunda, Noelaerhabdaceae (E. huxleyi, G. caribbeanica, Gephyrocapsa oceanica, Gephyrocapsa ericsonii, Gephyrocapsa muellerae), Umbilicosphaera spp., Syracosphaera pulchra, and Helicosphaera spp. In addition, Rhabdosphaera, Discosphaera, Pontosphaera, Calcidiscus, Ceratolithus, Calciosolenia, and Umbellosphaera were more rarely observed. However, these minor groups were not included in our dataset because of low numbers and because of the presence of false positives in these groups related to a high abundance of detrital carbonate in some intervals (i.e., detrital particles falsely identified as coccoliths).
Visual assessment of samples from throughout the study interval under the microscope indicated that samples from 17.35 to 22.35 m corrected depth (237.29 to 269.88 ka) were severely diluted by terrigenous particles and contained few coccoliths (Fig. 3c). On average, 4.3 × 10⁹ coccoliths per g of sediment were quantified between 0 to 17.35 m corrected depth, and 1.4 × 10⁹ coccoliths g−1 were quantified between 17.35 m and 22.35 m corrected depth (see Sect. 3.4 for details). This dilution effect was confirmed by manual counts of F. profunda relative abundance in 10 samples, including 5 from the 17.35 to 22.35 m interval (Fig. S2). Therefore, although data are included in all graphs, we do not consider relative abundance data reliable in this interval because of low total coccolith counts (the start of this interval is indicated with a dotted line in Figs. 4 and 5), and values from this interval are not included in average values stated below.
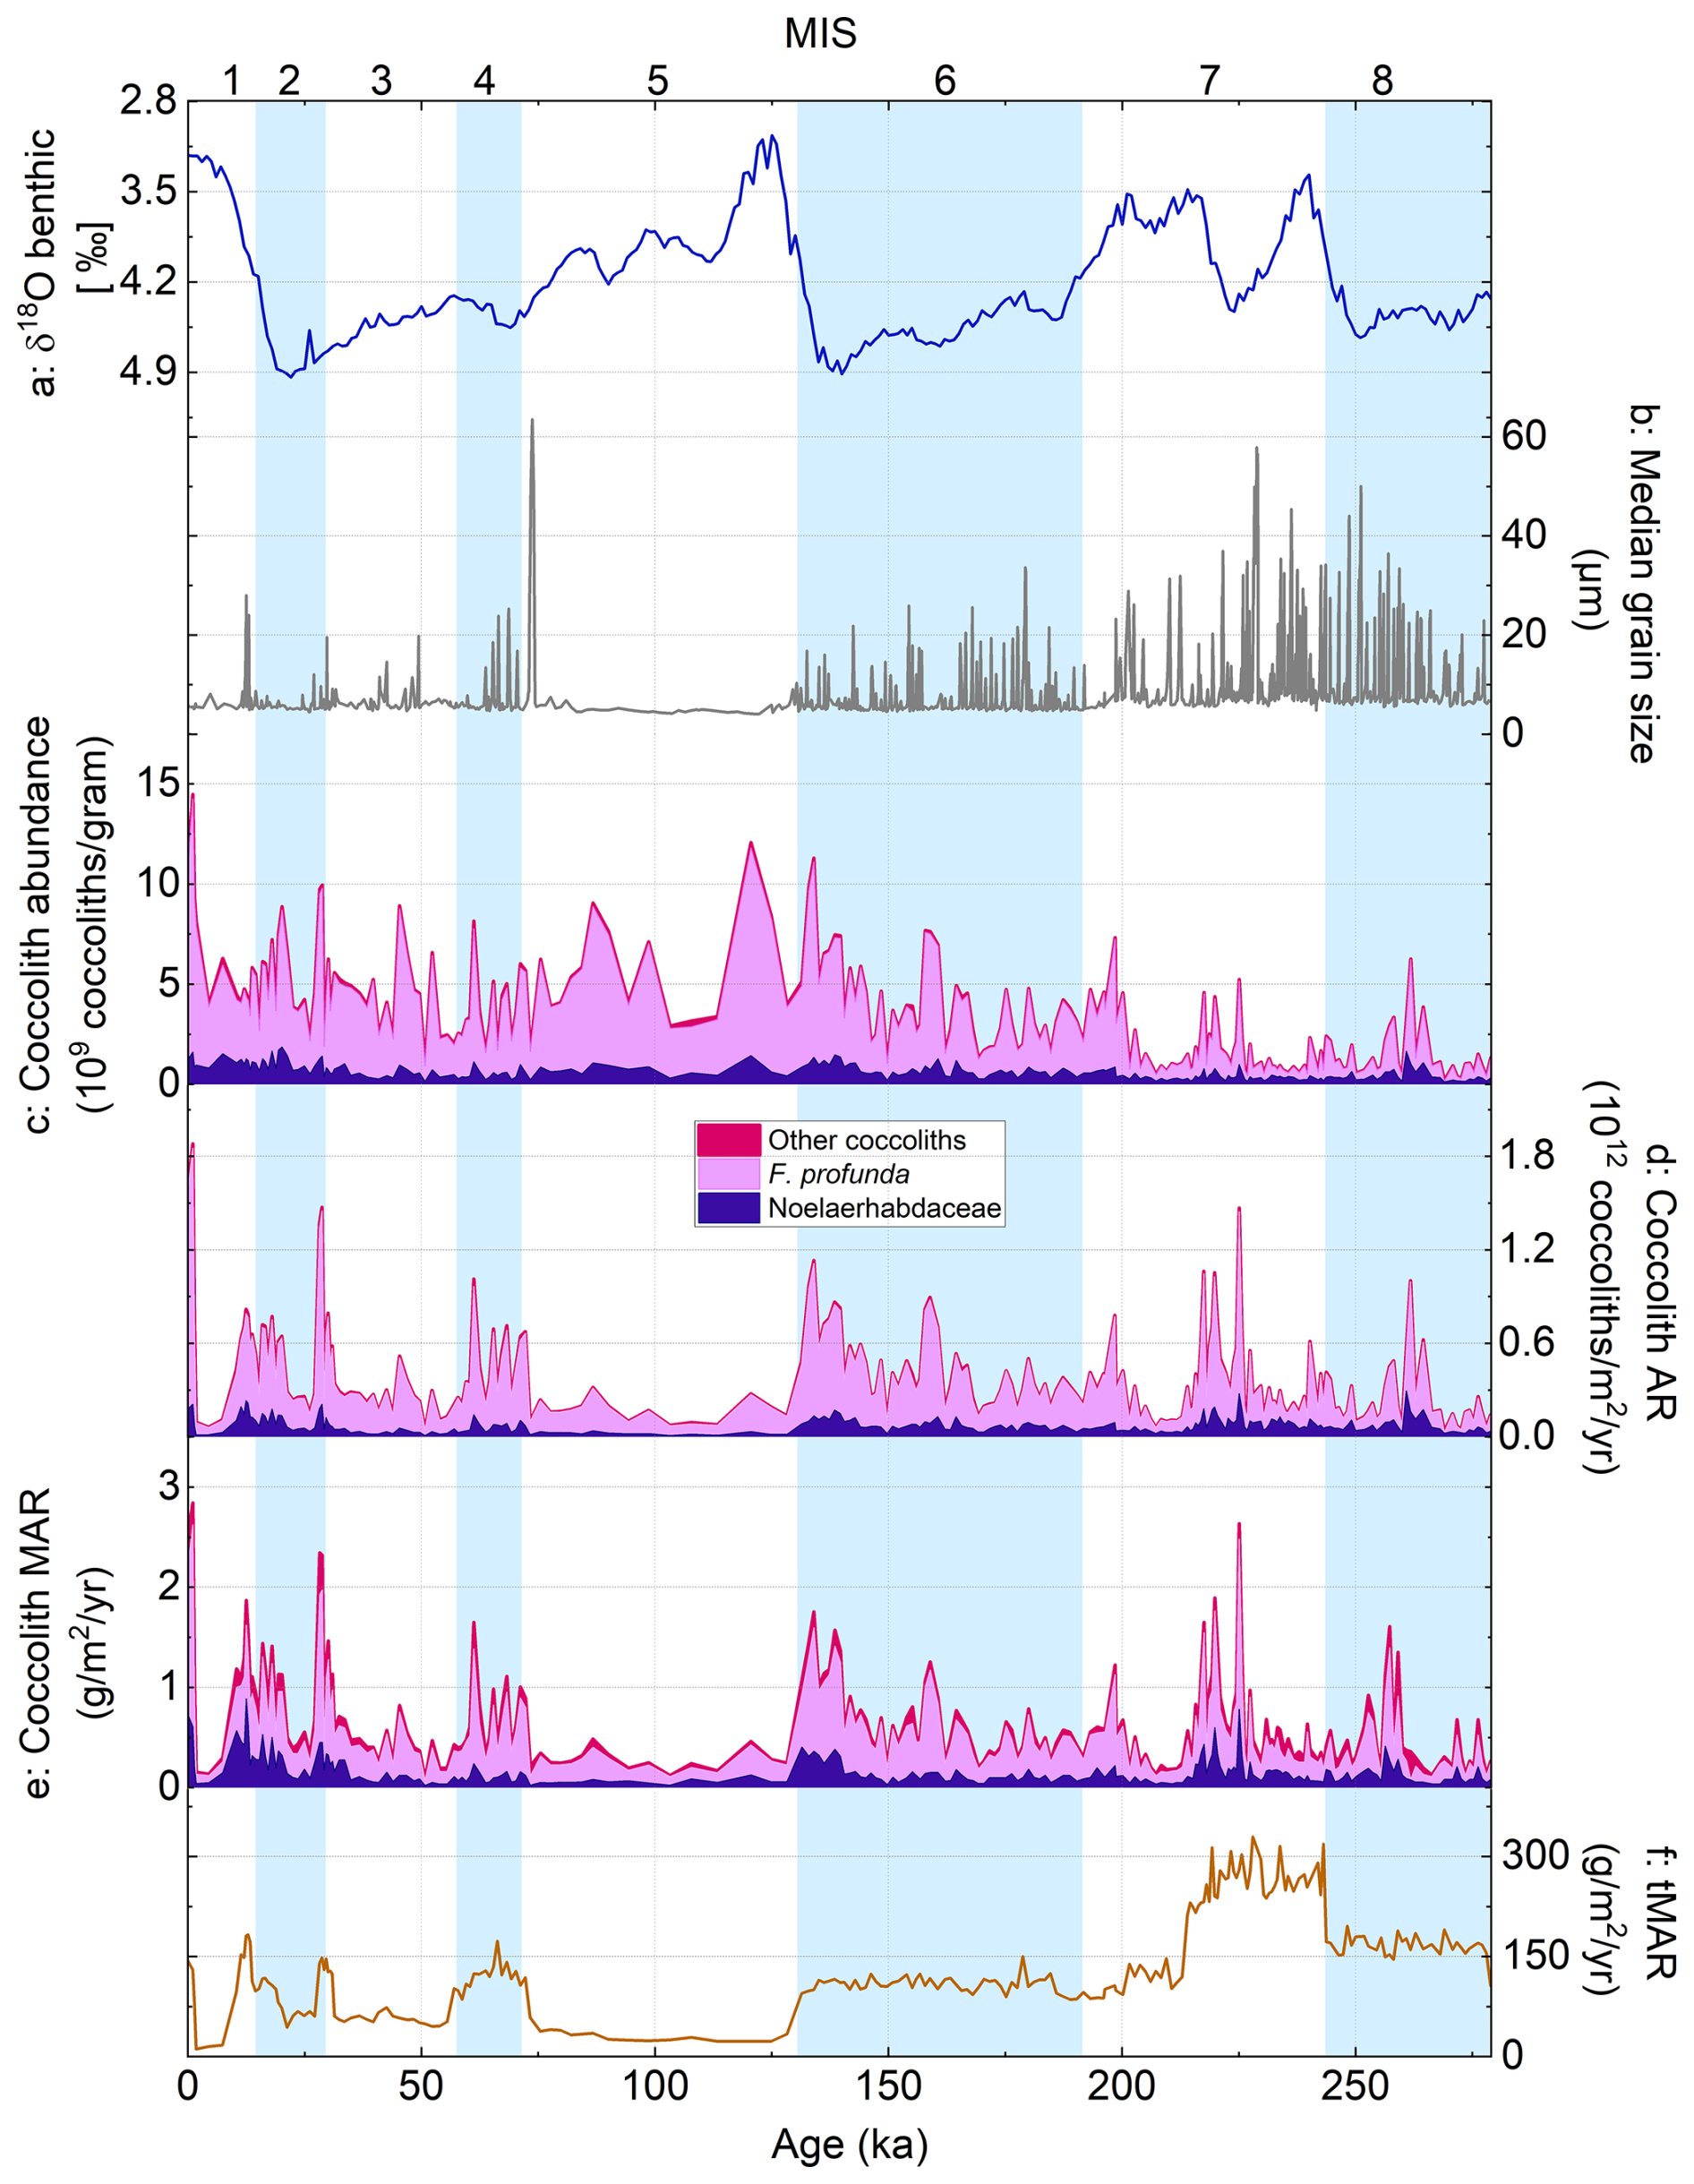
Figure 3Coccolith abundance, AR, and MAR records over the past 279 kyr from core MD12-3412: (a) global benthic foraminiferal δ18O stack (Ahn et al., 2017), (b) median grain size (Fauquembergue et al., 2019), (c) coccolith absolute abundance (CA), (d) coccolith accumulation rate (cAR), (e) coccolith mass accumulation rate (cMAR), and (f) total sediment mass accumulation rate (tMAR). Colors in panels (c)–(e) illustrate the relative contribution of Noelaerhabdaceae coccoliths (dark purple), F. profunda coccoliths (lilac), and all other coccoliths (pink). Glacial marine isotope stages (MISs) are shown as blue bands.
Calcareous nannofossil assemblages are well preserved throughout the record. This is attested to by the presence of delicate coccoliths with intact central area features, e.g., tiny (1–2 µm) Gephyrocapsa ericsonii coccoliths with bridges, Syracosphaera pulchra with intact central area grills, and Umbellosphaera tenuis coccoliths. In addition, several whole coccospheres were observed. The high clay content in this core likely favored coccolith preservation. In the diluted interval with fewer coccoliths below 17.35 m, preservation remained good even though coccoliths were much sparser in slides.
3.3 Relative abundances and Noelaerhabdaceae coccolith size and mass
Florisphaera profunda constitutes on average 80 % of total coccoliths (minimum 64 %, maximum 93 %) (Fig. 4b), and Noelaerhabdaceae coccoliths constitute on average 18 % (range 6 % to 35 %) (Fig. 4c). The highest percentage of F. profunda is observed during MIS 3, with lowest abundances occurring in MIS 7. F. profunda percentages and trends are broadly confirmed with manual counts in a subset of samples (Fig. S2). The other main coccolith groups combined generally constitute < 2.5 % of the total assemblage in the interval MIS 1 to 7 (Fig. 4d–f). These minor coccolith groups (Helicosphaera, Umbilicosphaera, S. pulchra) show no clear trends or rhythms in abundance over the study interval.
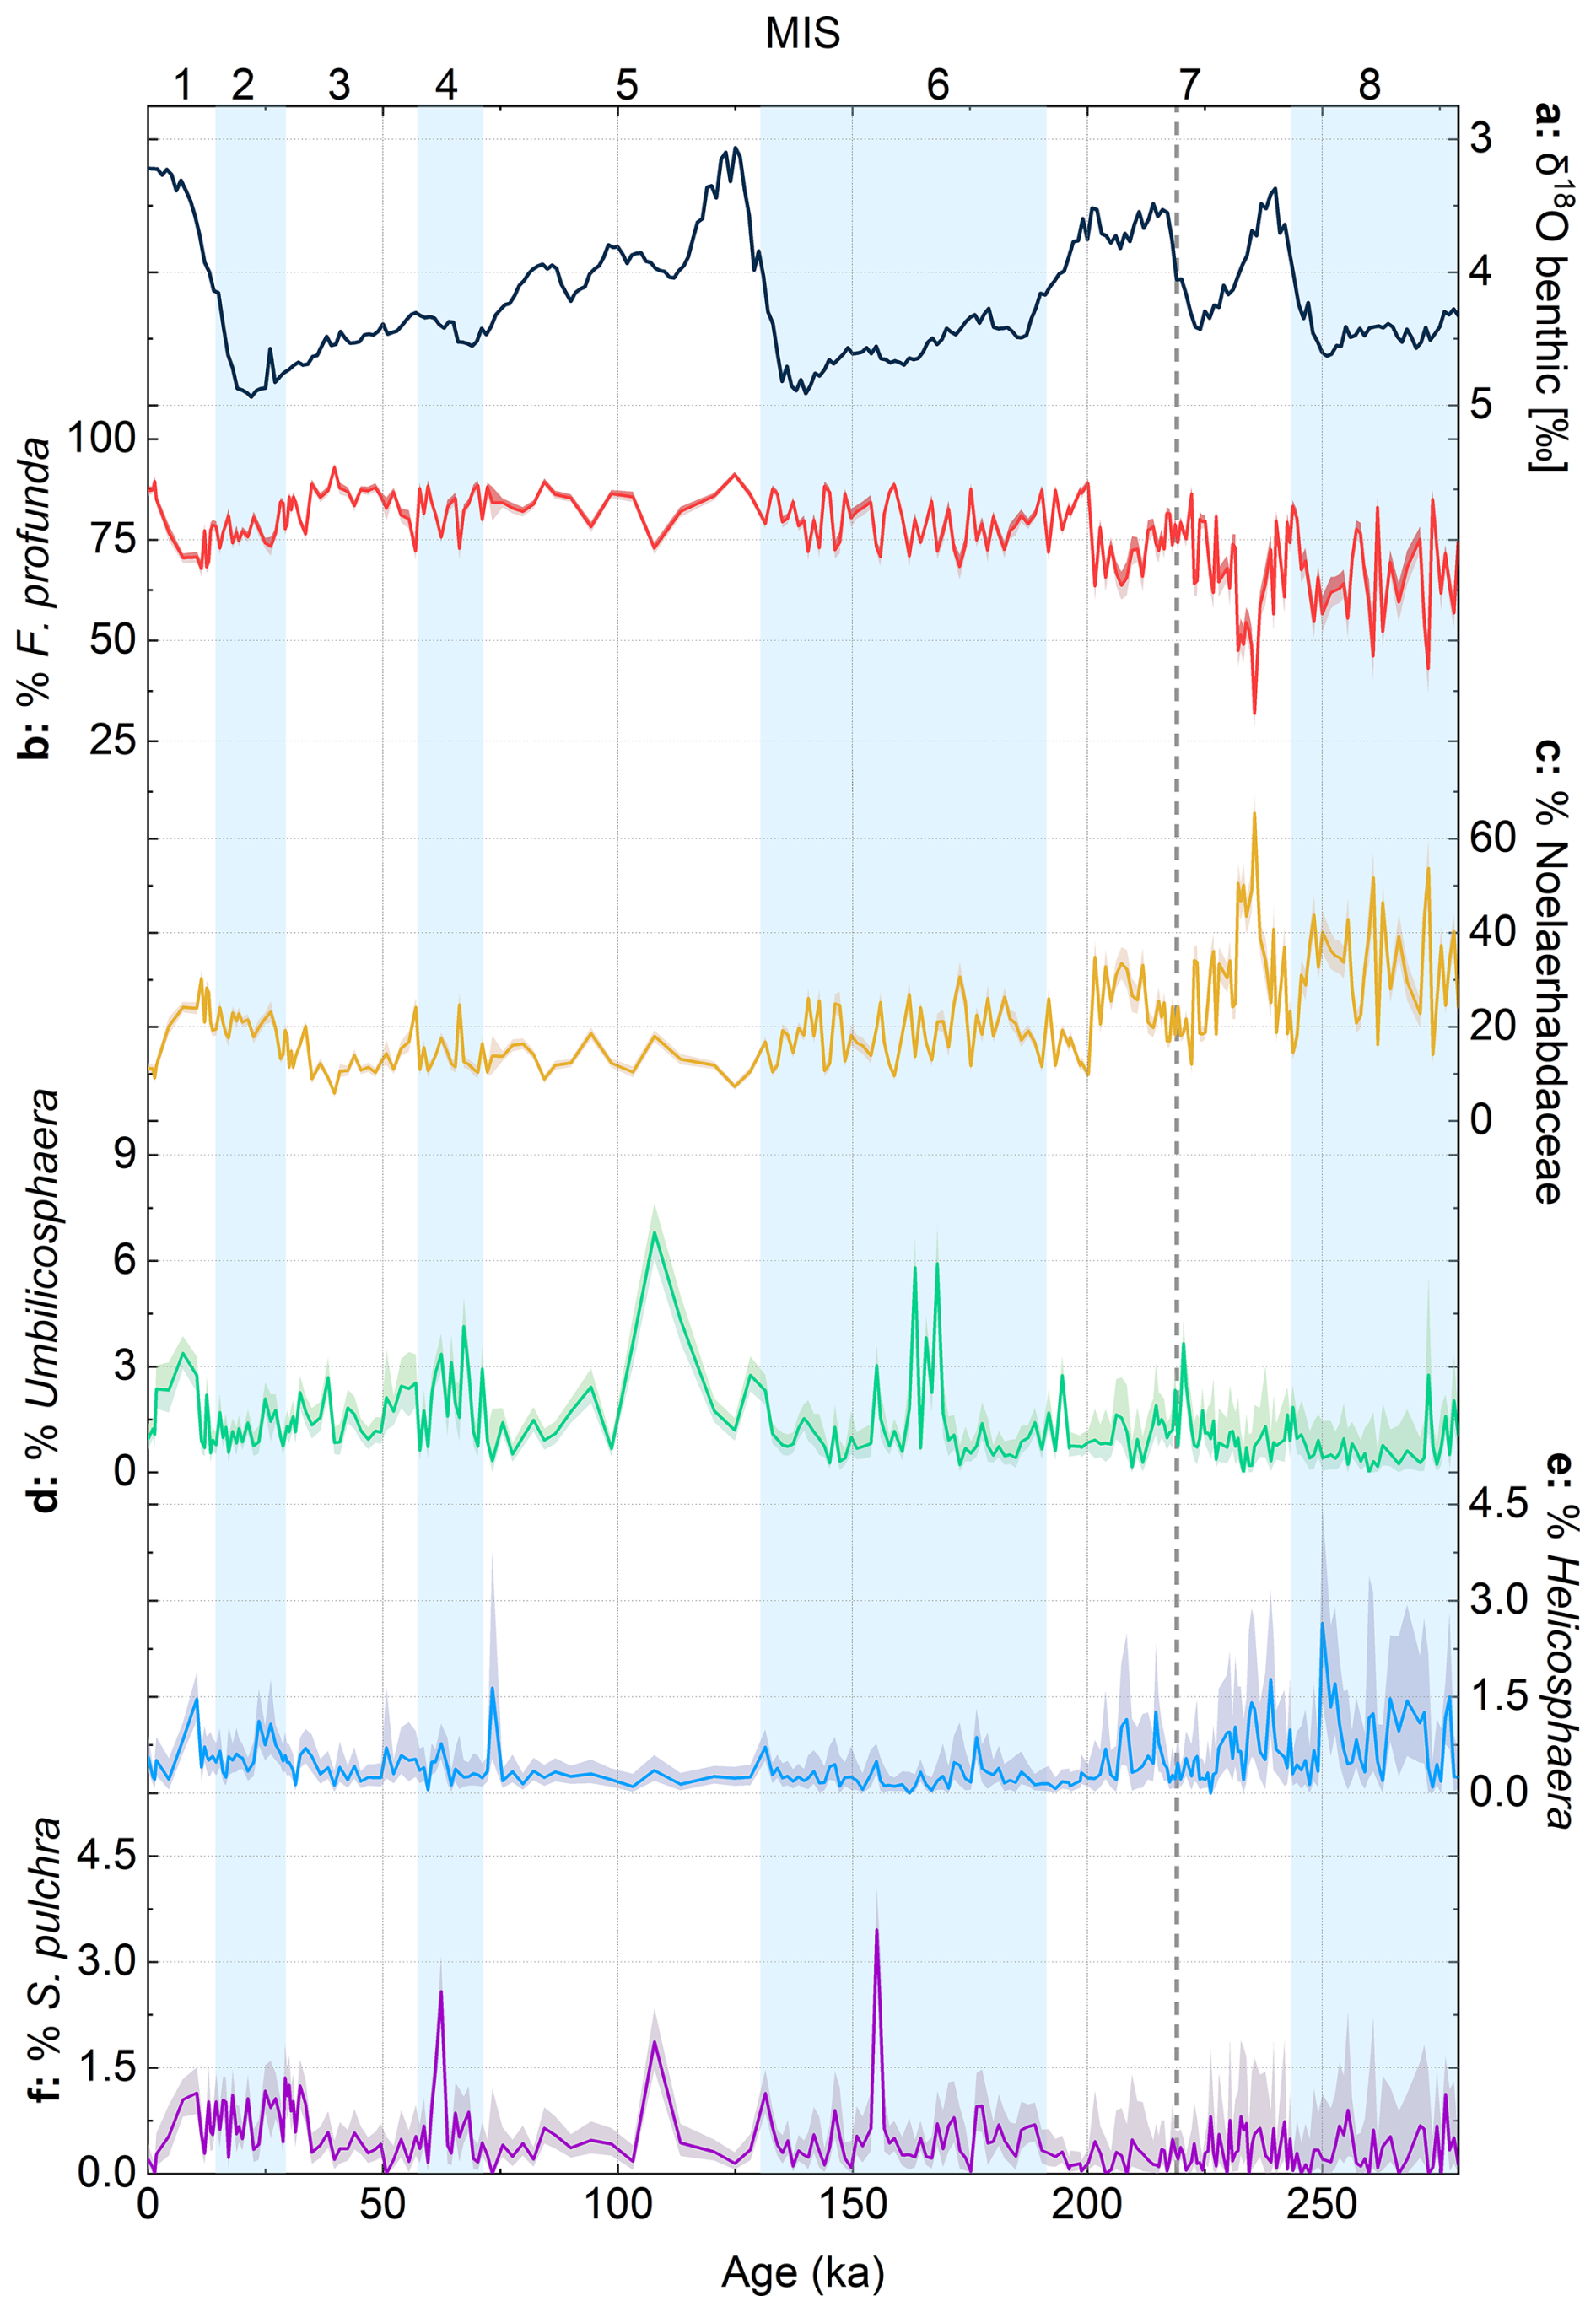
Figure 4Relative abundances of different coccolith species/groups from core MD12-3412, plotted with the global benthic δ18O stack (Ahn et al., 2017). Shaded error intervals on relative abundance represent Clopper–Pearson 95 % confidence intervals, calculated using PAST5 software. Glacial marine isotope stages (MISs) are shown as blue bands. The dashed gray vertical line in MIS 7 represents the transition below which coccolith counts are low; thus we have low confidence in relative abundance data below this interval (see also Fig. S2 for a comparison of automated and manual counts).
Within the Noelaerhabdaceae, we grouped together small (< 2.5 µm) and medium to large (> 2.5 µm) coccoliths and calculated their relative abundance as a percentage of total Noelaerhabdaceae (Fig. 5b, c). The small group comprises the identified morphospecies E. huxleyi (coccolith length averaged over the entire study interval = 1.9 µm), G. caribbeanica (average coccolith length = 2.3 µm), and G. ericsonii (average coccolith length = 1.7 µm). The medium to large group comprises G. oceanica (average coccolith length = 3.6 µm), G. muellerae (average coccolith length = 2.6 µm), and grouped Reticulofenestra coccoliths (average coccolith length = 3.3 µm). The most abundant size class throughout was small Noelaerhabdaceae (Fig. 5b), sometimes constituting > 95 % and on average 86 % of all Noelaerhabdaceae coccoliths. Medium- to large-sized Noelaerhabdaceae ranged between 1 % and 61 %, with an average of 13.7 % (Fig. 5c). We observe glacial–interglacial variations in the relative abundance of the two Noelaerhabdaceae size groups from MIS 1 to 6, with small Noelaerhabdaceae most relatively abundant in MIS 2, 4, and 6 (glacials) (Fig. 5b). Medium to large Noelaerhabdaceae coccoliths show highest relative abundances during MIS 1, 3, and 5 (interglacials) (Fig. 5c). To illustrate the dominance of small Noelaerhabdaceae coccoliths during glacial periods, we plot the ratio of small coccoliths to medium and large coccoliths (Fig. 5d). The largest and heaviest coccoliths are observed in MIS 1, 3, and 5 interglacials. Average (whole-population) Noelaerhabdaceae coccolith mass varied from 1 to 5.8 pg (mean 2.2 pg, standard deviation 0.9 pg; Fig. 5g), while Noelaerhabdaceae coccolith length varied between 1.7 and 3 µm (mean 2.1 µm, standard deviation 0.2 µm; Fig. 5h). The higher relative contribution of small Noelaerhabdaceae coccoliths during glacials MIS 2, 4, and 6 (Fig. 5b–d) occurs alongside a higher total Noelaerhabdaceae AR and a higher NoMAR (Fig. 3e, f; see Sect. 3.4), indicating that Noelaerhabdaceae coccoliths are more numerically abundant when the smaller size group dominates during glacial periods.
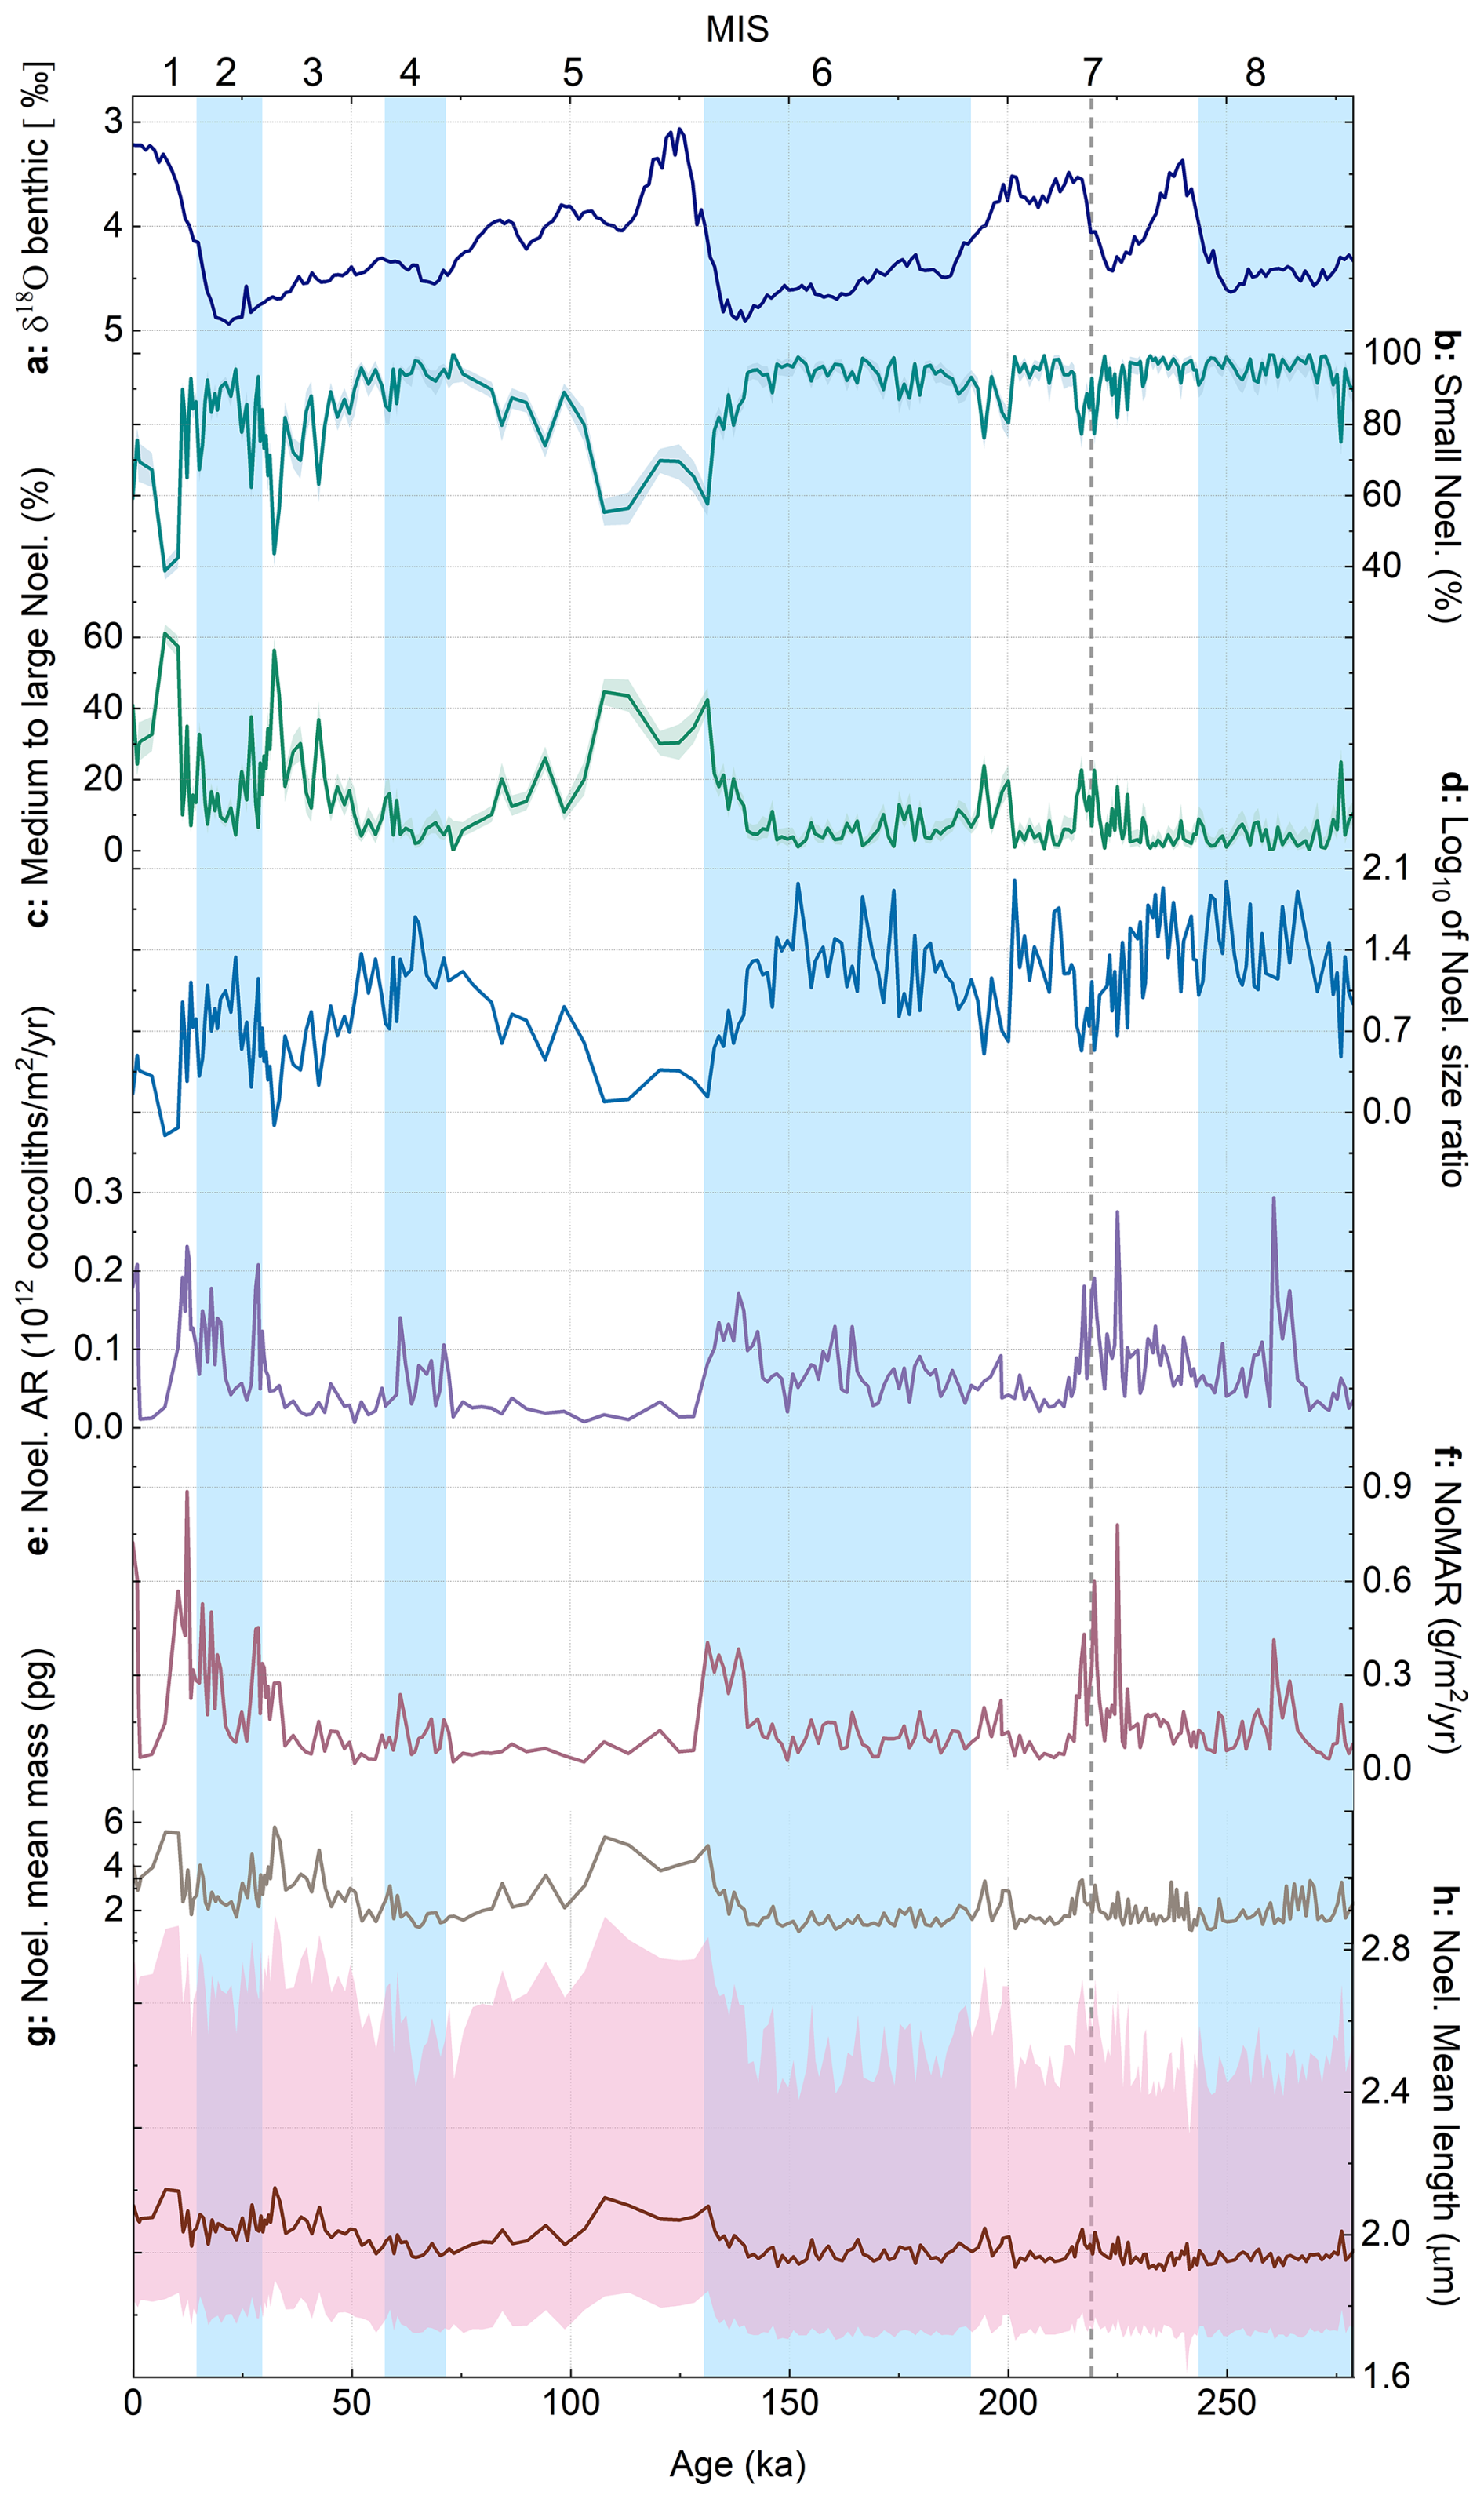
Figure 5Noelaerhabdaceae abundance and morphology in core MD12-3412: (a) δ18O benthic stack (Ahn et al., 2017), (b) relative abundance (within the Noelaerhabdaceae group) of small Noelaerhabdaceae (< 2.5 µm), and (c) medium to large Noelaerhabdaceae (> 2.5 µm). Shaded error intervals on relative abundance represent Clopper–Pearson 95 % confidence intervals. (d) log10 of Noelaerhabdaceae size ratio (small/medium+large), (e) Noelaerhabdaceae AR, (f) Noelaerhabdaceae MAR (NoMAR), (g) mean mass of Noelaerhabdaceae coccoliths, and (h) mean length of Noelaerhabdaceae coccoliths, with the 5th percentile and 95th percentile represented as shaded pink bands. Glacial marine isotope stages (MISs) are shown as blue bands. The dashed gray vertical line in MIS 7 represents the transition below which coccolith counts are very low; thus we have low confidence in relative abundance data below this interval.
3.4 Coccolith abundances, accumulation, and mass accumulation rates
Total coccolith absolute abundances (CAs) over the last 279 kyr averaged 3.5 × 10⁹ coccoliths g−1 and varied between 0.2× 10⁹ and 14.5 × 10⁹ coccoliths g−1 with highest values during the latest Holocene, relatively elevated values from MIS 1 to MIS 5, and lowest values during MIS 7 and 8 (Fig. 3c). Coccolith accumulation rates (cARs) vary between 0.03 × 10¹² coccoliths m−2 yr−1 in MIS 7 to 2 × 10¹² coccoliths m−2 yr−1 in MIS 1 (Fig. 3d). The average F. profunda AR was 298 × 109 coccoliths m−2 yr−1, whereas the average Noelaerhabdaceae AR was 73 × 109 coccoliths m−2 yr−1. The cAR is generally higher during glacials (MIS 2, 4, and 6; with the exception of a trough in the middle of MIS 2) and lower during interglacials (MIS 1, 3 and 5), although this trend breaks down in MIS 7–8, where CA is low and turbidite frequency and intensity are high (Fig. 3b–d).
Coccolith MAR (cMAR; Fig. 3e) is on average 0.65 g coccolith CaCO3 m−2 yr−1 (range 0.09 to 2.8 g coccolith CaCO3 m−2 yr−1). cMAR shows similar patterns to cAR, with generally higher values during glacial periods of the last 200 kyr. The relative contribution of F. profunda to total cMAR (Fig. 3e) is lower than its numerical contribution (cAR; Fig. 3d) because of the low mass of individual F. profunda coccoliths relative to Noelaerhabdaceae and other coccoliths. On average, F. profunda coccoliths contribute 65 % to total cMAR, whereas Noelaerhabdaceae coccoliths contribute 24 % (Fig. 3e). Noelaerhabdaceae cMAR (NoMAR) ranges from 0.02 to 0.9 g m−2 yr−1 (Fig. 3e). On average, cMAR from the main nannofossil groups (Noelaerhabdaceae, F. profunda, Umbilicosphaera, Helicosphaera, and S. pulchra) makes up 0.47 % of the total sedimentary MAR, tMAR (Fig. 3f), at Site MD12-3412. Although this low coccolith CaCO3 contribution is not surprising in the Bengal Fan sedimentary environment, we note that this is likely to be an underestimate because some coccoliths (e.g., coccoliths in aggregates or coccolith fragments) are inevitably missed in the automated image analysis workflow.
Spectral analyses of coccolith accumulation rate (total cAR, F. profunda AR, and Noelaerhabdaceae AR) and cMAR (total coccoliths) records reveal > 95 % significant variance at the 100 kyr frequency and > 95 % significant variance in the precession band (19–23 kyr) (Fig. 6). Precession-band variability is absent from the total sediment MAR record (Fig. 3f) and must thus be related to coccolith production and/or export flux from the surface ocean. Coherence and phase analysis between the MD12-3412 G. ruber δ18O record and the cAR record shows that the two records (from the same core and on the same age model) are highly coherent and in phase (within error) in the precession band (Fig. S3).
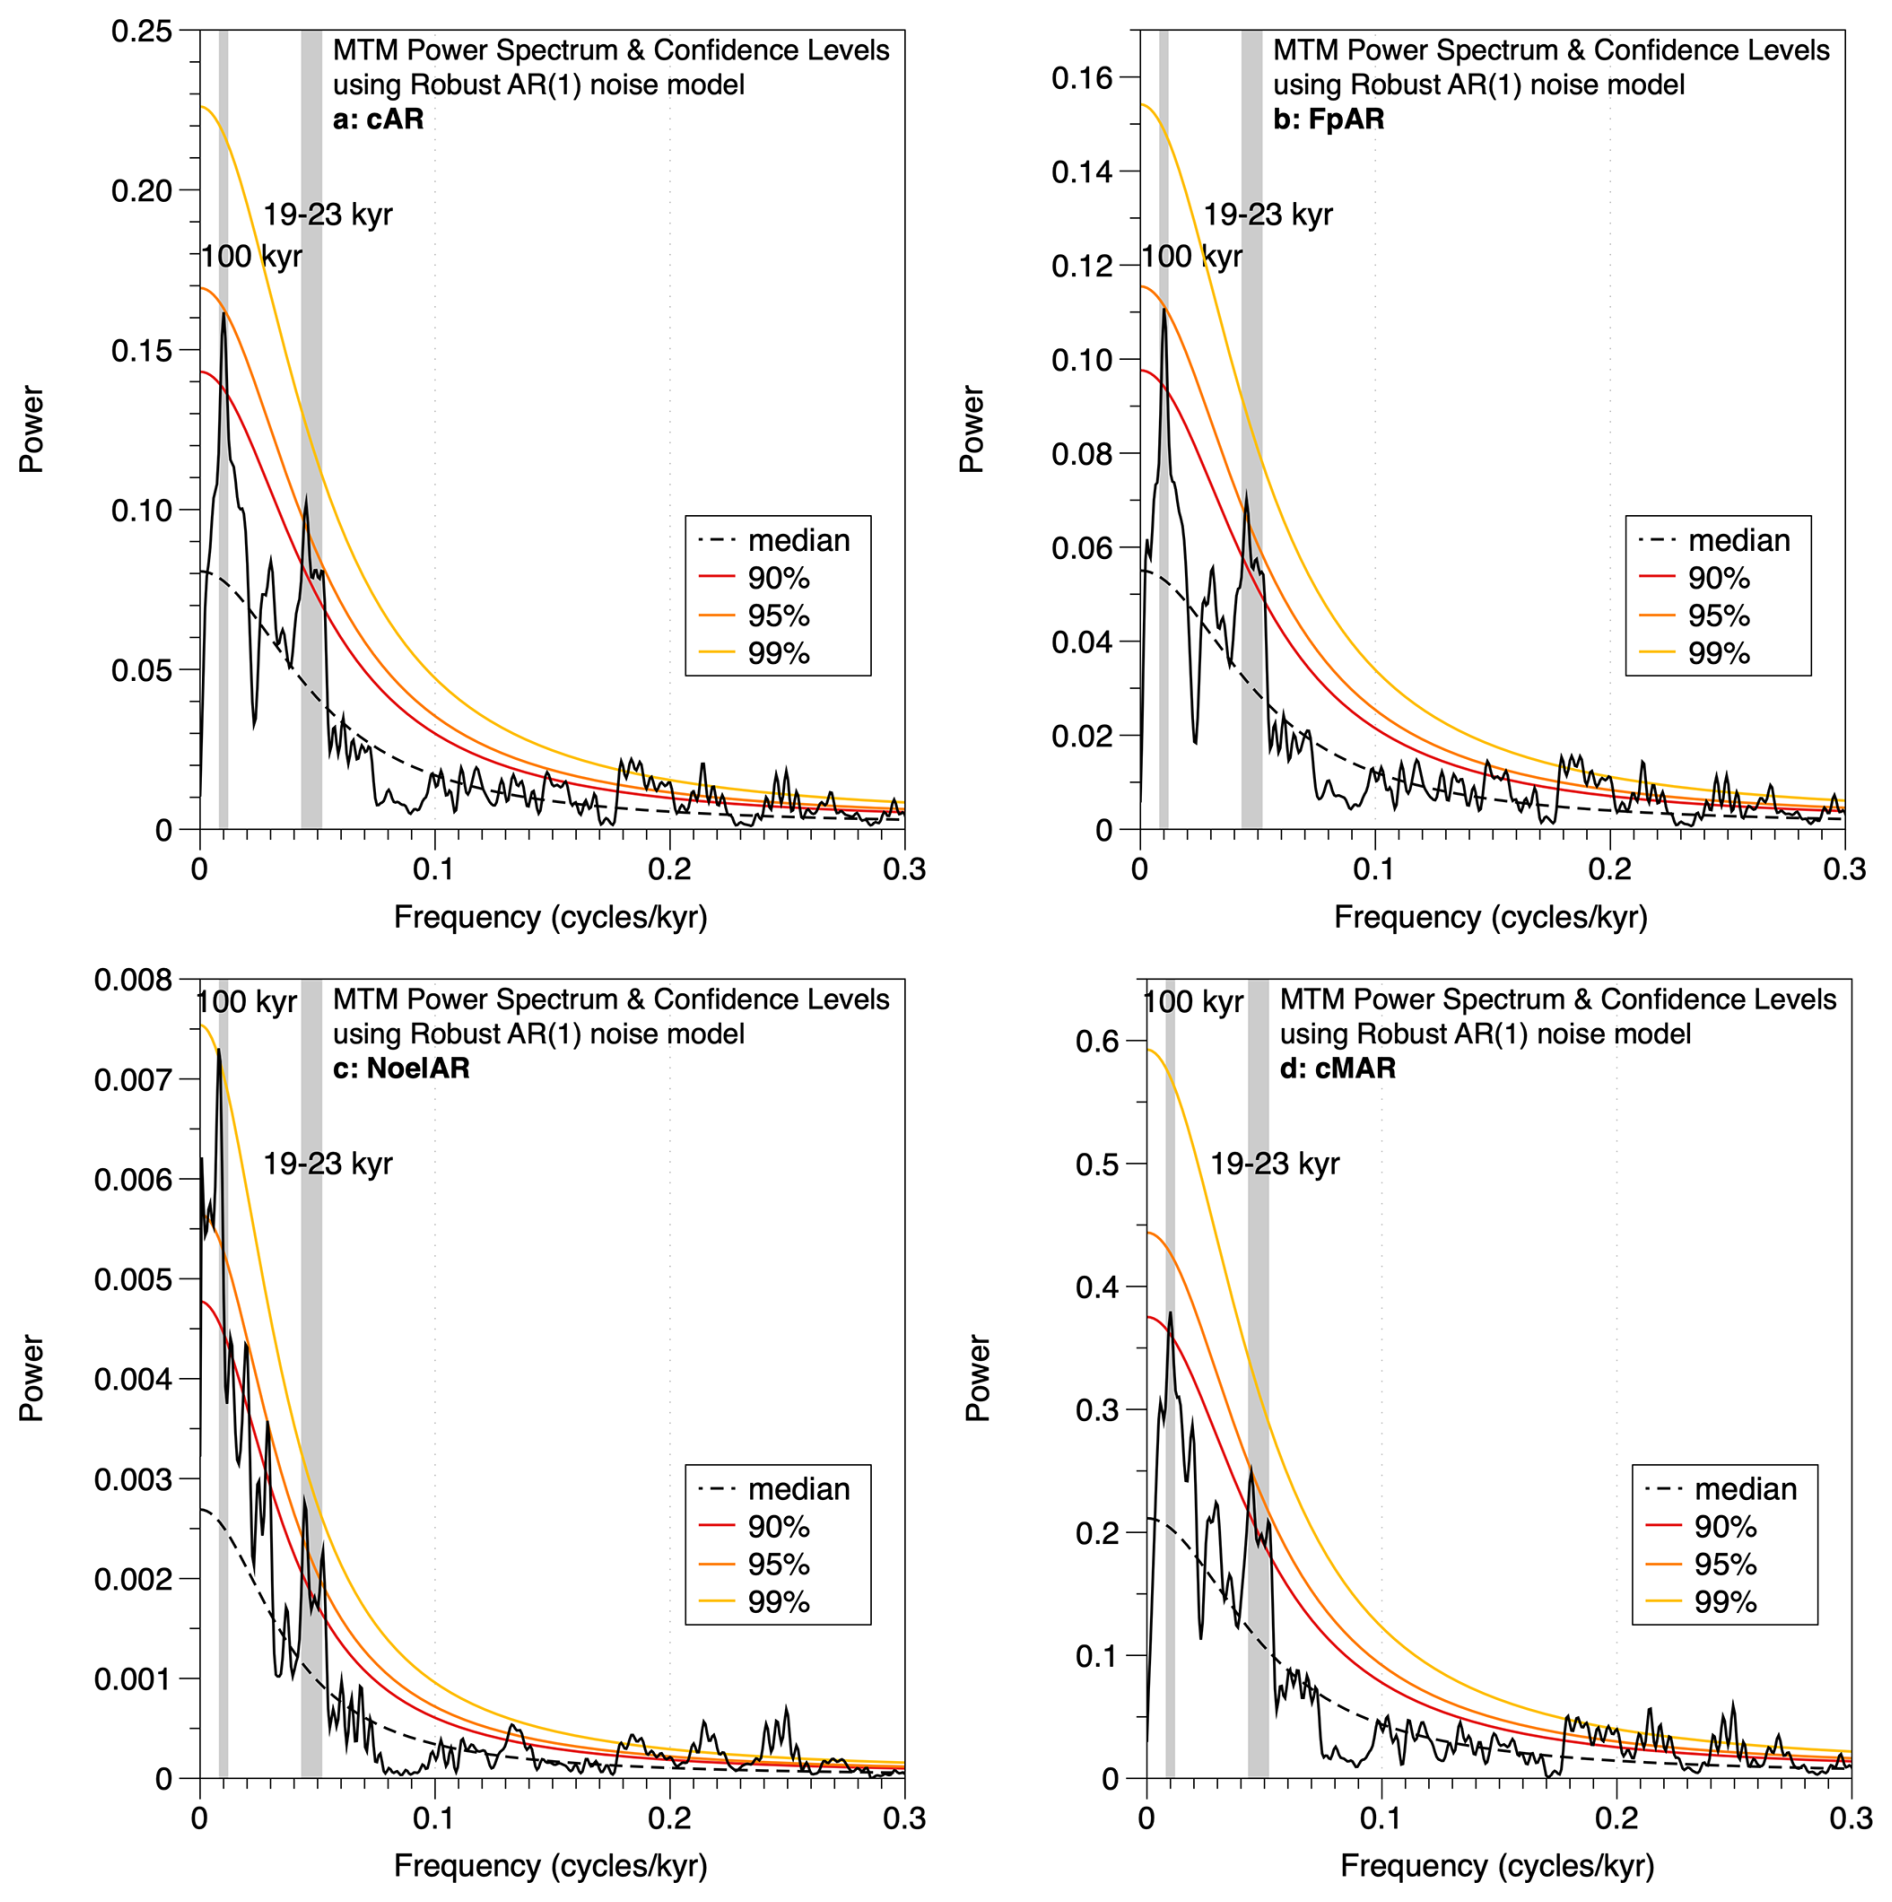
Figure 6Multi-taper method (MTM) spectral analyses of (a) total coccolith AR, (b) F. profunda AR, (c) Noelaerhabdaceae AR, and (d) total coccolith MAR. Confidence levels are shown and were computed using a robust AR(1) noise model. All panels show > 95 % significant variability in the precession band (19–23 kyr) and at the ∼ 100 kyr period.
4.1 Turbidites and coccolith sedimentation patterns
Before we can interpret our calcareous nannofossil data in terms of coccolith export and primary productivity fluctuations, we must be certain that coccolith sedimentation patterns in core MD12-3412 primarily reflect in situ production and export rather than transport by turbidity flows. We infer that this is the case based on several lines of evidence. Firstly, turbidites as represented by median grain size peaks (Fig. 3b; Fauquembergue et al., 2019) do not consistently co-vary with coccolith abundances (Fig. 3c). Turbidites did, however, play a major role in sediment deposition at this site, especially during sea-level lowstands (glacials) when the channel was most active (Fauquembergue et al., 2019; Joussain et al., 2016). Highest turbidite frequency aligns with periods of highest estimated sedimentation rates, supporting our revised age model (Fig. 2). Our results show that cMAR constitutes only a very small portion of total sediment MAR (< 0.5 %) at this site, as a result of dilution by terrigenous material transported in the Bengal Fan system, although this is likely an underestimation of coccolith calcite contribution due to automated recognition techniques (i.e., some coccoliths are likely missed because they are not recognized, they occur in aggregates, or they are fragmented). Total % CaCO3 values over the Holocene at nearby core MD12-3617 (16°30′ N, 87°47′ E) vary between 2 % and 7 % (Moreno et al., 2020), illustrating the low relative contribution of CaCO3 to sediments in the region.
Coccolithophore AR (cAR) and cMAR trends in core MD12-3412 co-vary with sedimentation rate changes, with generally higher values during higher-sedimentation-rate glacial intervals (Fig. 3d, e). However, in the sedimentary setting of our study site, sedimentation rates cannot provide a first-order indication of biological export productivity, as is the case in open-ocean pelagic sedimentation realms where almost all sediment is made up of biogenic components (CaCO3, opal). Our data show that the lowest coccolith abundance occurs during the period with the most intense turbidite activity (Fig. 3b, c), and we also find that cAR and cMAR records have unique spectral characteristics (Fig. 6). Thus, we think that few coccoliths are transported to the site in turbidity currents, and we infer that higher cAR and cMAR are indicators of increased coccolith carbonate export from the overlying water column, reflecting increased coccolithophore export productivity. In core MD12-3412, no difference in G. ruber δ18O trends was noted when foraminifera were picked exclusively from hemipelagic intervals versus when they were picked without discriminating the origin of the sequences (Fauquembergue et al., 2019), supporting the idea that transport of marine carbonate microfossils via turbidity currents was negligible.
The mass accumulation rate of Noelaerhabdaceae coccoliths, NoMAR, has been shown to be driven primarily by coccolith flux in the tropical Indo-Pacific, where this group generally makes up around half of the total coccolith mass (Beaufort et al., 2022). A dominant control of AR on NoMAR is also the case in core MD12-3412 (Fig. 6e–g). NoMAR values in core MD12-3412, along with the contribution of Noelaerhabdaceae to total coccolith MAR (Fig. 3e), are slightly lower than the range documented in an Indo-Pacific stack of seven tropical cores over the late Pleistocene (∼ 0.5 to 2 g m−2 yr−1) but show quite similar trends (Beaufort et al., 2022) (Fig. 7d). NoMAR values at our central northern BoB site are similar to those at Site U1448 in the Andaman Sea and at Site U1446 in the northwestern BoB and are higher than those at southern BoB Site U1443 (Fig. 7).
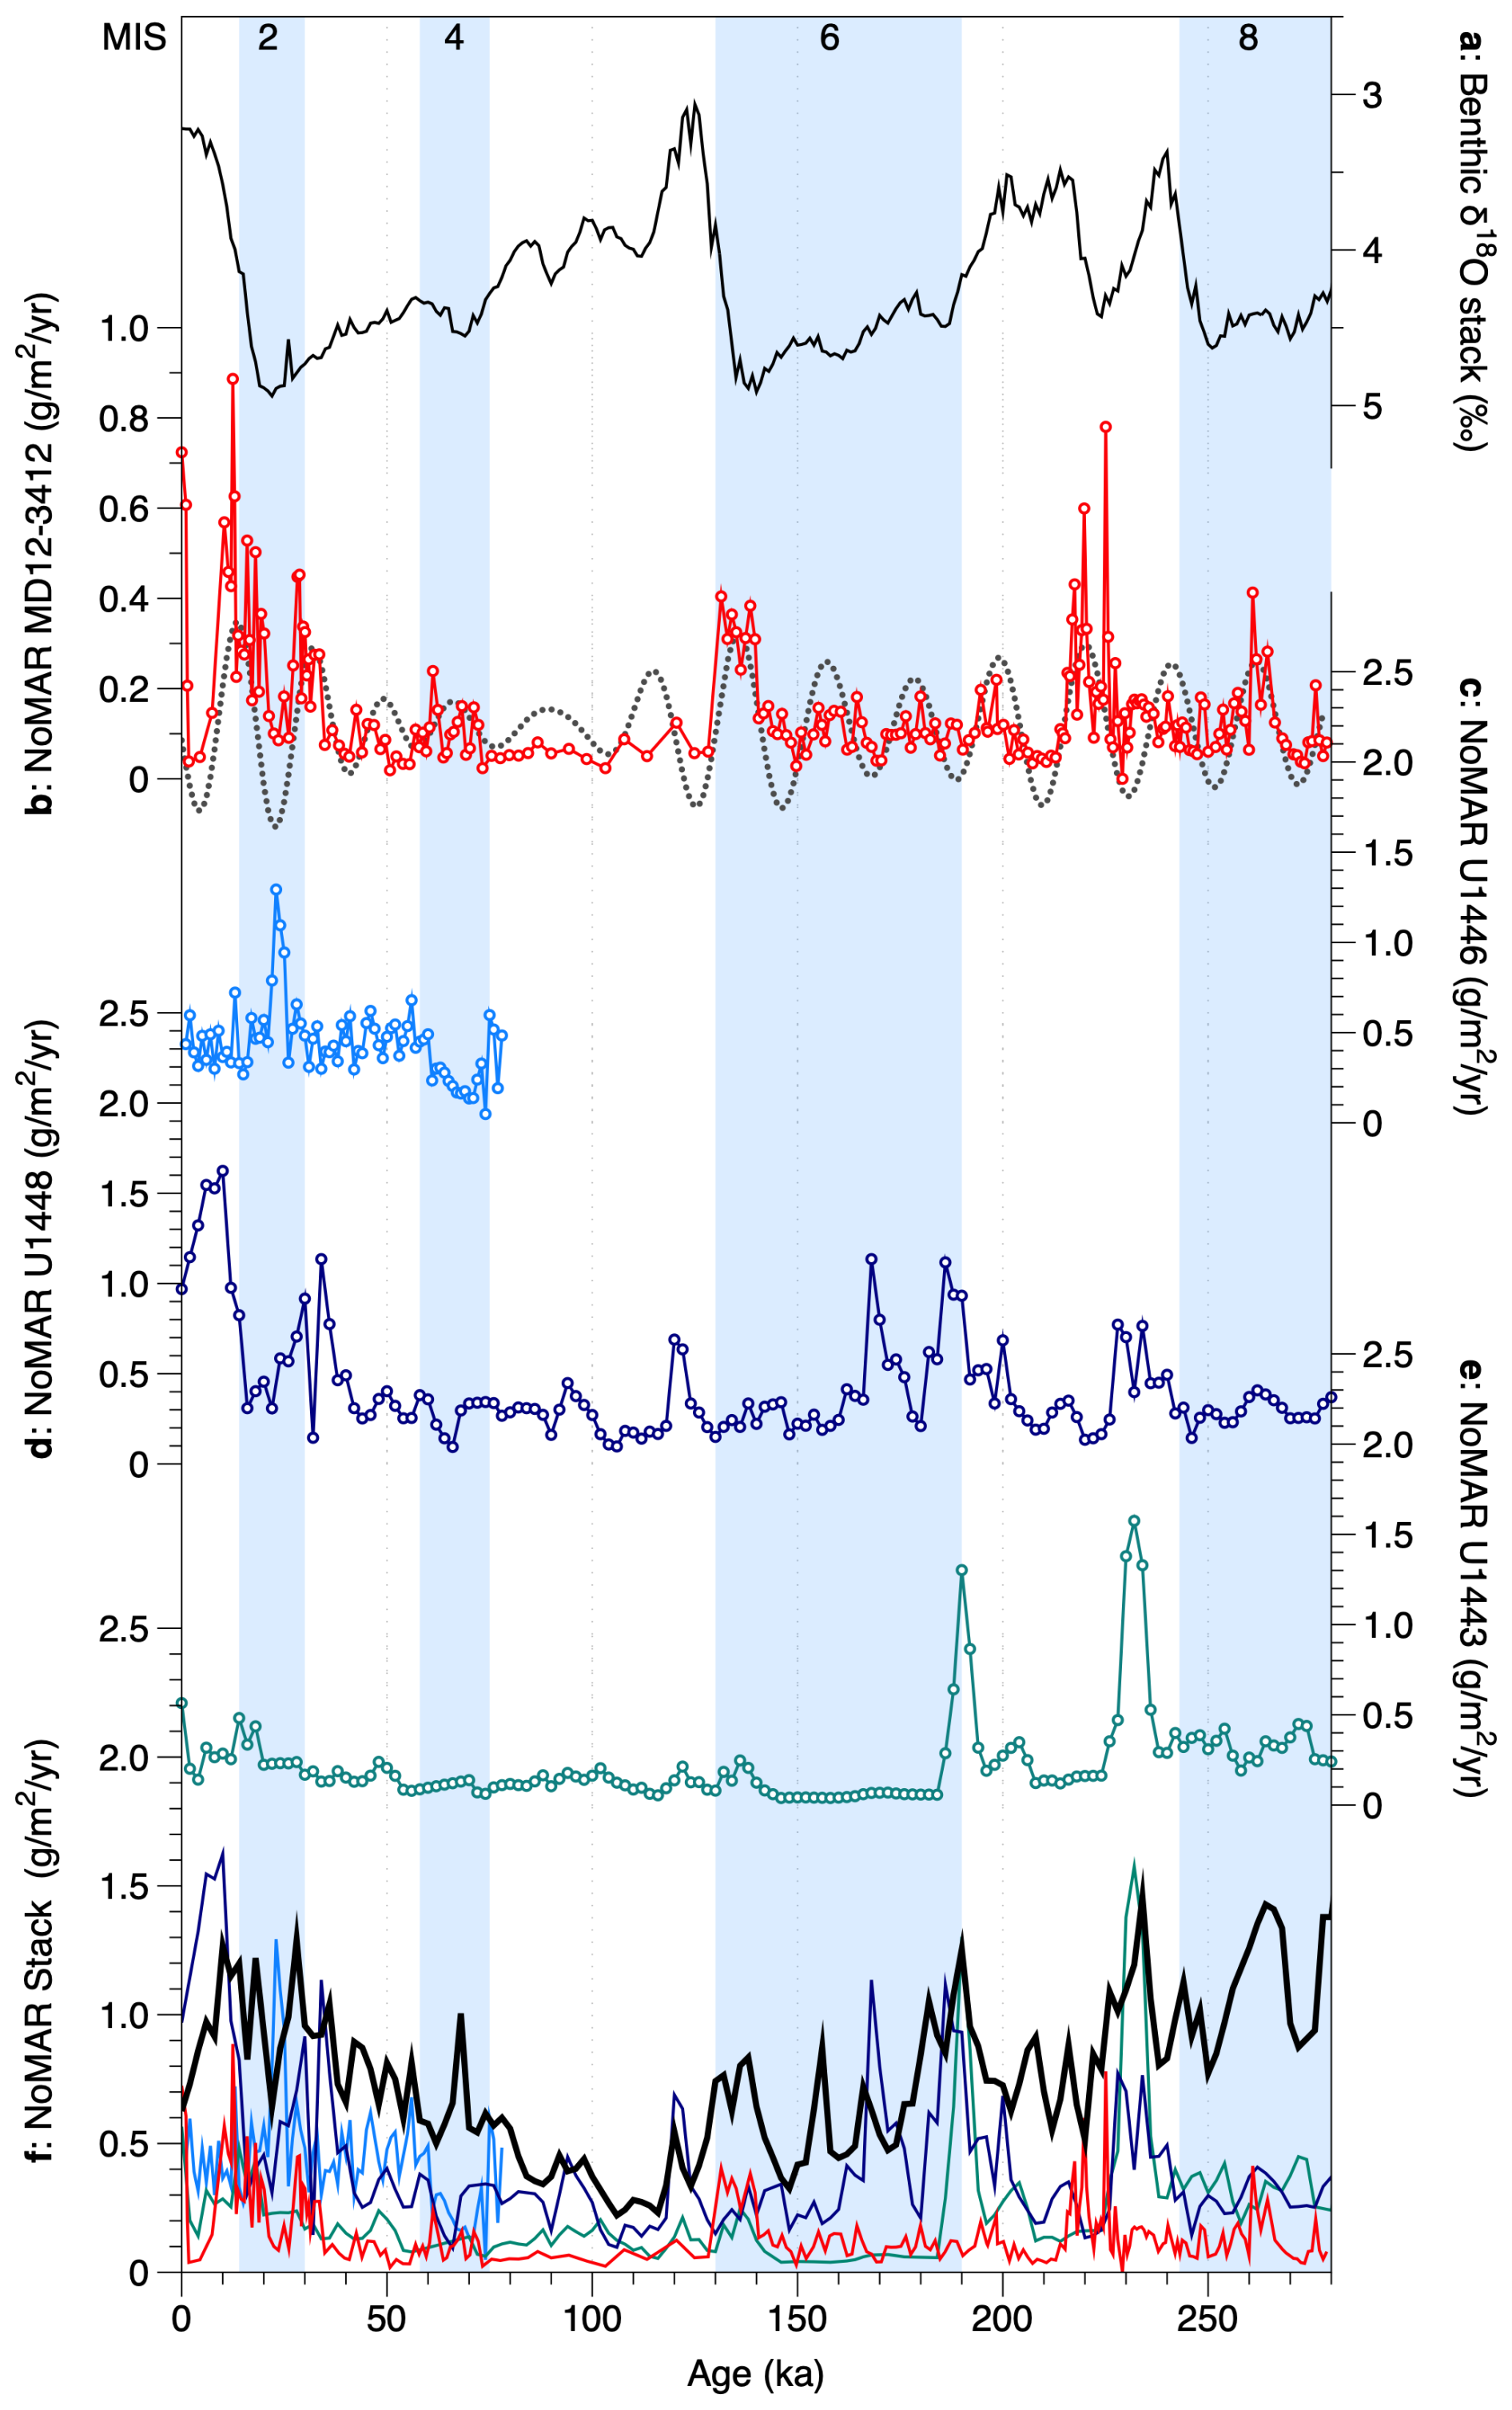
Figure 7Noelaerhabdaceae coccolith mass accumulation rates (NoMARs) from different sites in the Bay of Bengal and an Indo-Pacific stacked record: (a) global benthic foraminiferal δ18O stack (Ahn et al., 2017); (b) NoMAR from this study, core MD12-3412, shown with its 17–25 kyr precession-band filter (dashed gray line); (c) NoMAR from IODP Site U1446 (see Fig. 1); (d) NoMAR from IODP Site U1448 (Fig. 1); (e) NoMAR from IODP Site U1443 (Fig. 1); (f) all records plotted with the NoMAR Indo-Pacific tropical stack (Beaufort et al., 2022) (thick black line). Glacial marine isotope stages are indicated by blue bands.
4.2 Glacial–interglacial and precession-band productivity changes in the northern BoB
Spectral analyses of the cAR and cMAR records reveal significant (> 95 % CI) variance at two main orbital frequencies: ∼ 100 kyr (a period of Earth's orbital eccentricity and of the late Pleistocene glacial–interglacial cycles) and ∼ 19–23 kyr (Earth's orbital precession periods) (Fig. 6). On ∼ 100 kyr timescales, higher cAR and cMAR occur during glacial periods (Fig. 3e). More efficient export of coccolith CaCO3 via ballasting by terrigenous particles during glacials is unlikely to have driven this trend, given that compiled BoB monsoon records suggest a weaker glacial monsoon rather than a stronger one (e.g., Haridas et al., 2022). Our results from the central northern BoB are coherent with total CaCO3 records from the northwestern BoB, showing peak carbonate MAR or content during glacials, interpreted to reflect increased productivity (Da Silva et al., 2017; Panmei et al., 2018; Phillips et al., 2014). In these studies, ISM weakening during glacial periods is suggested to lead to increased productivity and enhanced CaCO3 deposition via reduced salinity stratification and increased nutrient input from below. We also document a strong precession component in the cAR record (Fig. 6a) that is highly coherent and in phase with the precession component of the G. ruber planktic δ18O record from the same core (Fig. S3). This suggests that South Asian monsoon variability on precessional timescales (Cheng et al., 2022) impacts both coccolithophore productivity and upper-ocean seawater δ18O (recorded by G. ruber) at our northern BoB study site, presumably via precipitation and runoff.
Several mechanisms could be invoked to explain monsoon impacts on productivity at northern BoB Site MD12-3412. Firstly, stronger wind-driven mixing during ISM maxima could break up stratification, increasing bottom-up nutrient inputs and fueling productivity, as proposed for southern BoB ODP Site 758 (of which Site U1443 is a re-drill) (Bolton et al., 2013). However, although wind intensity is highest during the ISM in our study region, modern data indicate that, in the northern BoB (in contrast to the southern BoB), the mixed layer is much shallower during the summer monsoon season than in winter (∼ 40 m vs. 60 m; Fig. 1), making this hypothesis unlikely. Secondly, productivity at Site MD12-3412 might be suppressed during ISM maxima due to increased runoff and salinity stratification, as proposed for several sites in the northwestern and northeastern BoB (Bolton et al., 2024; Phillips et al., 2014; Thirumalai et al., 2025; Zhou et al., 2020). To assess this hypothesis, we compared productivity variations on precession timescales recorded in the cAR record with a summer monsoon multi-proxy stack from an Arabian Sea core (Caley et al., 2011) and with a stratification record based on planktic foraminiferal δ18O gradients from southern BoB ODP Site 758 (Bolton et al., 2013) (Fig. 8). We note that these three records are on independent age models, so some differences in phasing between them may occur related to age model uncertainty. Figure 8 shows that, in 75 % of cases, maxima in northern BoB productivity on precession timescales coincide with minima in ISM strength, as suggested by the Arabian Sea ISM stack and by southern BoB stratification, which is higher during ISM minima due to weaker winds (green bars in Fig. 8). In the remaining 25 % of cases, the relationship is reversed, with northern BoB productivity maxima occurring during times of maximum monsoon strength and minimum southern BoB stratification (gray bars in Fig. 8). Based on this, we infer than coccolithophore productivity at northern BoB Site MD12-3412 was generally higher during ISM minima, when runoff plus precipitation was reduced and salinity stratification likely weakened, allowing nutrients to mix into the upper water column in the absence of a thick barrier layer. In the modern northern BoB, the barrier layer, defined as a parcel of water sitting between the base of the mixed layer and the top of the thermocline due to salinity stratification, is present year-round with a thickness of up to 60 m and a spring minimum and late-winter maximum thickness (Mignot et al., 2007; Thadathil et al., 2007).
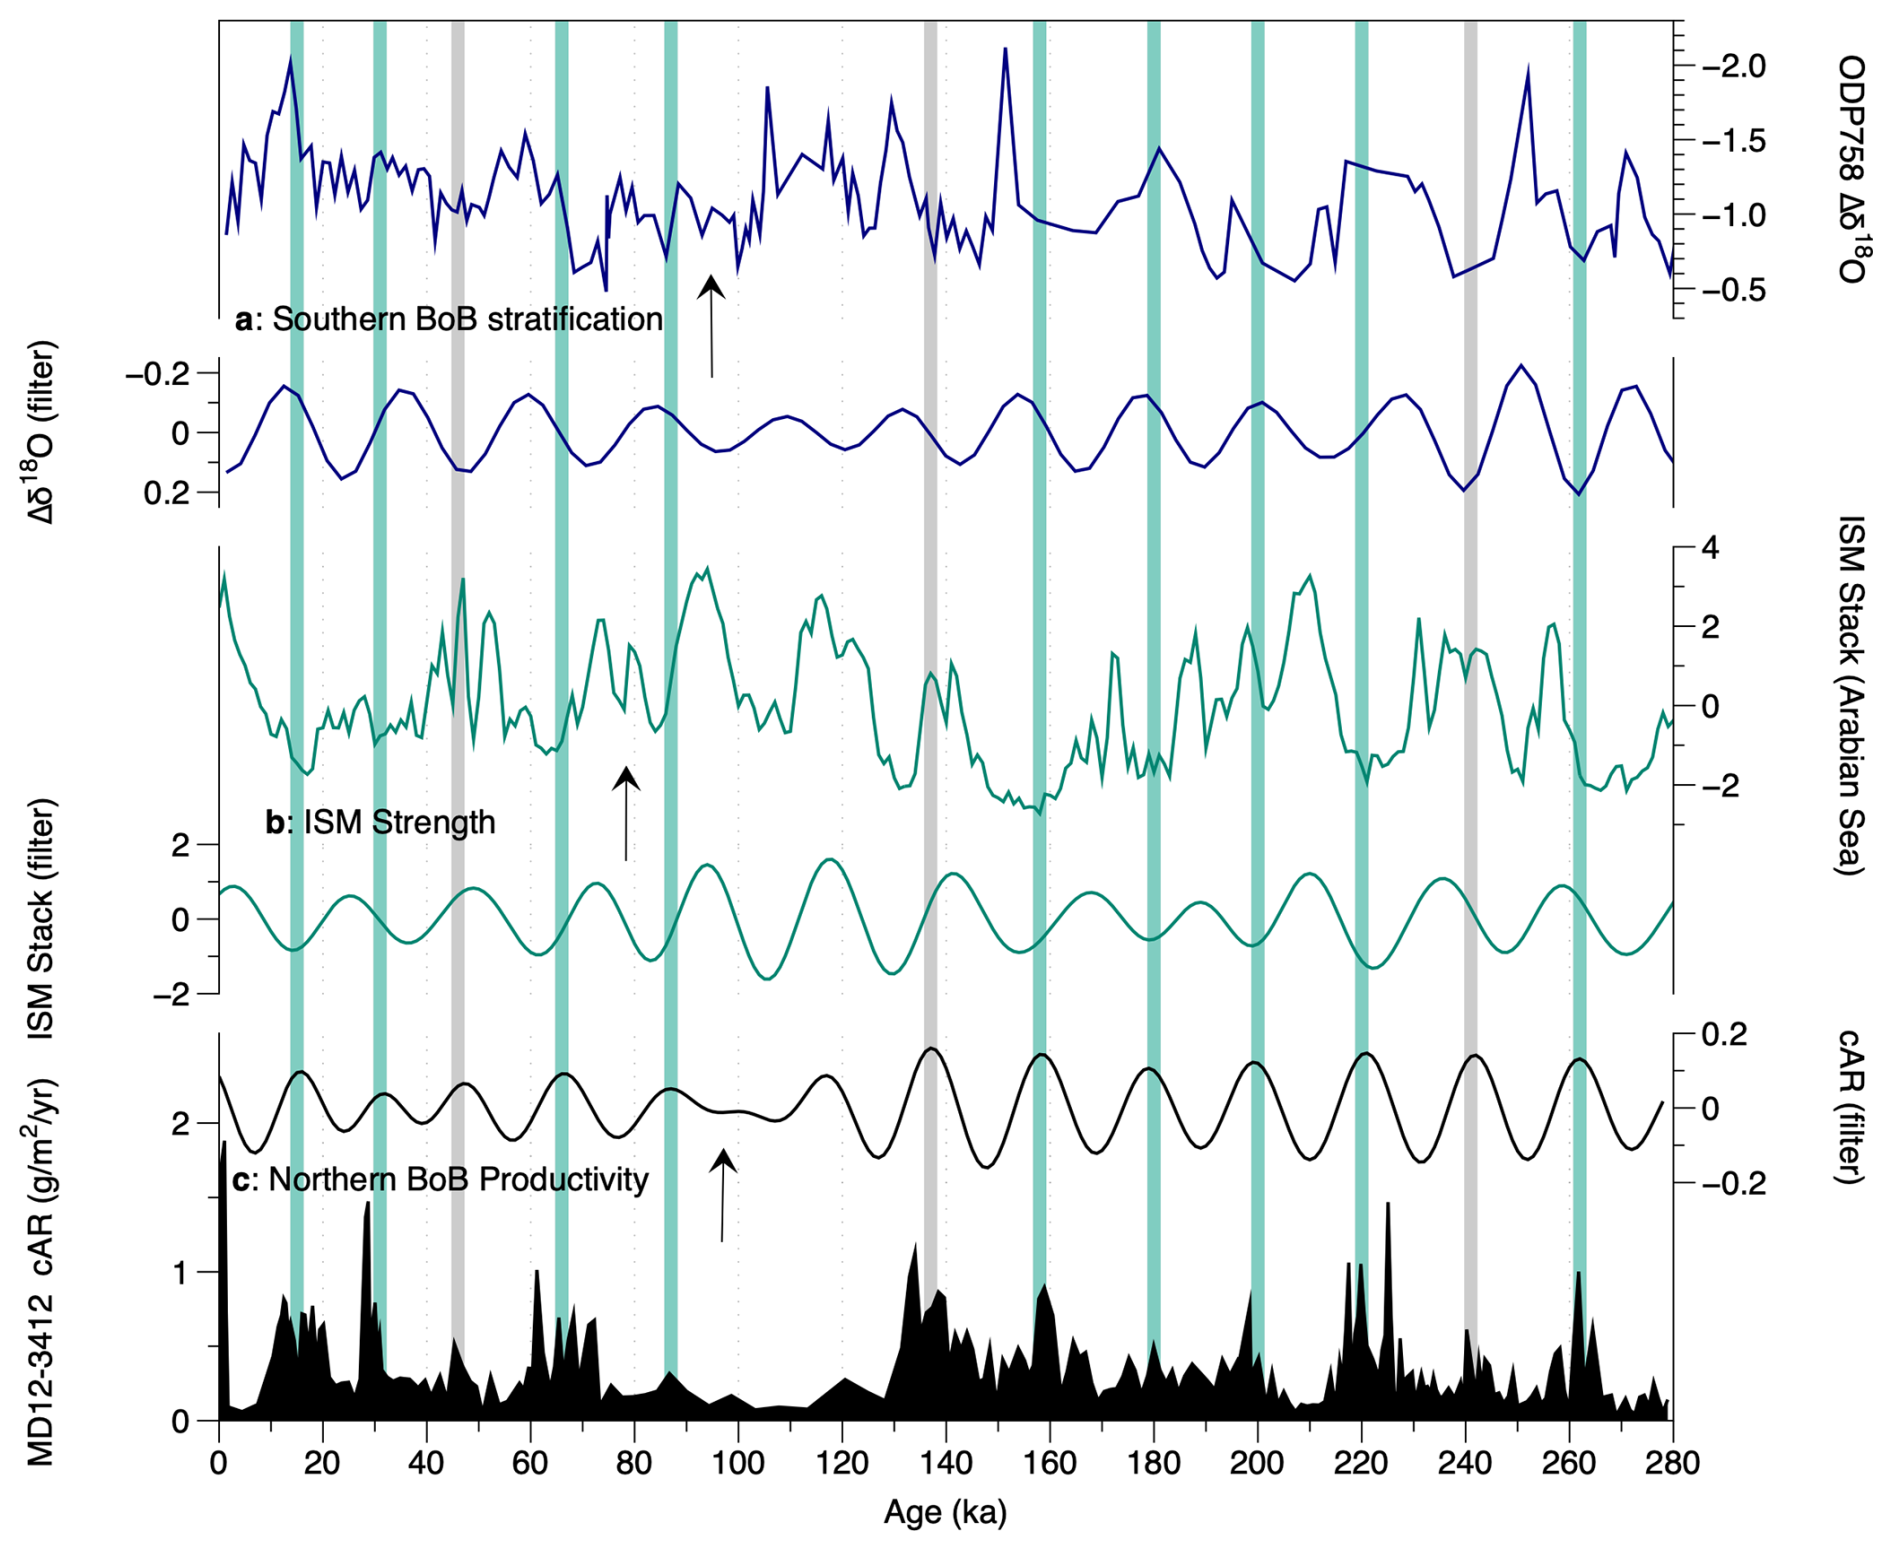
Figure 8Coccolithophore productivity in core MD12-3412 compared with indicators of South Asian summer monsoon strength. (a) ODP Site 758 δ18O G. ruber–N. dutertrei record, with maximum stratification (minimum monsoon wind mixing) plotted up (Bolton et al., 2013). (b) Indian summer monsoon stack based on multi-proxy from the Arabian Sea (Caley et al., 2011), with maximum monsoon strength plotted upwards. (c) cAR at Site MD12-3412. All records are shown as both raw and filtered to isolate their significant precession components and assess phasing. Green bands indicate cAR maxima that occur in phase with ISM strength minima and stratification maxima (minimum winds). Gray bands indicate cAR peaks that occur during inferred monsoon maxima/stratification minima.
However, in our record, notable exceptions to the above pattern occur during which productivity (cAR) peaks are associated with a strong monsoon (Fig. 8); thus other factors or mechanisms must be at play. The frequency and intensity of cyclones and eddies that trigger phytoplankton blooms in the BoB (e.g., Kuttippurath et al., 2021), along with interannual climate phenomena such as the El Niño–Southern Oscillation and the Indian Ocean Dipole (Currie et al., 2013), also have the potential to affect productivity patterns in the relatively oligotrophic central northern BoB, yet these relatively short-term events are challenging to reconstruct in the fossil record. The complexity of productivity dynamics in the stratified northern BoB was recently highlighted by a study showing suppressed productivity during both maxima and minima in monsoon strength over the last 20 kyr (Thirumalai et al., 2025), although this study was not long enough to resolve precession-scale variability.
In addition to the higher cAR and cMAR values discussed above, evidence for higher glacial productivity might also come from the higher relative abundance of different size classes of Noelaerhabdaceae coccoliths in core MD12-3412 (Fig. 5b, c). The ratio of small (< 2.5 µm) to medium to large (> 2.5 µm) Noelaerhabdaceae coccoliths in core MD12-3412 shows a clear glacial–interglacial pattern, with a dominance of small coccoliths during glacial intervals of the last 200 kyr (Fig. 5d). In the modern ocean and in the fossil record, a dominance of smaller Noelaerhabdaceae species is generally associated with higher-nutrient environments and higher coccolith carbonate export (Beaufort et al., 2022; Flores, et al., 1995; Flores et al., 2014; Hagino and Okada, 2004; Okada and Wells, 1997; Rickaby et al., 2007; Wells and Okada, 1996). In core MD12-3412, a higher ratio of small to larger Noelaerhabdaceae is accompanied by a higher NoMAR and a higher total cMAR during glacials, which we interpret to show enhanced coccolith CaCO3 export and higher productivity. This is consistent with studies showing that a weaker ISM prevailed during late Pleistocene glacials, resulting in relaxed stratification and more nutrient entrainment into the mixed layer (Banerjee et al., 2024; Bolton et al., 2013; Clemens et al., 2021; Haridas et al., 2022; Zhisheng et al., 2011). However, unlike cAR and cMAR records, the size ratio of Noelaerhabdaceae shows no significant spectral power in the precession band (not shown), suggesting that the relative abundance of small vs. large Noelaerhabdaceae morphotypes may also be responding to other forcing mechanisms, for example, temperature or evolutionary processes. Aside from size classes within the Noelaerhabdaceae, none of the other main (F. profunda) or more minor (Umbilicosphaera spp., Helicosphaera spp., S. pulchra) coccolith groups display either clear glacial–interglacial variability or precession-band variance (Fig. 4). This is perhaps not surprising for the minor groups, given the relatively small glacial–interglacial temperature changes and the likelihood that this part of the BoB remained relatively salinity-stratified throughout the studied time interval. However, the lack of orbital-scale variance in the relative abundance of F. profunda in a tropical, stratified region such as the northern BoB is surprising.
4.3 The role of F. profunda in BoB productivity
Calcareous nannofossil assemblages in core MD12-3412 from 0–200 ka are numerically dominated by F. profunda coccoliths in terms of relative abundance (∼ 60 %–90 %; Fig. 4b). In addition, F. profunda is the main contributor to cAR and cMAR (Fig. 3d, e). This is consistent with studies in the BoB that show an unusually high dominance (60 %–90 %) of F. profunda in water samples (Liu et al., 2020), sediment traps (Stoll et al., 2007), and sediment cores (Bolton et al., 2024; Robinson et al., 2016; Zhou et al., 2020), especially in the salinity-stratified northern parts of the BoB. Typically, F. profunda lives in the deep photic zone, characterized by relatively stable, nutrient-rich waters and low light (Ahagon et al., 1993; Molfino and McIntyre, 1990; Quinn et al., 2005). The dominance of F. profunda in the BoB highlights its affinity for the distinct hydrographic characteristics of this region (Liu et al., 2020), and the low light levels in its sub-euphotic zone habitat have led to suggestions that this species may be mixotrophic (Poulton et al., 2007). A strong correlation between F. profunda fluxes and organic carbon fluxes in BoB sediment traps suggests that DPZ productivity represents an important part of total productivity (Stoll et al., 2007). This is supported by our finding that total coccolith MAR is dominated by the F. profunda contribution in core MD12-3412, despite this species' low individual mass (Fig. 3).
The relative abundance of F. profunda is a well-established proxy for primary productivity in much of the tropical open ocean, with high abundances typically associated with overall low productivity (Beaufort et al., 1999; Bolton and Stoll, 2025; Hernández-Almeida et al., 2019; Saavedra-Pellitero et al., 2022). However, this index is based on the vertical stratification of coccolithophore communities and thus does not necessarily directly reflect primary productivity in the upper photic zone. The percentage of F. profunda has been applied as a paleoproductivity indicator at continental shelf sites in the northeastern BoB (core MD77-176; Zhou et al., 2020) and in the northwestern BoB (Site U1446; Bolton et al., 2024), with maximum F. profunda abundances occurring during the Holocene period of maximum monsoon runoff and stratification as indicated by independent proxies or models. In contrast, our results suggest this proxy may not be universally applicable in the BoB. At our central northern BoB site, F. profunda relative abundances are quite constant over the last 200 kyr (Fig. 4b), despite the fact that coccolith export by this DPZ coccolithophore species is a major part of total coccolithophore productivity and increases in concert with total cAR/cMAR, with significant variance at precessional timescales. At this location, F. profunda coccoliths are not more relatively abundant when Noelaerhabdaceae coccoliths show lower ARs, but, rather, their absolute abundance increases in concert with Noelaerhabdaceae and total coccolithophore productivity, generally during weaker ISM intervals. One mechanism to explain this synchronized coccolithophore productivity increase in the upper and lower photic zones could be the influence of increased turbidity caused by river runoff during periods of strong ISM. In this scenario, high concentrations of suspended particles in the upper water column could limit light penetration to the deep photic zone and reduce F. profunda productivity despite the availability of nutrients, whereas salinity stratification simultaneously limits nutrient input into the upper photic zone from below, impacting Noelaerhabdaceae productivity. A greater number of long-term coccolithophore assemblage records from different regions of the BoB are needed to shed light on the factors controlling deep-photic-zone productivity in this unique oceanographic region.
This study presents a high-resolution record of past coccolithophore dynamics and paleoproductivity spanning 279 kyr from core MD12-3412 in the central northern BoB. We interpret coccolith ARs and MARs to be indicative of coccolithophore productivity and export above this site. From our data, we infer that coccolithophore productivity in the northern BoB increased during inferred weak monsoon intervals both during glacial stages and on precessional timescales, most likely via the impact of stratification on nutrient input from below the barrier layer. The deep-photic-zone species F. profunda is a major constituent of exported coccolith CaCO3 at this site, contributing on average 63 % of total coccolith carbonate MAR. Noelaerhabdaceae coccoliths are the other major contributor to cAR and cMAR, and this group shows changes in the dominance of small versus larger coccoliths on glacial–interglacial timescales, with a dominance of smaller forms during (inferred higher productivity) glacials. However, in contrast to total Noelaerhabdaceae and F. profunda ARs and MARs, the ratio of small to large Noelaerhabdaceae coccoliths shows no variance on precessional timescales, suggesting that factors such as temperature or evolutionary processes may be more important that productivity in controlling this ratio. The lack of trends or rhythms in relative abundance of minor coccolith groups (Helicosphaera, Umbilicosphaera, S. pulchra) suggests that they are relatively unaffected by the salinity and nutrient changes that they witnessed. F. profunda shows significant variance on glacial–interglacial (100 kyr) and precessional (19–23 kyr) timescales in its AR and MAR; however, its relative abundance remains quite constant over the study interval, suggesting that the commonly used percent F. profunda proxy cannot be applied to reconstruct primary productivity in this part of the BoB. This could be related to the unique water column structure in the northern BoB (with a thick barrier layer below the mixed layer) or to high suspended particle concentrations affecting light penetration. Further studies are needed to understand this observation.
The datasets from core MD12-3412 supporting this study are publicly available on the SEANOE data repository. Nannofossil assemblage, coccolith AR, and coccolith MARs are archived at https://doi.org/10.17882/106967 (Srivastava et al., 2025). Globigerinoides ruber oxygen isotope data are archived at https://doi.org/10.17882/109119 (Bassinot et al., 2025).
Coccolith microscope slides are archived on the MANTA platform at CEREGE, Aix-en-Provence, France. Coarse-fraction foraminiferal samples are archived at LSCE, Gif-sur-Yvette, France. Core sections of MD12-3412 are archived at the Muséum national d'Histoire naturelle, Paris, France.
The supplement related to this article is available online at https://doi.org/10.5194/jm-44-555-2025-supplement.
LB and FB obtained sample material during the MONOPOL cruise. FB contributed stable isotope data and provided input on the revised age model. MS imaged and analyzed the samples at CEREGE with assistance from LB and CTB. MS performed calculations and analyzed the data under the supervision of CTB. MS and CTB drafted the initial version of the article. All co-authors provided feedback on the draft. CTB and MS acquired funding. KH supervised MS.
The contact author has declared that none of the authors has any competing interests.
Publisher’s note: Copernicus Publications remains neutral with regard to jurisdictional claims made in the text, published maps, institutional affiliations, or any other geographical representation in this paper. While Copernicus Publications makes every effort to include appropriate place names, the final responsibility lies with the authors. Views expressed in the text are those of the authors and do not necessarily reflect the views of the publisher.
We acknowledge the Charles University Grant Agency (project no. 123624) for providing funding that supported MS's extended research visit to CEREGE. We acknowledge the Flotte Océanographique Française for recovery and access to the Marion-Dufresne core samples used in this study. CTB thanks IODP France and ANR for funding. We thank Alexander Nistor (CEREGE) for assistance with YOLO.
This research has been supported by the Grantová Agentura, Univerzita Karlova (grant no. 123624).
This paper was edited by Francesca Sangiorgi and Emanuela Mattioli and reviewed by Jose-Abel Flores and Mariem Saavedra-Pellitero.
Ahagon, N., Tanaka, Y., and Ujiié, H.: Florisphaera profunda, a possible nannoplankton indicator of late Quaternary changes in sea-water turbidity at the northwestern margin of the Pacific, Marine Micropaleontology, 22, 255–273, https://doi.org/10.1016/0377-8398(93)90047-2, 1993.
Ahn, S., Khider, D., Lisiecki, L. E., and Lawrence, C. E.: A probabilistic Pliocene–Pleistocene stack of benthic δ18O using a profile hidden Markov model, Dynamics and Statistics of the Climate System, 2, https://doi.org/10.1093/climsys/dzx002, 2017.
Banerjee, B., Raza, W., Ahmad, S. M., Farnaaz, S., Babu, E., Shukla, N., Mascarenhas-Pereira, M. B. L., and Mallick, M.: A 70 kyr Record of Monsoon-induced Marine Productivity Changes, Terrigenous Flux and Weathering Variations in the Southern Bay of Bengal, Jour. Geol. Soc. India, 100, 47–55, https://doi.org/10.17491/jgsi/2024/172982, 2024.
Bassinot, F., Bolton, C., Srivastava, M., Beaufort, L., and Holcová, K.: Globigerinoides ruber oxygen isotope data for the northern Bay of Bengal core MD12-3412, SEANOE [data set], https://doi.org/10.17882/109119, 2025.
Baumann, K.-H., Andruleit, H., Böckel, B., Geisen, M., and Kinkel, H.: The significance of extant coccolithophores as indicators of ocean water masses, surface water temperature, and palaeoproductivity: a review, Paläontol. Z., 79, 93–112, https://doi.org/10.1007/BF03021756, 2005.
Beaufort, L. and Dollfus, D.: Automatic recognition of coccoliths by dynamical neural networks, Marine Micropaleontology, 51, 57–73, https://doi.org/10.1016/j.marmicro.2003.09.003, 2004.
Beaufort, L., Bassinot, F., and Vincent, E.: Primary Production Response to Orbitally Induced Variations of the Southern Oscillation in the Equatorial Indian Ocean, in: Reconstructing Ocean History, edited by: Abrantes, F. and Mix, A. C., Springer US, Boston, MA, 245–271, https://doi.org/10.1007/978-1-4615-4197-4_15, 1999.
Beaufort, L., Barbarin, N., and Gally, Y.: Optical measurements to determine the thickness of calcite crystals and the mass of thin carbonate particles such as coccoliths, Nature protocols, 9, 633–642, 2014.
Beaufort, L., Gally, Y., Suchéras-Marx, B., Ferrand, P., and Duboisset, J.: Technical note: A universal method for measuring the thickness of microscopic calcite crystals, based on bidirectional circular polarization, Biogeosciences, 18, 775–785, https://doi.org/10.5194/bg-18-775-2021, 2021.
Beaufort, L., Bolton, C. T., Sarr, A.-C., Suchéras-Marx, B., Rosenthal, Y., Donnadieu, Y., Barbarin, N., Bova, S., Cornuault, P., Gally, Y., Gray, E., Mazur, J.-C., and Tetard, M.: Cyclic evolution of phytoplankton forced by changes in tropical seasonality, Nature, 601, 79–84, https://doi.org/10.1038/s41586-021-04195-7, 2022.
Bhaumik, A. K., Chaudhuri, S., Kumar, S., Mohanty, S., Roy, L., Ghosh, A. K., Chowdhury, S., and Behara, T.: Biostratigraphy and sedimentation rate estimation of Quaternary sediments of the Krishna-Godavari Basin, Bay of Bengal: Evidence from NGHP-01 Holes 10D, 5C and 3B, Micropaleontology, 70, 239, https://doi.org/10.47894/mpal.70.3.03, 2024.
Bolton, C. T. and Stoll, H. M.: Coccoliths as Recorders of Paleoceanography and Paleoclimate over the Past 66 Million Years, Annual Review of Earth and Planetary Sciences, 53, 169–194, https://doi.org/10.1146/annurev-earth-040623-103211, 2025.
Bolton, C. T., Chang, L., Clemens, S. C., Kodama, K., Ikehara, M., Medina-Elizalde, M., Paterson, G. A., Roberts, A. P., Rohling, E. J., Yamamoto, Y., and Zhao, X.: A 500,000 year record of Indian summer monsoon dynamics recorded by eastern equatorial Indian Ocean upper water-column structure, Quaternary Science Reviews, 77, 167–180, https://doi.org/10.1016/j.quascirev.2013.07.031, 2013.
Bolton, C. T., Thant, P. W., Philips, S. C., Beaufort, L., and Thirumalai, K.: Last glacial to Holocene sedimentation patterns and coccolithophore dynamics in the northwestern Bay of Bengal in response to South Asian monsoon strengthening, J. Nannoplankton Res., 42, 27–27, https://doi.org/10.58998/3210, 2024.
Caley, T., Malaizé, B., Zaragosi, S., Rossignol, L., Bourget, J., Eynaud, F., Martinez, P., Giraudeau, J., Charlier, K., and Ellouz-Zimmermann, N.: New Arabian Sea records help decipher orbital timing of Indo-Asian monsoon, Earth and Planetary Science Letters, 308, 433–444, https://doi.org/10.1016/j.epsl.2011.06.019, 2011.
Chakraborty, A., Ghosh, A. K., and Saxena, S.: Neogene calcareous nannofossil biostratigraphy of the northern Indian Ocean: Implications for palaeoceanography and palaeoecology, Palaeogeography, Palaeoclimatology, Palaeoecology, 579, 110583, https://doi.org/10.1016/j.palaeo.2021.110583, 2021.
Cheng, H., Li, H., Sha, L., Sinha, A., Shi, Z., Yin, Q., Lu, Z., Zhao, D., Cai, Y., Hu, Y., Hao, Q., Tian, J., Kathayat, G., Dong, X., Zhao, J., and Zhang, H.: Milankovitch theory and monsoon, The Innovation, 3, 100338, https://doi.org/10.1016/j.xinn.2022.100338, 2022.
Clemens, S. C., Kuhnt, W., LeVay, L. J., and the Expedition 353 Scientists: Indian Monsoon Rainfall, Proceedings of the International Ocean Discovery Program, 353: College Station, TX (International Ocean Discovery Program), 2016.
Clemens, S. C., Yamamoto, M., Thirumalai, K., Giosan, L., Richey, J. N., Nilsson-Kerr, K., Rosenthal, Y., Anand, P., and McGrath, S. M.: Remote and local drivers of Pleistocene South Asian summer monsoon precipitation: A test for future predictions, Sci. Adv., 7, eabg3848, https://doi.org/10.1126/sciadv.abg3848, 2021.
Curray, J. R., Emmel, F. J., and Moore, D. G.: The Bengal Fan: morphology, geometry, stratigraphy, history and processes, Marine and Petroleum Geology, 19, 1191–1223, https://doi.org/10.1016/S0264-8172(03)00035-7, 2002.
Currie, J. C., Lengaigne, M., Vialard, J., Kaplan, D. M., Aumont, O., Naqvi, S. W. A., and Maury, O.: Indian Ocean Dipole and El Niño/Southern Oscillation impacts on regional chlorophyll anomalies in the Indian Ocean, Biogeosciences, 10, 6677–6698, https://doi.org/10.5194/bg-10-6677-2013, 2013.
Da Silva, R., Mazumdar, A., Mapder, T., Peketi, A., Joshi, R. K., Shaji, A., Mahalakshmi, P., Sawant, B., Naik, B. G., Carvalho, M. A., and Molletti, S. K.: Salinity stratification controlled productivity variation over 300 ky in the Bay of Bengal, Sci. Rep., 7, 14439, https://doi.org/10.1038/s41598-017-14781-3, 2017.
Dollfus, D. and Beaufort, L.: Fat neural network for recognition of position-normalised objects, Neural Networks, 12, 553–560, https://doi.org/10.1016/S0893-6080(99)00011-8, 1999.
Fauquembergue, K., Fournier, L., Zaragosi, S., Bassinot, F., Kissel, C., Malaizé, B., Caley, T., Moreno, E., and Bachelery, P.: Factors controlling frequency of turbidites in the Bengal fan during the last 248 kyr cal BP: Clues from a presently inactive channel, Marine Geology, 415, 105965, https://doi.org/10.1016/j.margeo.2019.105965, 2019.
Flores, J. A., Sierro, F. J., and Raffi, I. (Eds.): Proceedings of the Ocean Drilling Program, 138 Scientific Results, Ocean Drilling Program, https://doi.org/10.2973/odp.proc.sr.138.1995, 1995.
Flores, J. A., Johnson, J. E., Mejía-Molina, A. E., Álvarez, M. C., Sierro, F. J., Singh, S. D., Mahanti, S., and Giosan, L.: Sedimentation rates from calcareous nannofossil and planktonic foraminifera biostratigraphy in the Andaman Sea, northern Bay of Bengal, and eastern Arabian Sea, Marine and Petroleum Geology, 58, 425–437, https://doi.org/10.1016/j.marpetgeo.2014.08.011, 2014.
Gauns, M., Madhupratap, M., Ramaiah, N., Jyothibabu, R., Fernandes, V., Paul, J. T., and Prasanna Kumar, S.: Comparative accounts of biological productivity characteristics and estimates of carbon fluxes in the Arabian Sea and the Bay of Bengal, Deep Sea Research Part II: Topical Studies in Oceanography, 52, 2003–2017, https://doi.org/10.1016/j.dsr2.2005.05.009, 2005.
Giraudeau, J. and Beaufort, L.: Chapter ten coccolithophores: from extant populations to fossil assemblages, Developments in Marine Geology, 1, 409–439, 2007.
Gomes, H. R., Goes, J. I., and Saino, T.: Influence of physical processes and freshwater discharge on the seasonality of phytoplankton regime in the Bay of Bengal, Continental Shelf Research, 20, 313–330, https://doi.org/10.1016/S0278-4343(99)00072-2, 2000.
Hagino, K. and Okada, H.: Floral Response of Coccolithophores to Progressive Oligotrophication in the South Equatorial Current, Pacific Ocean, 2004.
Haridas, N. V., Banerji, U. S., Maya, K., and Padmalal, D.: Paleoclimatic and paleoceanographic records from the Bay of Bengal sediments during the last 30 ka, Journal of Asian Earth Sciences, 229, 105169, https://doi.org/10.1016/j.jseaes.2022.105169, 2022.
Hernández-Almeida, I., Ausín, B., Saavedra-Pellitero, M., Baumann, K.-H., and Stoll, H. M.: Quantitative reconstruction of primary productivity in low latitudes during the last glacial maximum and the mid-to-late Holocene from a global Florisphaera profunda calibration dataset, Quaternary Science Reviews, 205, 166–181, https://doi.org/10.1016/j.quascirev.2018.12.016, 2019.
Joussain, R., Colin, C., Liu, Z., Meynadier, L., Fournier, L., Fauquembergue, K., Zaragosi, S., Schmidt, F., Rojas, V., and Bassinot, F.: Climatic control of sediment transport from the Himalayas to the proximal NE Bengal Fan during the last glacial-interglacial cycle, Quaternary Science Reviews, 148, 1–16, https://doi.org/10.1016/j.quascirev.2016.06.016, 2016.
Koné, V., Aumont, O., Lévy, M., and Resplandy, L.: Physical and biogeochemical controls of the phytoplankton seasonal cycle in the Indian Ocean: A modeling study, in: Geophysical Monograph Series, vol. 185, edited by: Wiggert, J. D., Hood, R. R., Naqvi, S. W. A., Brink, K. H., and Smith, S. L., American Geophysical Union, Washington, D. C., 147–166, https://doi.org/10.1029/2008GM000700, 2009.
Kuttippurath, J., Sunanda, N., Martin, M. V., and Chakraborty, K.: Tropical storms trigger phytoplankton blooms in the deserts of north Indian Ocean, npj Clim. Atmos. Sci., 4, 11, https://doi.org/10.1038/s41612-021-00166-x, 2021.
Lee, J., Kim, S., and Khim, B.-K.: A paleoproductivity shift in the northwestern Bay of Bengal (IODP Site U1445) across the Mid-Pleistocene transition in response to weakening of the Indian summer monsoon, Palaeogeography, Palaeoclimatology, Palaeoecology, 560, 110018, https://doi.org/10.1016/j.palaeo.2020.110018, 2020.
Lévy, M., Shankar, D., André, J. -M., Shenoi, S. S. C., Durand, F., and De Boyer Montégut, C.: Basin-wide seasonal evolution of the Indian Ocean's phytoplankton blooms, J. Geophys. Res., 112, 2007JC004090, https://doi.org/10.1029/2007JC004090, 2007.
Li, M., Hinnov, L., and Kump, L.: Acycle: Time-series analysis software for paleoclimate research and education, Computers & Geosciences, 127, 12–22, https://doi.org/10.1016/j.cageo.2019.02.011, 2019.
Li, S., Zhu, J., Jin, X., Feng, Y., Jiao, N., and Zhang, W.: Multifaceted contribution of coccolithophores to ocean carbon export, Ocean-Land-Atmos Res, olar.0049, https://doi.org/10.34133/olar.0049, 2024.
Lisiecki, L. E. and Raymo, M. E.: A Pliocene-Pleistocene stack of 57 globally distributed benthic δ18O records, Paleoceanography, 20, 2004PA001071, https://doi.org/10.1029/2004PA001071, 2005.
Liu, H., Yun, M., Zhang, X., Zhang, G., Thangaraj, S., Huang, K., and Sun, J.: Biological Calcification Rate and Species-Specific Contributions of Coccolithophores to Total Calcite Inventory in the Eastern Indian Ocean, J. Geophys. Res.-Biogeosciences, 125, e2019JG005547, https://doi.org/10.1029/2019JG005547, 2020.
Longhurst, A. R.: Ecological Geography of the Sea, https://doi.org/10.1016/B978-0-12-455521-1.X5000-1, 2007.
Mark, D. F., Renne, P. R., Dymock, R. C., Smith, V. C., Simon, J. I., Morgan, L. E., Staff, R. A., Ellis, B. S., and Pearce, N. J. G.: High-precision 40Ar/39Ar dating of pleistocene tuffs and temporal anchoring of the Matuyama-Brunhes boundary, Quaternary Geochronology, 39, 1–23, https://doi.org/10.1016/j.quageo.2017.01.002, 2017.
Mergulhao, L. P., Guptha, M. V. S., Unger, D., and Murty, V. S. N.: Seasonality and variability of coccolithophore fluxes in response to diverse oceanographic regimes in the Bay of Bengal: Sediment trap results, Palaeogeography, Palaeoclimatology, Palaeoecology, 371, 119–135, https://doi.org/10.1016/j.palaeo.2012.12.024, 2013.
Mignot, J., De Boyer Montégut, C., Lazar, A., and Cravatte, S.: Control of salinity on the mixed layer depth in the world ocean: 2. Tropical areas, J. Geophys. Res., 112, 2006JC003954, https://doi.org/10.1029/2006JC003954, 2007.
Molfino, B. and McIntyre, A.: Precessional Forcing of Nutricline Dynamics in the Equatorial Atlantic, Science, 249, 766–769, https://doi.org/10.1126/science.249.4970.766, 1990.
Moreno, E., Caroir, F., Fournier, L., Fauquembergue, K., Zaragosi, S., Joussain, R., Colin, C., Blanc-Valleron, M.-M., Baudin, F., De Garidel-Thoron, T., Valet, J. P., and Bassinot, F.: Magnetic fabric of Bengal fan sediments: Holocene record of sedimentary processes and turbidite activity from the Ganges-Brahmaputra river system, Marine Geology, 430, 106347, https://doi.org/10.1016/j.margeo.2020.106347, 2020.
Okada, H. and Wells, P.: Late Quaternary nannofossil indicators of climate change in two deep-sea cores associated with the Leeuwin Current off Western Australia, Palaeogeography, Palaeoclimatology, Palaeoecology, 131, 413–432, https://doi.org/10.1016/S0031-0182(97)00014-X, 1997.
Palanisamy, A., Veeran, Y., Alagudurai, S., and Balasubramaniyan, M.: Increase in Paleoproductivity Driven by Strengthening of Indian Summer Monsoon During Past ∼ 14 kyrs: Evidenced by Biogenic Silica Accumulation Rates at Southeastern Arabian Sea, JCC, 10, 77–86, https://doi.org/10.3233/JCC240025, 2024.
Panmei, C., Naidu, P. D., and Naik, S. S.: Variability of terrigenous input to the Bay of Bengal for the last ∼ 80 kyr: Implications on the Indian monsoon variability, Geo.-Mar. Lett., 38, 341–350, https://doi.org/10.1007/s00367-018-0538-6, 2018.
Phillips, S. C., Johnson, J. E., Giosan, L., and Rose, K.: Monsoon-influenced variation in productivity and lithogenic sediment flux since 110 ka in the offshore Mahanadi Basin, northern Bay of Bengal, Marine and Petroleum Geology, 58, 502–525, https://doi.org/10.1016/j.marpetgeo.2014.05.007, 2014.
Poulton, A. J., Adey, T. R., Balch, W. M., and Holligan, P. M.: Relating coccolithophore calcification rates to phytoplankton community dynamics: Regional differences and implications for carbon export, Deep Sea Research Part II: Topical Studies in Oceanography, 54, 538–557, https://doi.org/10.1016/j.dsr2.2006.12.003, 2007.
Prasanna Kumar, S., Muraleedharan, P. M., Prasad, T. G., Gauns, M., Ramaiah, N., De Souza, S. N., Sardesai, S., and Madhupratap, M.: Why is the Bay of Bengal less productive during summer monsoon compared to the Arabian Sea?, Geophysical Research Letters, 29, https://doi.org/10.1029/2002GL016013, 2002.
Quinn, P. S., Cortés, M. Y., and Bollmann, J.: Morphological variation in the deep ocean-dwelling coccolithophore Florisphaera profunda (Haptophyta), European Journal of Phycology, 40, 123–133, https://doi.org/10.1080/09670260400024667, 2005.
Raffi, I., Backman, J., Fornaciari, E., Pälike, H., Rio, D., Lourens, L., and Hilgen, F.: A review of calcareous nannofossil astrobiochronology encompassing the past 25 million years?, Quaternary Science Reviews, 25, 3113–3137, https://doi.org/10.1016/j.quascirev.2006.07.007, 2006.
Ramaswamy, V. and Gaye, B.: Regional variations in the fluxes of foraminifera carbonate, coccolithophorid carbonate and biogenic opal in the northern Indian Ocean, Deep Sea Research Part I: Oceanographic Research Papers, 53, 271–293, https://doi.org/10.1016/j.dsr.2005.11.003, 2006.
Rickaby, R. E. M., Bard, E., Sonzogni, C., Rostek, F., Beaufort, L., Barker, S., Rees, G., and Schrag, D. P.: Coccolith chemistry reveals secular variations in the global ocean carbon cycle?, Earth and Planetary Science Letters, 253, 83–95, https://doi.org/10.1016/j.epsl.2006.10.016, 2007.
Rixen, T., Gaye, B., and Emeis, K.-C.: The monsoon, carbon fluxes, and the organic carbon pump in the northern Indian Ocean, Progress in Oceanography, 175, 24–39, https://doi.org/10.1016/j.pocean.2019.03.001, 2019.
Robinson, M. M., Bartol, M., Bolton, C. T., Ding, X., Gariboldi, K., and Romero, O. E.: Biostratigraphy summary, Proceedings of the International Ocean Discovery Program Expedition reports, 353, https://doi.org/10.14379/iodp.proc.353.109.2016, 2016.
Saavedra-Pellitero, M., Hernández-Almeida, I., Cabarcos, E., Baumann, K.-H., Dunkley Jones, T., Sierro, F. J., and Flores, J.-A.: Coupled Coccolith-Based Temperature and Productivity High-Resolution Reconstructions in the Eastern Equatorial Pacific During the Last Deglaciation and the Holocene, Front. Mar. Sci., 9, https://doi.org/10.3389/fmars.2022.865846, 2022.
Schott, F. A. and McCreary, J. P.: The monsoon circulation of the Indian Ocean, Progress in Oceanography, 51, 1–123, https://doi.org/10.1016/S0079-6611(01)00083-0, 2001.
Sett, S., Bach, L. T., Schulz, K. G., Koch-Klavsen, S., Lebrato, M., and Riebesell, U.: Temperature Modulates Coccolithophorid Sensitivity of Growth, Photosynthesis and Calcification to Increasing Seawater pCO2, PLoS ONE, 9, e88308, https://doi.org/10.1371/journal.pone.0088308, 2014.
Sijinkumar, A. V., Nath, B. N., Clemens, S., Gayathri, N. M., and Miriyala, P.: Late Quaternary record of Indian summer monsoon-induced stratification and productivity collapse in the Andaman Sea, J. Quaternary Science, 36, 298–310, https://doi.org/10.1002/jqs.3278, 2021.
Singh, A. D., Jung, S. J. A., Darling, K., Ganeshram, R., Ivanochko, T., and Kroon, D.: Productivity collapses in the Arabian Sea during glacial cold phases, Paleoceanography, 26, 2009PA001923, https://doi.org/10.1029/2009PA001923, 2011.
Srivastava, M., Bolton, C., Beaufort, L., Bassinot, F., and Holcová, K.: Coccolith abundance, MAR and morphology data from the core MD12-3412 in the Bay of Bengal, SEANOE [data set], https://doi.org/10.17882/106967, 2025.
Stoll, H. M., Arevalos, A., Burke, A., Ziveri, P., Mortyn, G., Shimizu, N., and Unger, D.: Seasonal cycles in biogenic production and export in Northern Bay of Bengal sediment traps, Deep Sea Research Part II: Topical Studies in Oceanography, 54, 558–580, https://doi.org/10.1016/j.dsr2.2007.01.002, 2007.
Su, X., Rong, X., Zhang, L., Luo, C., Liu, J., Wan, S., Li, Z., and Nilufar, Y. L.: Marine primary productivity evolution on the 90° E sea ridge of the northeastern Indian Ocean since the last glaciation: Insight from coccolith records, Journal of Tropical Oceanography, 1, https://www.jto.ac.cn/EN/10.11978/2024244 (last access: 12 June 2025), 2025.
Thadathil, P., Muraleedharan, P. M., Rao, R. R., Somayajulu, Y. K., Reddy, G. V., and Revichandran, C.: Observed seasonal variability of barrier layer in the Bay of Bengal, J. Geophys. Res., 112, 2006JC003651, https://doi.org/10.1029/2006JC003651, 2007.
Thirumalai, K., Clemens, S. C., Rosenthal, Y., Conde, S., Bu, K., Desprat, S., Erb, M., Vetter, L., Franks, M., Cheng, J., Li, L., Liu, Z., Zhou, L. P., Giosan, L., Singh, A., and Mishra, V.: Extreme Indian summer monsoon states stifled Bay of Bengal productivity across the last deglaciation, Nat. Geosci., 18, 443–449, https://doi.org/10.1038/s41561-025-01684-6, 2025.
Uddandam, P., Rai, J., Prasad, V., Joshi, H., and Nigam, R.: Holocene calcareous nannoplanktons from the western continental shelf of Bay of Bengal, Geophytology, 45, 00-00, ISSN 0376-5561, 2015
Vinayachandran, P. N., McCreary, J. P., Hood, R. R., and Kohler, K. E.: A numerical investigation of the phytoplankton bloom in the Bay of Bengal during Northeast Monsoon, J. Geophys. Res., 110, 2005JC002966, https://doi.org/10.1029/2005JC002966, 2005.
Wells, P. and Okada, H.: Holocene and Pleistocene glacial palaeoceanography off southeastern Australia, based on foraminifers and nannofossils in Vema cored hole V18–222*, Australian Journal of Earth Sciences, 43, 509–523, https://doi.org/10.1080/08120099608728273, 1996.
Young, J. R.: Neogene, in: Calcareous Nannofossil Biostratigraphy, edited by: Bown, P. R., Springer Netherlands, Dordrecht, 225–265, https://doi.org/10.1007/978-94-011-4902-0_8, 1998.
Zhisheng, A., Clemens, S. C., Shen, J., Qiang, X., Jin, Z., Sun, Y., Prell, W. L., Luo, J., Wang, S., Xu, H., Cai, Y., Zhou, W., Liu, X., Liu, W., Shi, Z., Yan, L., Xiao, X., Chang, H., Wu, F., Ai, L., and Lu, F.: Glacial-Interglacial Indian Summer Monsoon Dynamics, Science, 333, 719–723, https://doi.org/10.1126/science.1203752, 2011.
Zhou, X., Duchamp-Alphonse, S., Kageyama, M., Bassinot, F., Beaufort, L., and Colin, C.: Dynamics of primary productivity in the northeastern Bay of Bengal over the last 26 000 years, Clim. Past, 16, 1969–1986, https://doi.org/10.5194/cp-16-1969-2020, 2020.