the Creative Commons Attribution 4.0 License.
the Creative Commons Attribution 4.0 License.
 | 12 Dec 2025
Quantification of dissolution and diagenetic overgrowth in early Eocene calcareous nannofossils through circular polarised light microscopy
Alba Gonzalez-Lanchas
Kyra Bachmakova
Madalina Jaggi
Heather M. Stoll
Qualitative grading scales are often used to assess the preservation of sediments and biogenic carbonates such as calcareous nannofossils and foraminifera. However, such qualitative indices often conflate the process of dissolution and secondary diagenetic overgrowth, which have different consequences for the analysis of geochemical signals from the primary biogenic calcification environment. Therefore, direct indicators of carbonate microfossil preservation relevant to the geochemical signal are needed. In this study, we assess the morphology of discoasters and placolith-shaped calcareous nannofossil groups from early Eocene (54–50 Ma) sediments using circular polarised light techniques to quantify their thickness and shape factor (thickness for a given size) and assess if these parameters covary with the depositional environment, including carbonate content, palaeowater, and burial depth. We find that the median shape factor of the Discoaster multiradiatus group varies considerably among different sites, with a thicker D. multiradiatus group and a greater proportion of birefringent specimens with increasing sediment carbonate content. We interpret these trends as indicative of increasing secondary overgrowth on the discoasters in sediments of higher carbonate content. In contrast, placolith shape factors are not correlated to the carbonate content, but rather placolith thickness decreases with greater palaeowater depths across the selected settings. We infer that the thickness of Eocene placoliths is driven more by dissolution than overgrowth. We find that across the globally distributed sediment locations, the nannolith to placolith ratio is not a good indicator of dissolution intensity, and we suggest that the ratio of non-birefringent to birefringent D. multiradiatus groups may serve as a more effective proxy for assessing placolith overgrowth.
- Article
(15513 KB) - Full-text XML
-
Supplement
(638 KB) - BibTeX
- EndNote


The term preservation is often used to describe the carbonate fraction from ocean sediments through a qualitative “bad to excellent” or “0–3” scaling to assess its usefulness for geochemical analysis (Roth and Thierstein, 1972; Thierstein and Roth, 1991) and also to infer the reliability of assemblage-based palaeoenvironmental interpretations (Gibbs et al., 2004; Pige et al., 2023). Yet, these routine classifications may be limited by the different qualitative grading criteria between researchers, and their relevance for alteration of geochemical signals may differ due to the array of diagenetic processes and type of indices (Mattioli, 1997; Gibbs et al., 2004; Dedert et al., 2014; Pige et al., 2023). Both overgrowth and reprecipitation and dissolution processes lead to poor preservation and can affect the sediment at different stages of its depositional and diagenetic history but with contrasting impacts on geochemistry. Due to differing solubility of various biogenic carbonate types, some fractions of a biogenic carbonate or population of biogenic carbonate particles may experience preferential dissolution, while others may experience overgrowth. For example, in some species of foraminifera, dissolution reduces the Mg Ca ratio, but overgrowth by secondary carbonate may increase the Mg Ca ratio (Brown and Elderfield, 1996). For other biominerals with a more homogeneous composition, dissolution may have negligible effects on the measured chemistry, but overgrowth may have significant consequences (Stewart et al., 2004; Pearson and Burgess, 2008). Consequently, to assess the fidelity of carbonate geochemical records as indicators of the primary biomineral composition, it is important to develop clearer classifications beyond “poor preservation”, detailing if there is significant overgrowth or significant dissolution but not conflating the two processes in the classification.
Calcareous nannofossils are increasingly used for geochemical analysis, including trace elements, stable isotopes, and clumped isotopes (Rickaby et al., 2010; Claxton et al., 2022; Clark et al., 2025a). Previous studies indicate that the different crystal sizes may cause some specimens or groups to be more susceptible to overgrowth than others, for example discoasters overgrow earlier than placoliths (Adelseck et al., 1973; Young and Ziveri, 2000). Discoaster are a genus of calcitic nannoliths of unknown affinity and have distinct rosette or star-shaped rays. The different factors determining whether overgrowth has occurred are not yet fully understood. Empirically, in foraminifera, low carbonate content (% CaCO3) of the sediment is inferred to promote better preservation of primary calcite with less overgrowth present (Pearson and Burgess, 2008; Stassen et al., 2015).
In nannofossils, studies across different time intervals found that sediments deposited under greater bottom water saturation states and higher % CaCO3 featured more pronounced overgrowth on discoasters compared to sediments deposited during a more intense dissolution phase (Mattioli, 1997; Dedert et al., 2014; Viganò et al., 2023). Yet, burial depth and palaeowater depth can also play a role. At greater water depths, the deposition and preservation of carbonate are controlled by the lysocline and calcite compensation depth, which varies spatially and temporally, and significant dissolution can occur with very limited change in % CaCO3 if the non-carbonate particle flux is low (Zeebe and Tyrrell, 2019). Within the sediment, hydrothermal activity, such as elevated temperatures, can also induce placolith overgrowth (Su et al., 2000). Other pore water redox reactions, such as the formation of methane and phosphates induced by degradation of organic matter, can cause dissolution at low pH levels and low alkalinity and/or overgrowth at high pH, alkalinity, and carbonate saturation levels (Turchyn et al., 2021).
In this study, we apply circular polarised light techniques (Fuertes et al., 2014; González-Lemos et al., 2018) to quantify the thickness of discoasters and placolith specimens of early Eocene age and compare the thicknesses across sites of varying carbonate content and palaeowater and burial depths. As opposed to cross-polarised light, circular polarised light (cpl) allows for observation of calcareous nannofossils under a microscope without (pseudo-)extinction or differences in colour brightness, shape, and appearance at any orientation (Fuertes et al., 2014). Only calcite crystals with a c axis orientated at an angle to the polarisation direction are visible in this technique, i.e. all calcite crystal orientations except vertically oriented calcite crystals (V unit). We use this relatively new screening technique in combination with known microscopy techniques, i.e. non-polarised light and scanning electron microscopy, to quantitatively assess the thicknesses of both discoasters and placoliths. Specifically, we determine the full thickness of Isochrysidales placoliths (composed of radially oriented calcite crystals (R unit)), the thickness of R units of Coccolithaceae placoliths, and the thickness of radially oriented secondary calcite of discoasters. While evolutionary factors have been described as causing long-term changes to the primary thickness and shape factors of coccoliths (Bolton et al., 2016), studies using plankton tow or shallow sediment trap material are needed to assess potential drivers of the variation in the primary thickness and shape factors of modern coccoliths across surface ocean environmental gradients. Many studies to date have examined coccolith mass, which is a strong function of coccolith length (Young and Ziveri, 2000; Beaufort et al., 2007, 2021; Fuertes et al., 2014), yet it has not been resolved whether there are strong controls on the primary thickness of placoliths. Since discoasters have been extinct since the Pliocene, it is not possible to examine potential drivers of primary Discoaster thickness. The crystallographic orientation of their calcite crystals could serve as one indicator of primary vs. secondary calcite contributions to their thickness. Here, we focus on the observed variation in thickness in discoasters and placoliths, which may contain some component of variation in primary thickness (especially for placoliths), as well as variations due to secondary reduction in thickness by dissolution or increases in thickness through overgrowth. We consider the calcareous nannofossils from the shallow clay-rich setting at Bass River, New Jersey, USA, as a reference of excellent preservation due to the high sedimentation rate, low % CaCO3, and high clay contents (Stassen et al., 2015), with little secondary influence of thinning due to dissolution and thickening due to overgrowth. The effect of different palaeowater depths, burial depths, and depositional environments (i.e. % CaCO3) on the placolith and discoaster thicknesses can then be evaluated through comparison of different samples from a similar age. We identify whether there is a difference between the influences of the different depositional parameters on placolith and discoaster thicknesses, whether placolith or discoaster thicknesses can be used as a quantitative estimation of overgrowth, and whether they could hence provide a good preservation indicator of future geochemical studies using fine-size fractions.
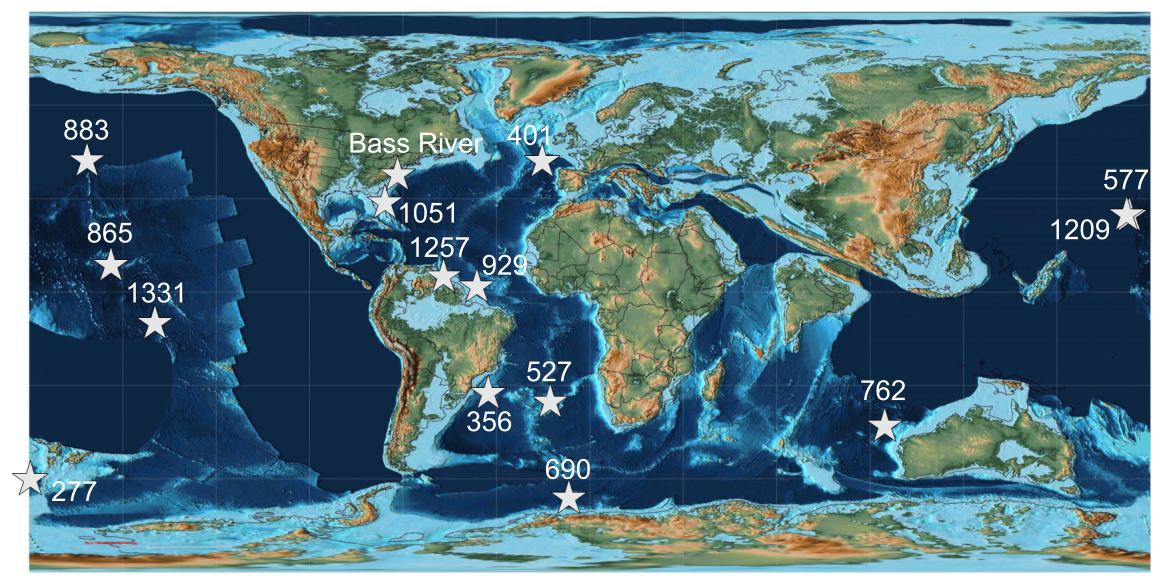
Figure 1Palaeogeographic map following Scotese (2016), showing the spatial distribution of the sites used in this study. Palaeolongitude and palaeolatitude reconstructed using the pyGplates Python package (Zahirovic et al., 2022; Mather et al., 2023).
2.1 Site selection and sample preparation
Fifteen different sites were selected from various cores from the Deep Sea Drilling Project (DSDP), Ocean Drilling Program (ODP), and International Ocean Discovery Program (IODP) from a range of different ocean basins and covering a range of carbonate contents and depths (Fig. 1; Supplement). Characterisation of group-specific thickness variability over time is not the goal of this study, and we focus on a limited time window, rather than evaluating temporal change. We selected samples from around the same time during the early Eocene Climatic Optimum (∼54–50 Ma) using existing age models and stratigraphy (Pak and Miller, 1995; Arney and Wise, 2003; Schneider et al., 2011; Shamrock et al., 2012; Kirtland Turner et al., 2014; Westerhold et al., 2018). Burial depths were taken as metres below sea floor (m b.s.f.) or metre composite depth (m c.d.), as provided by core repositories and shipboard reports, and palaeowater depth was approximated from previous studies (Kennett et al., 1975; Zachos and Arthur, 1986; Kennett and Stott, 1990; Siesser and Bralower, 1992; Widmark and Malmgren, 1992; Bralower et al., 1995; Pak and Miller, 1995; Paul et al., 2000; Takeda and Kaiho, 2007; D'haenens et al., 2012; Nomura et al., 2013; Arreguín-Rodríguez et al., 2018). A sample from the Bass River core, located ∼80 kyr after the Carbon Isotope Excursion of the PETM within biozone NP10a, was examined and considered a reference for “well-preserved”, clay-rich, and low-carbonate-content conditions (Stassen et al., 2015).
Smear slides were prepared in a manner similar to that of Flores and Sierro (1997). About 0.2 g of bulk sample material was disaggregated in 20 mL of buffer solution (500 mL Milli-Q, 0.075 g Na2CO3, 0.1 g NaHCO3) using a custom-built vertical wheel rotating at 60 rpm. The solution is carbonate saturated and should therefore not induce calcitic dissolution or overgrowth in the sample. Hereafter, an aliquot of 10–20 µL of disaggregated sample was pipetted into a small slide distributor containing buffer solution with gelatine (Gelatina Oro) and a small 12×12 mm coverslip. After settling overnight, the remaining buffer solution was removed using a paper towel, and the coverslip was dried on a hotplate and mounted onto a glass slide using Norland optical adhesive (NOA) 81.
The smear slides were analysed using a Zeiss Axiocam 506 colour camera coupled to a Zeiss AxioScope A.1 microscope with a Zeiss plan-apochromat 100x/1.4 oil circular polarised light objective at ETH Zürich. Between 20 and 40 fields of view were photographed to obtain images of at least 20 individual Discoaster specimens per sample, although this number was not achieved in several high-latitude sites (Fig. 5; Supplement). Placolith specimens were more abundant in sediments, with over 100 individual specimens per sample for most sites. Images were taken in cpl and non-polarised light to also quantify the number of discoasters detected only in non-polarised light relative to those detected in both polarised and non-polarised light. The same fields of view in both non-polarised light and cpl for eight different sites are shown in Fig. 2, with arrows highlighting the position of discoasters.
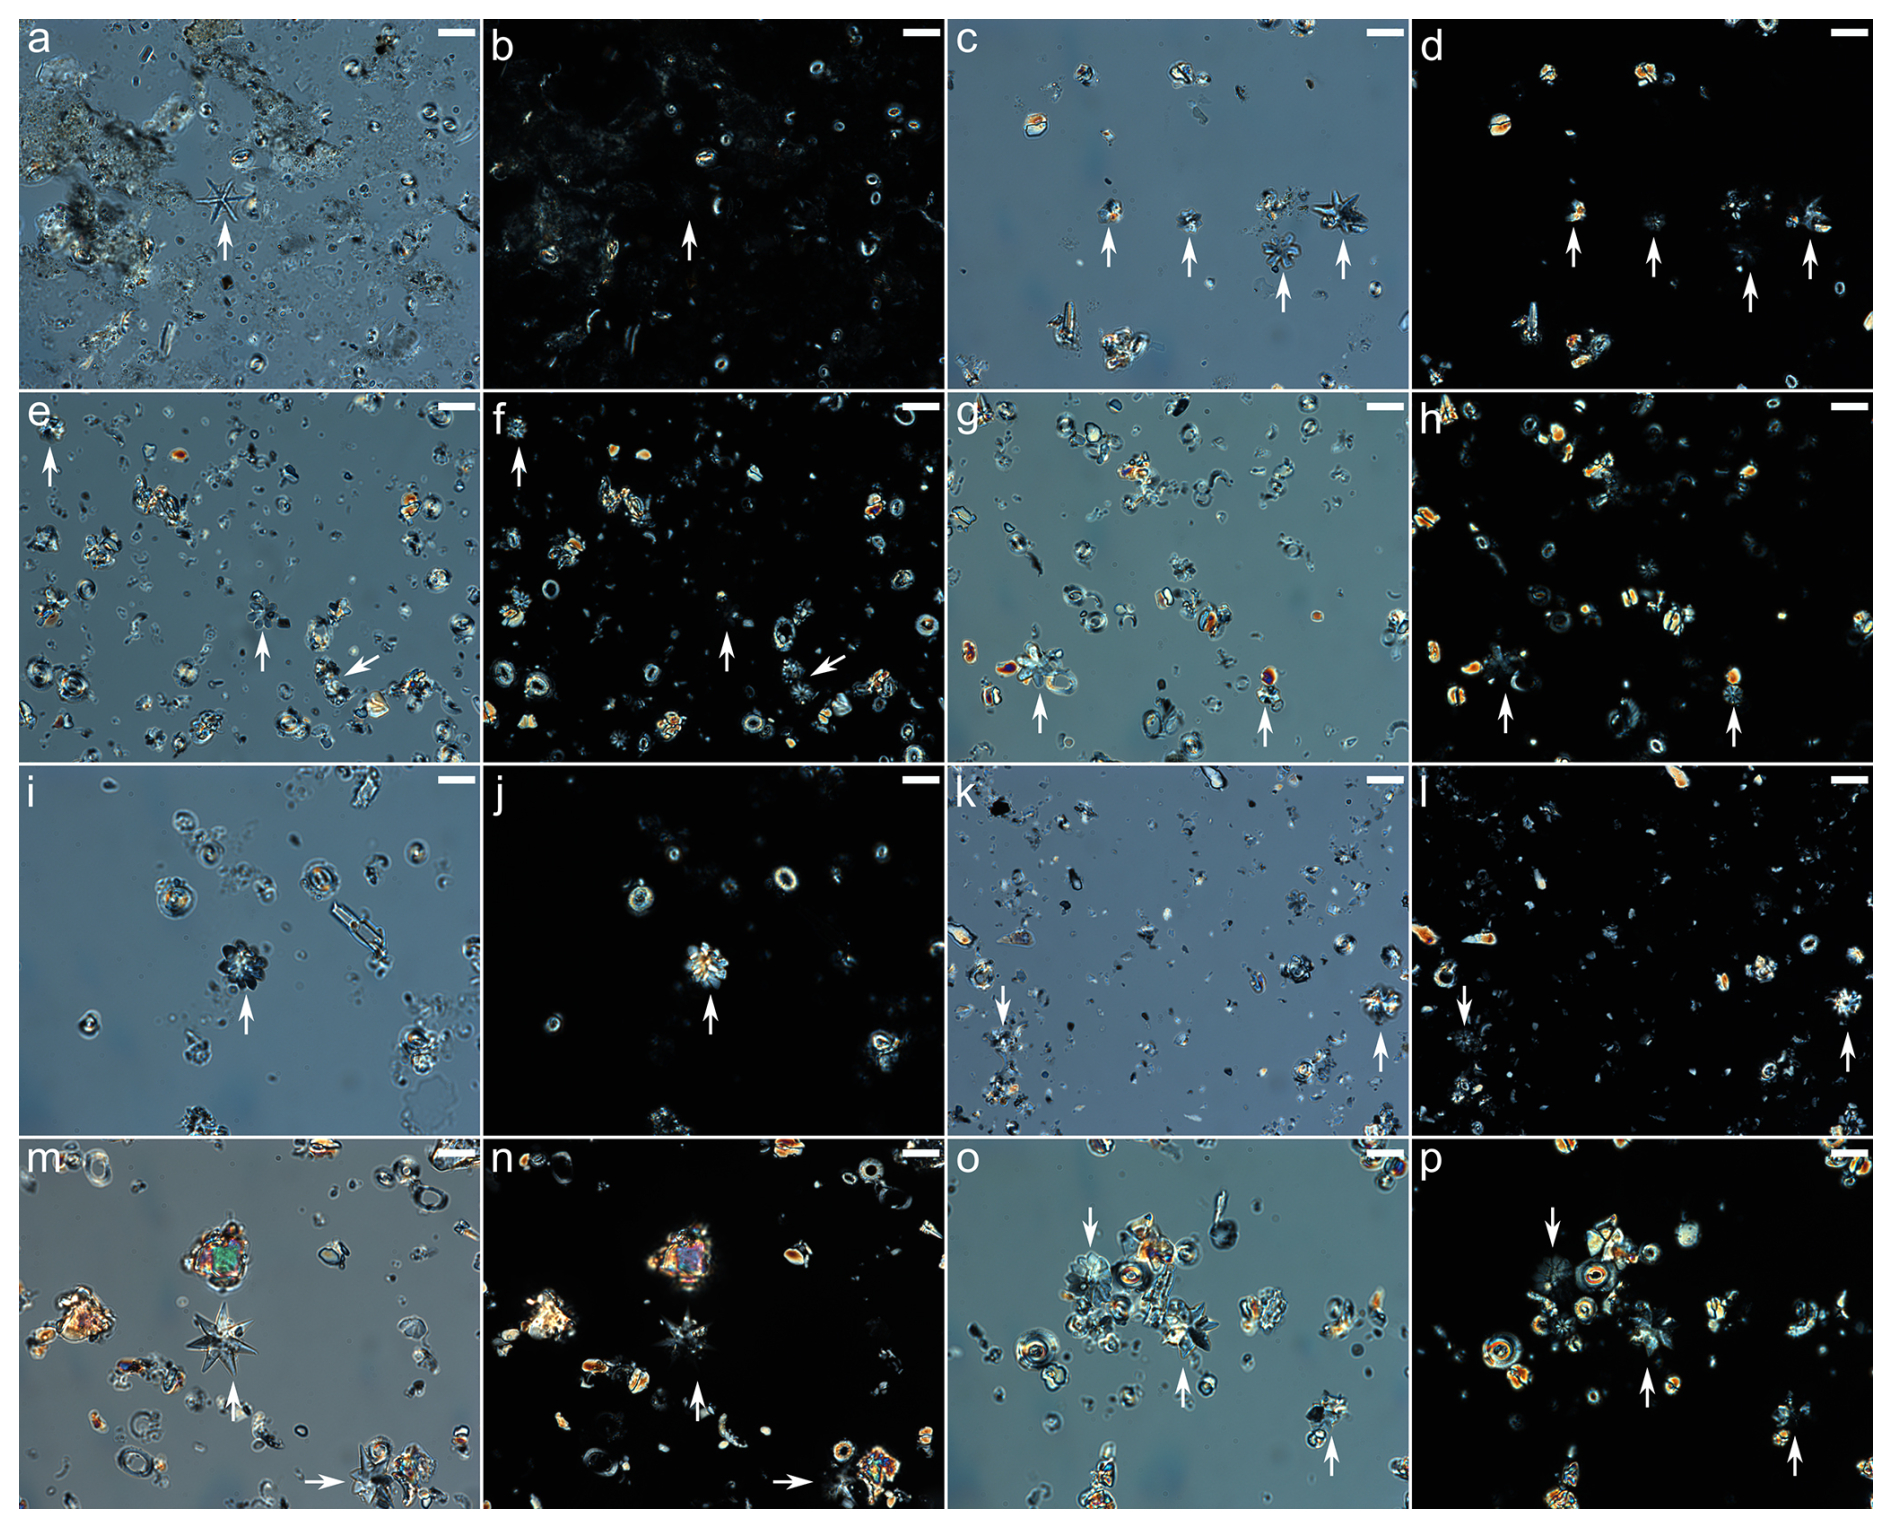
Figure 2Non-polarised (a, c, e, g, i, k, m, o) and circular polarised (b, d, f, h, j, l, n, p) light images. The same discoasters are highlighted with a white arrow on both non-polarised and circular polarised images. Discoasters visible under non-polarised light but not visible under circular polarised light are considered not overgrown (i.e. a–d). Discoasters visible under both are considered overgrown (i.e. i, j, m–p). The samples are from Bass River (a, b), site 401 (c, d), site 277 (e, f), site 527 (g, h), site 1257 (i, j), site 883 (k, l), site 577 (m, n), and site 762 (o, p). The scale bar is 10 µm.
All samples were also imaged using a JSM-7100F JEOL scanning electron microscope (SEM) at ScopeM, ETH Zürich. A total of 50–100 µg of material was filtered onto a 0.2 µm PEP filter and mounted onto an SEM stub. The stubs were coated with 4 nm of Pt–Pd and then imaged. Discoasters with various stages of preservation are seen in Fig. 3, and placoliths for every site are shown in the Appendix (Figs. A1–A3).
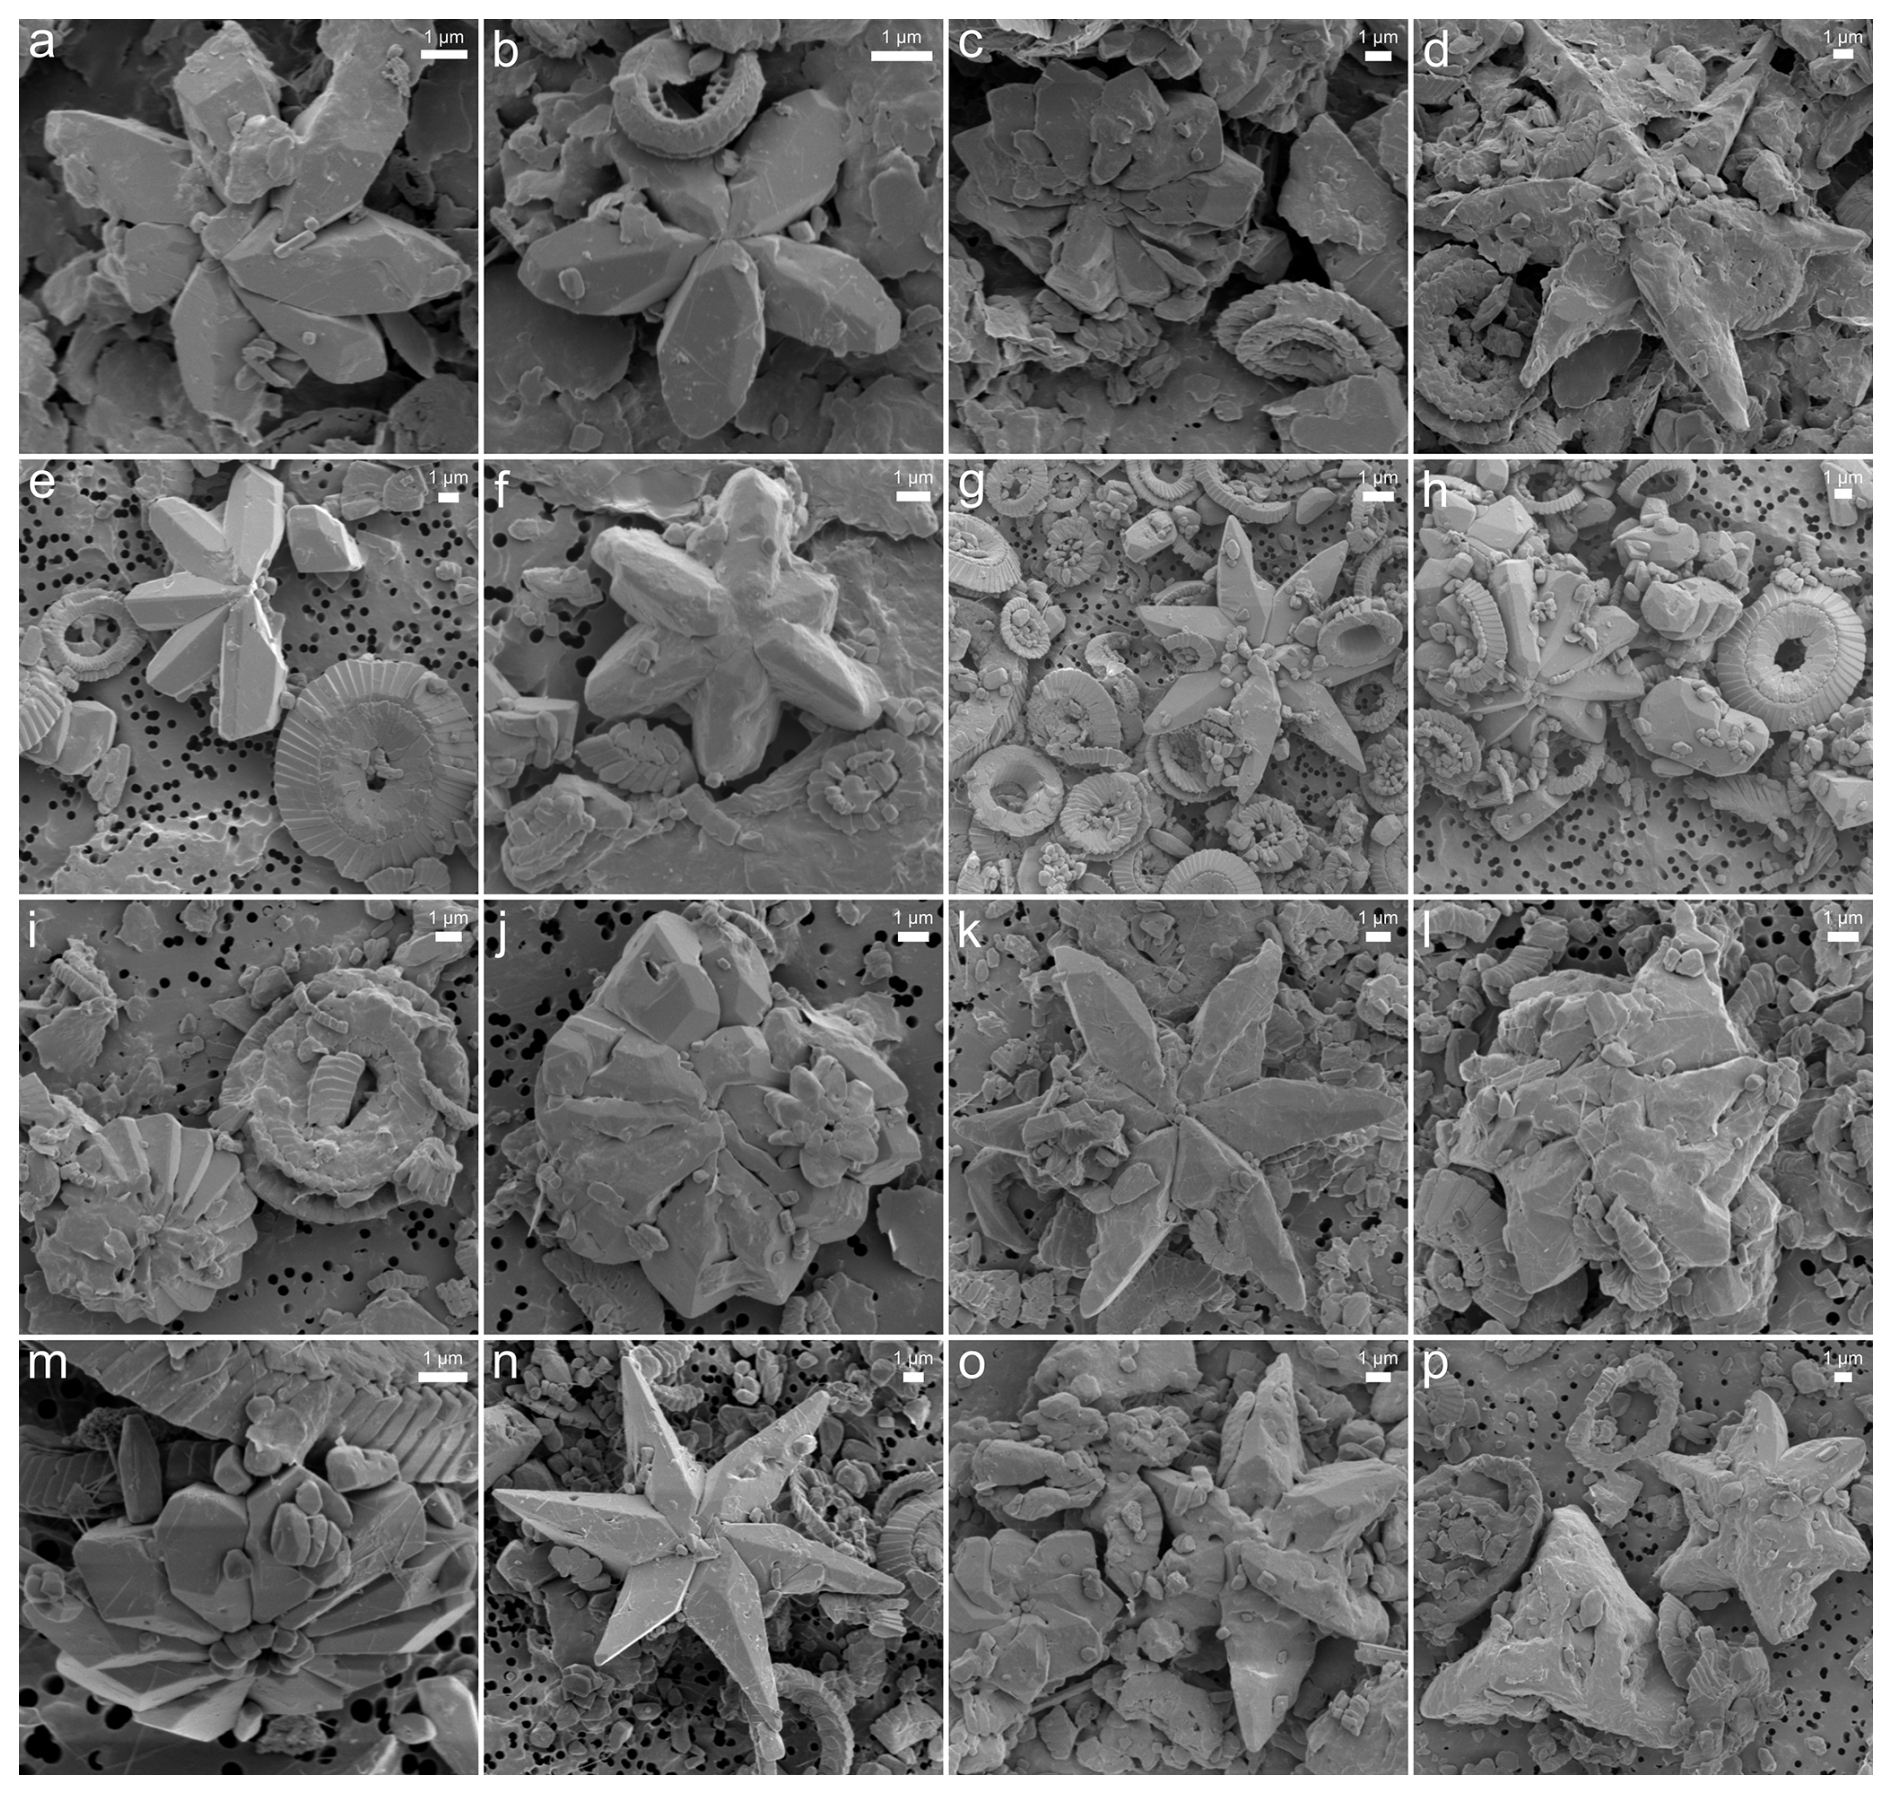
Figure 3SEM images showing varying degrees of discoaster preservation. Panels (a, b, d–g, k, n–p) show the D. lodoensis group, and (c, h–j, l, m) show the D. multiradiatus group. Panels (b, e, g–i, k, m, n) show little to no discoaster overgrowth, and (a, c, d, f, j, l, o, p) show discoaster overgrowth. The samples are from Bass River (a, b), site 401 (c, d), site 277 (e, f), site 527 (g, h), site 1257 (i, j), site 883 (k, l), site 577 (m, n), and site 762 (o, p). The scale bar is 1 µm.
2.2 Image processing
The sample images were processed to obtain quantitative calcareous nannofossil morphometric parameters using the MATLAB-based C-Calcita software (Fuertes et al., 2014). In combination with the MATLAB-based C-Calcita programme, the size, mass, and thickness of calcareous nannofossils can be quantified through calibration of visible interference colours with a reference wedge of known thickness (González-Lemos et al., 2018). During every imaging session, a reference image was taken of an Iceland calcite spar with known thickness, which allows the software to assign thickness values per pixel based on the respective interference colours of the sample image in RGB values. The resolution was taken as 1 pixel per 0.045 µm. The user then sets a minimum RGB thickness threshold, here 5 pixels (0.225 µm), with which the software detects and selects all values in the image above this threshold. Individual calcareous nannofossils are then imaged and isolated, with automatic parameter generation for each individual image whose thickness is above the threshold. Manual selection was also performed to isolate small or uncaptured calcareous nannofossils using the automatic software settings. Non-discoaster nannoliths and other fine detrital or authigenic material were manually removed from the selection and images.
While exact taxonomic identification is not the purpose of this study and we aim to apply this technique to all discoasters, we do not distinguish between discoasters on a species level. Instead, we follow the common informal grouping of Discoaster (Bown, 1999; Young et al., 2025) – the somewhat smaller, rosette-like D. multiradiatus group and the larger, star-like D. lodoensis group, here named Dm and Dl respectively. Discoasters consist of relatively large V-unit crystals, which are normally not visible under cross-polarised light. However, calcite overgrowth allows them to be visible, with more overgrowth resulting in higher interference colours. Thus, the discoasters we image here are directly indicative of their overgrowth. We compare the frequency of discoasters visible under non-polarised light and cpl as an additional index, hereafter described as the non-overgrown to overgrown discoaster ratio.
Placoliths were differentiated based on circular polarised light micrographs, following classic taxonomic descriptions (Bown, 1999; Young et al., 2025), and classified into two major groups: Isochrysidales and Coccolithaceae. The Isochrysidales group is predominantly composed of specimens assigned to the genus Toweius spp., generally circular in shape, and is predominantly composed of R-unit crystals. The Coccolithaceae group primarily includes specimens of Coccolithus and Chiasmolithus spp., both characterised by a high degree of ellipticity of placoliths, and consists of a combination of R- and V-crystal units. As such, we report thicknesses on Coccolithaceae that reflect the thickness of the shield with a dominance of R units but not the full calcite thickness. When group-level identification under circular polarisation was not possible, since certain key taxonomic features are only visible under crossed polarisers, a simplified criterion based on general shape (circular vs. elliptical) was applied to tentatively differentiate between Isochrysidales indet and Coccolithaceae indet. Other nannofossil specimens belonging to Zygodiscaceae and Helicosphaeraceae were also identified and grouped accordingly; however, their abundance in the samples was minor.
2.3 Shape factor
Because discoasters can vary greatly in size and thickness scales allometrically with size, even small changes in size can lead to significant differences in thickness. Therefore, the shape factor, or thickness for a given size, was used (Young and Ziveri, 2000). Since we assume circularity for discoasters (Bukry, 1971a), Eq. (1) defines the shape factor for circular objects (ks), as illustrated in Fig. 4a:
For placoliths, which are predominantly non-circular and more elliptical (Young and Ziveri, 2000), we use a shape factor for elliptical objects (kse), as illustrated in Fig. 4b. This gives a measure independent of circularity of the shape factor, following Eq. (2):
For ks, the maximum value is 1, which fills the whole cube (Fig. 4a). For kse, since placoliths encompass the upper half of the spheroid, the maximum value is 0.5 (Fig. 4b). In order to identify potential linear correlations and trends between two different parameters, Pearson correlation coefficients (ρ) are used and generated using the built-in data analysis plugin from Excel. Weak correlations are given here as , strong correlations are , and moderate correlations are between these two thresholds. Significance is given by a p value < 0.05. For all statistical comparisons, the median value and standard deviation for each site are used.
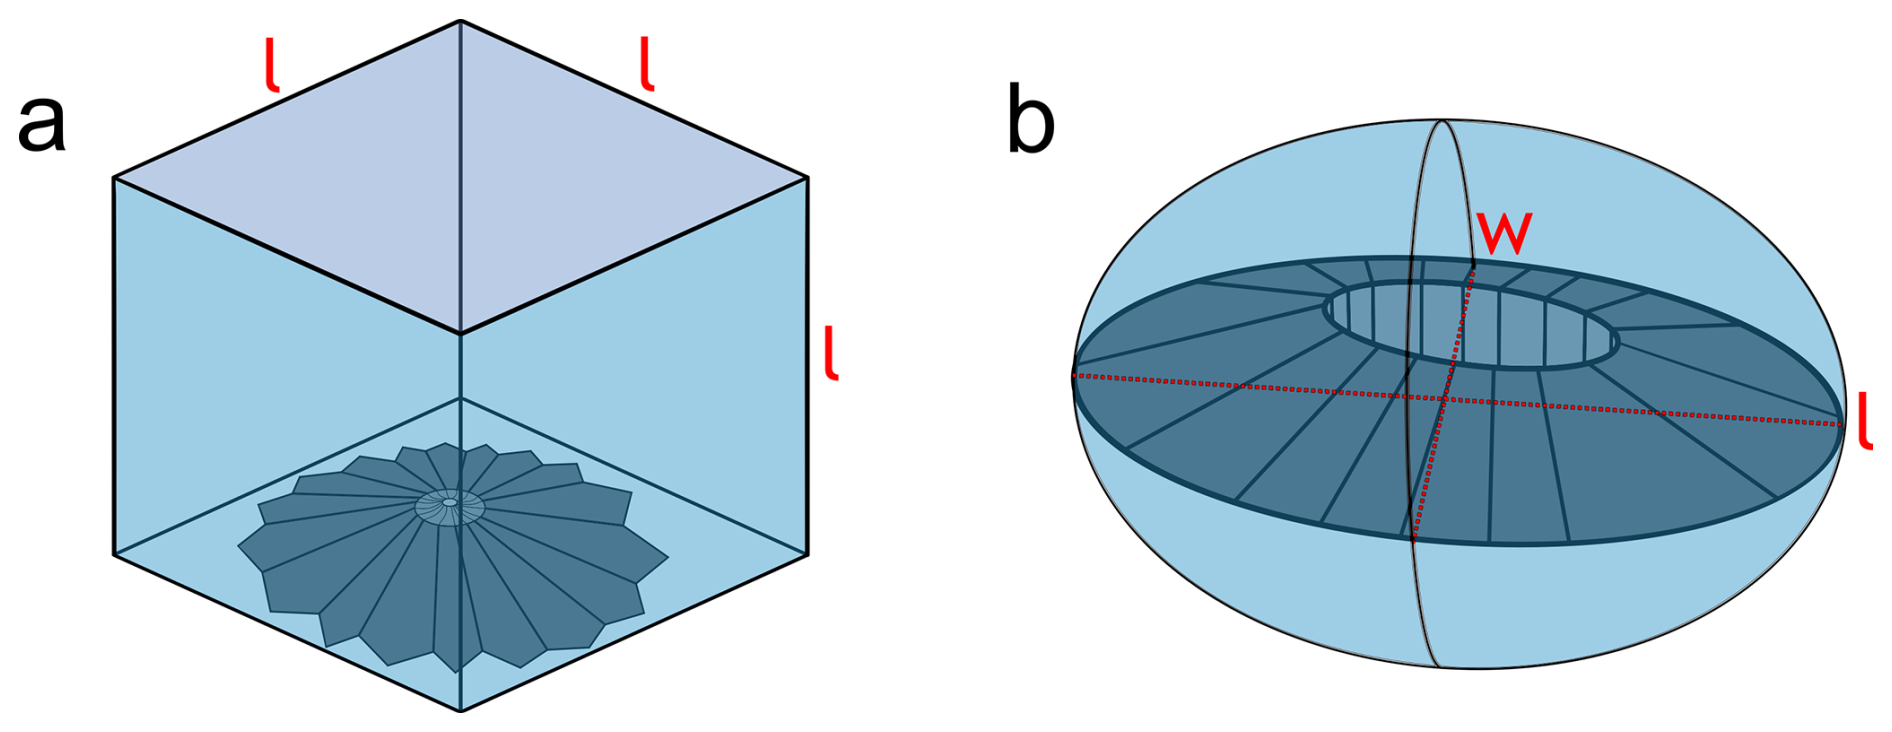
Figure 4Visual illustrations of the calculations for (a) ks for discoasters as the size filling a volume of equal sides with length l and (b) kse for placoliths as the size filling a spheroid of short axis w and long axis l.
2.4 Sedimentary % CaCO3 determination
To measure the % CaCO3 in the studied sediments, an aliquot of ∼800 µg of disaggregated sediment was acidified through reaction with 2 mL of 2 % HNO3 and centrifuged, and the supernatant was analysed on an Agilent 8800 QQQ–ICP–MS at ETH Zürich. To determine the sedimentary % CaCO3, a blank standard and three in-house standards with varying Ca concentrations were also measured and used for calibration. It was assumed that all measured calcium was derived from carbonate, and thus the % CaCO3 could be calculated, with a total range of 15 % to 100 % (Supplement).
3.1 Discoaster morphometrics
In total, 470 individual discoasters were imaged and processed across the entire sample set; morphometric parameters are shown in Fig. 5 and Table 1. For the Dm group, the lowest ks median values are recorded at site 356 and Bass River (0.014 and 0.026) and the highest values at sites 277 and 527 (0.052 and 0.051). Site 356 and Bass River also have the lowest spread/standard deviation (0.008 and 0.009 respectively), while the largest spread is from sites 527 and 1051A (0.024 and 0.029 respectively). For the Dl group, >10 specimens were counted in only three sites; as such, in Fig. 5 these are shown as violin plots, while the other sites are shown as median and standard deviation. These >10 specimen sites had ks values in the 0.03 to 0.05 range, and further statistics are not discussed for this group. Markedly, for the Dm group, there is a significant negative correlation between ks and length (, p<0.05); i.e. a longer length results in a lower ks. A greater spread/standard deviation in length does not cause a greater spread in ks for the Dm group (ρ=0.11, p=0.70; Fig. 5b). Overall, our imaged discoasters are slightly smaller than previously imaged Paleogene specimens from the same discoaster groups (Bukry, 1971a; Tremolada et al., 2008), potentially due to our imaging technique not fully capturing the entire discoaster.
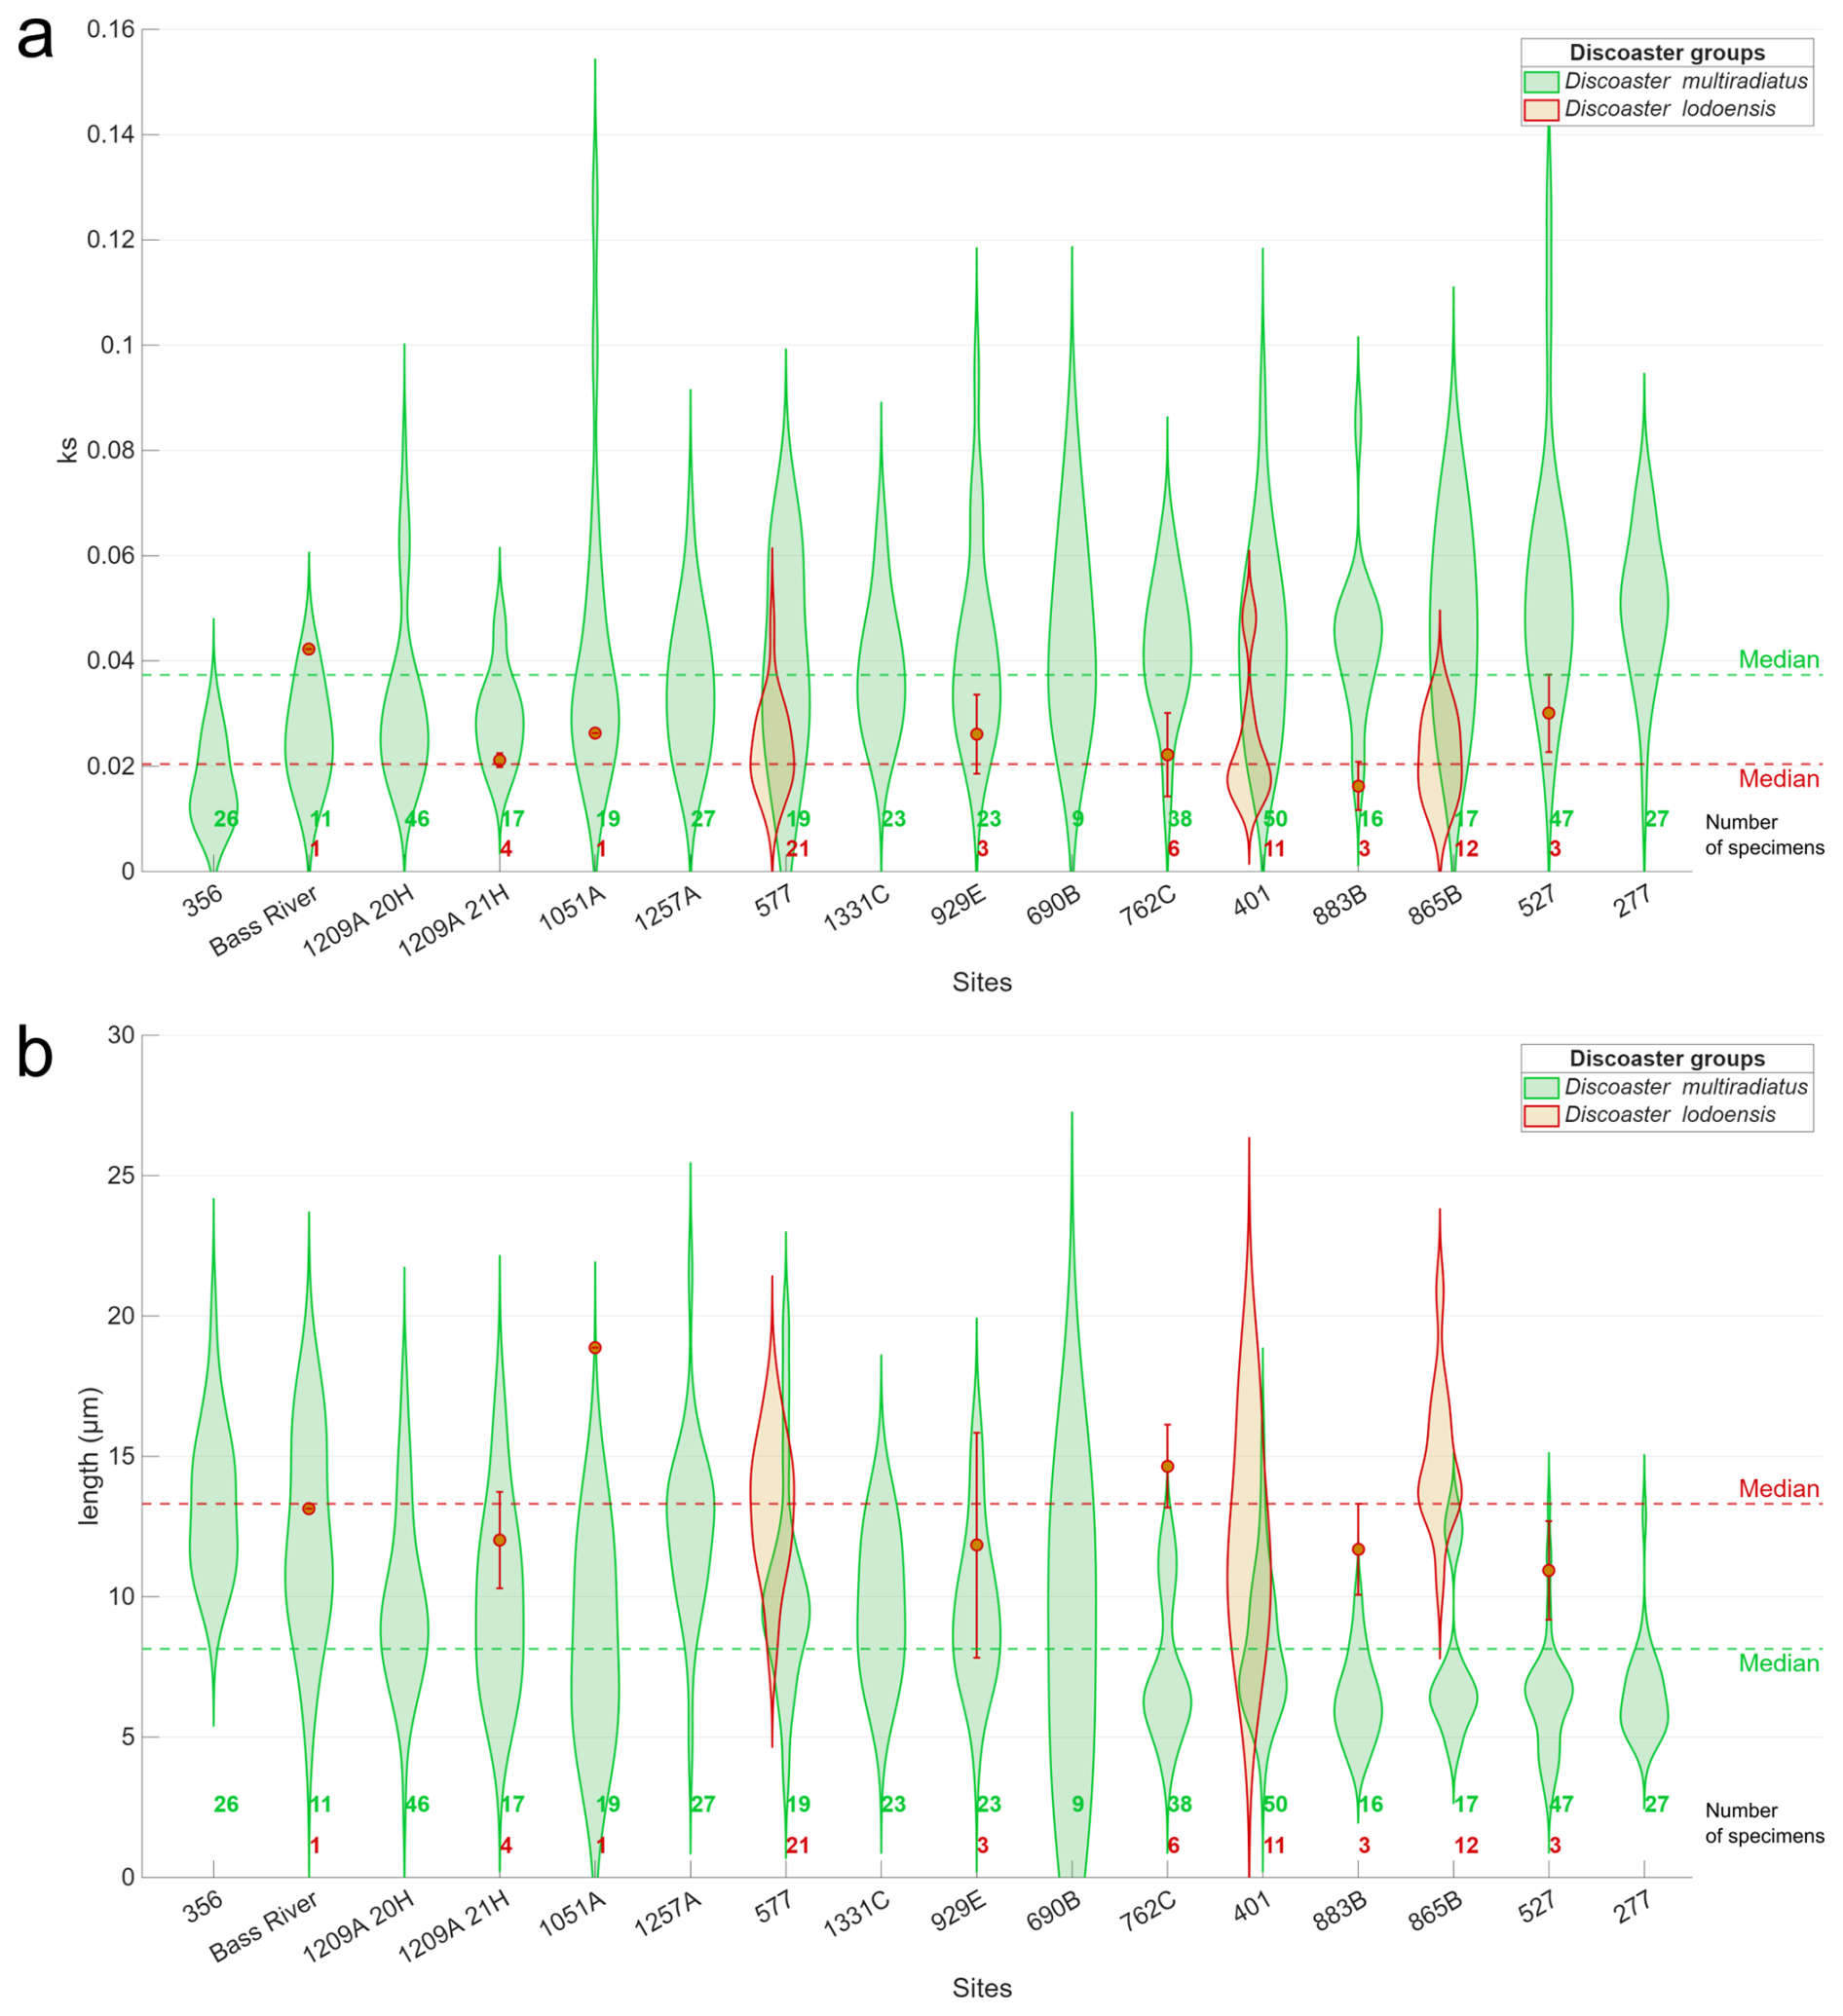
Figure 5Violin plots for every site showing (a) ks and (b) length in µm of the two discoaster groups; the sites are sorted by increasing Dm group ks. For the Dl group, only sites with >10 specimens were shown as a violin plot, while the other sites are shown as median and standard deviation. The Dm group has green shading, the Dl group has orange shading, and the number of specimens per site and discoaster group is shown at the bottom in the same colour scheme. The total median values for each discoaster group are given as dotted green and red lines.
Table 1Correlation table between three depositional environment parameters (% CaCO3, palaeowater depth, and burial depth) and the median and standard deviation of the discoaster ks, placolith kse, and discoaster and placolith lengths for each site. Only the D. multiradiatus group is shown due to a limited number of specimens for the D. lodoensis group. The placoliths are grouped into Isochrysidales and Coccolithaceae. Significant correlations are marked as bold.
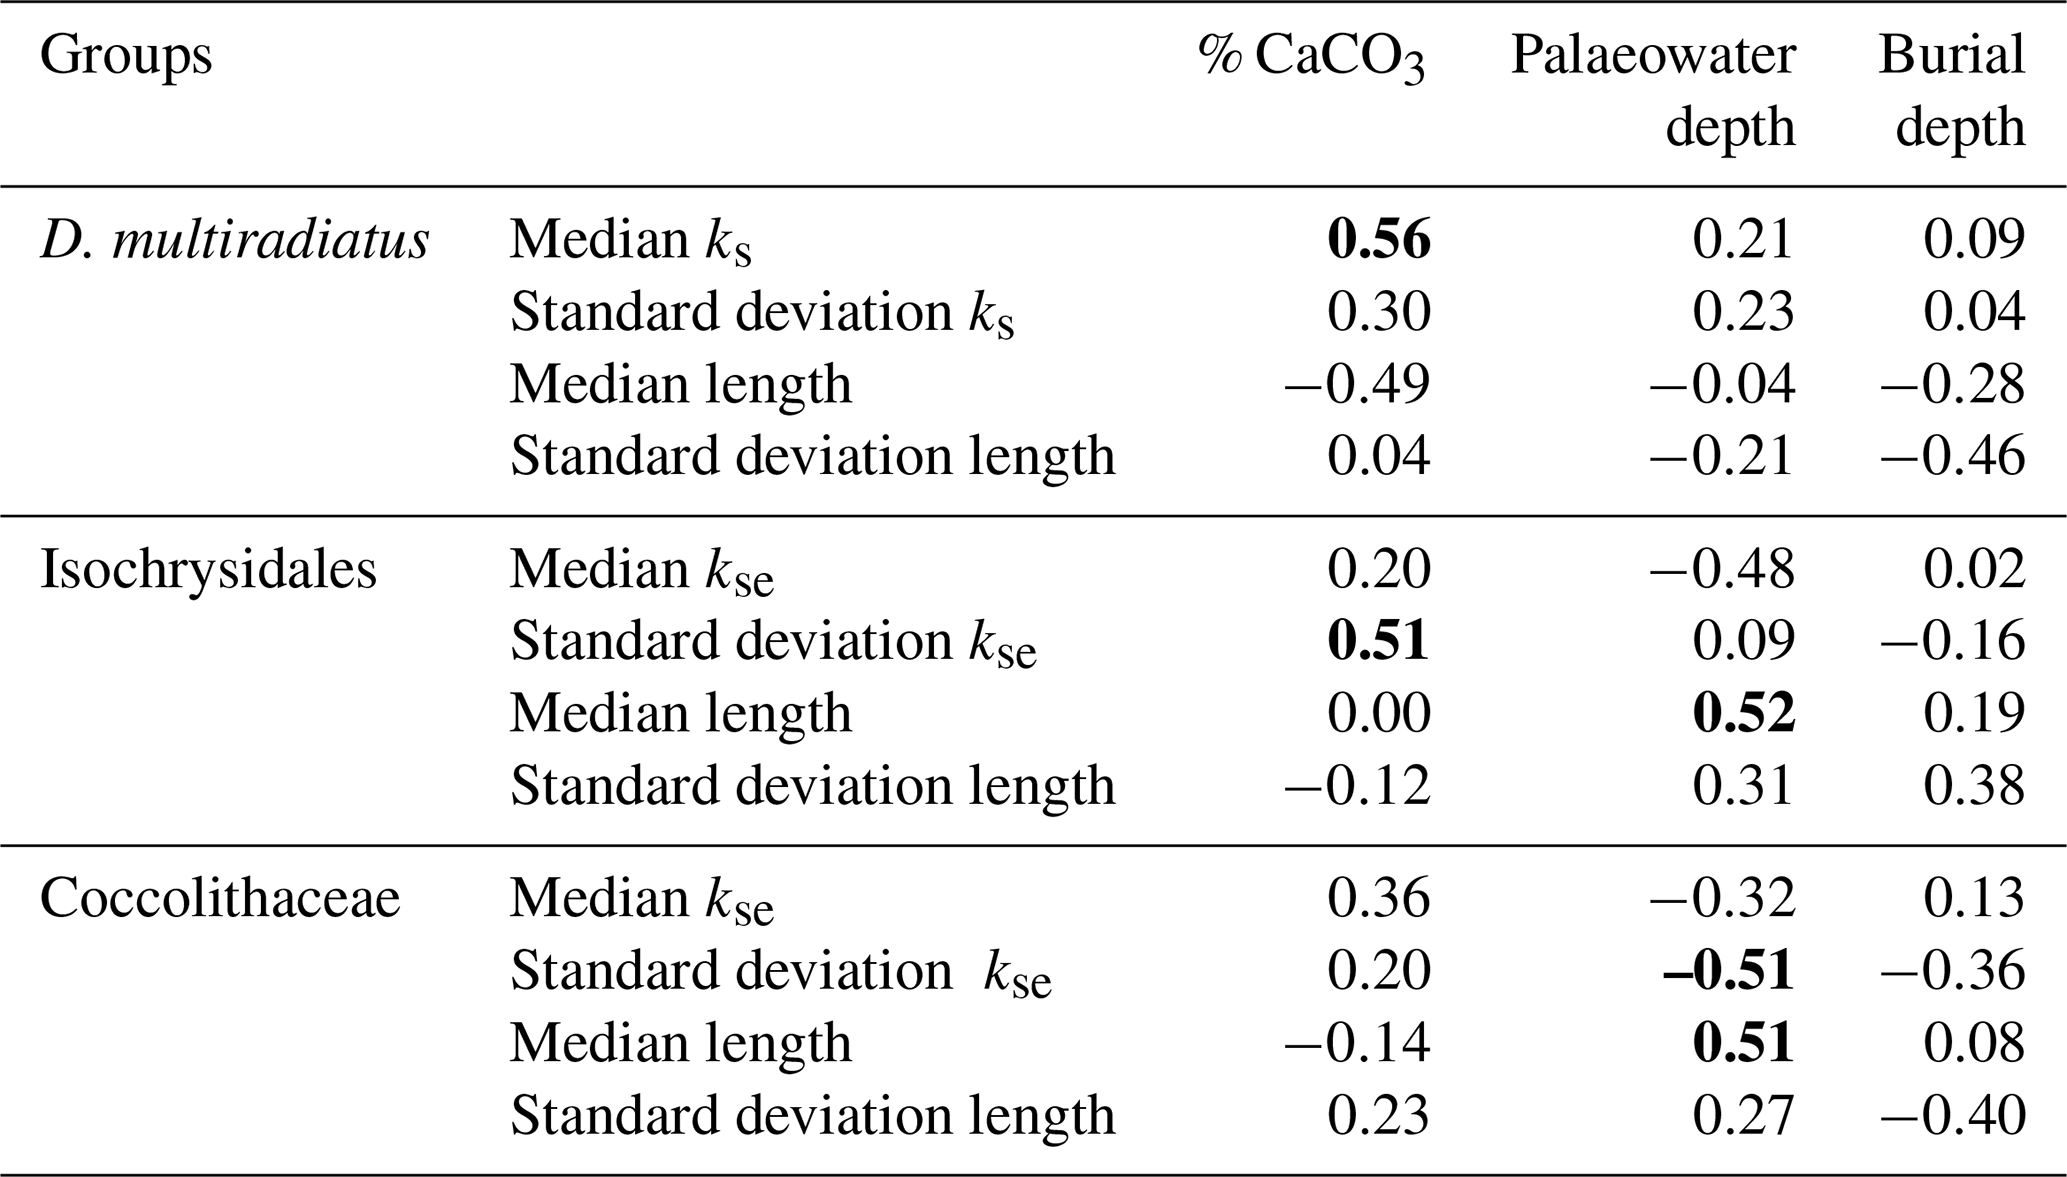
For the Dm group there is a significant positive correlation between ks and % CaCO3. Both palaeowater and burial depth have weak correlations with discoaster ks. The Dm group has a generally unimodal distribution for ks for all sites (Fig. 5a), and, except for sites 762C, 865B, and 527, which have a bimodal or skewed distribution, the same holds for the length (Fig. 5b). The median length has a moderate negative correlation with % CaCO3, and the standard deviation of the length has a similar moderate negative correlation with the burial depth (Table 1).
3.2 Placolith morphometrics
In total, 2480 individual placoliths were imaged and processed, of which 1347 were identified as either Isochrysidales or Coccolithaceae. A total of 30 placoliths were placed into Zygodiscaceae, and only 7 from three different sites were categorised as Helicosphaera. Additionally, 325 and 486 placoliths were identified as having circular or elliptical features respectively, but no further identification was possible, and they were classified as Isochrysidales indet and Coccolithaceae indet. Only Isochrysidales and Coccolithaceae are examined in detail. The general placolith morphometric parameters are shown in Fig. 6, and correlations to depositional environment parameters are shown in Table 1. Since there is a significant positive correlation of ks to kse (ρ=0.78, p<0.05), indicative of the effects of circularity on the ks value, only kse is used for the placoliths as this is independent of variations in circularity (Eq. 2; Fig. 1). Apart from site 929E, the Coccolithaceae are overall larger and have a higher spread/standard deviation in length per site (Fig. 6b), yet the median kse is nearly identical to the Isochrysidales median kse (Fig. 6a).
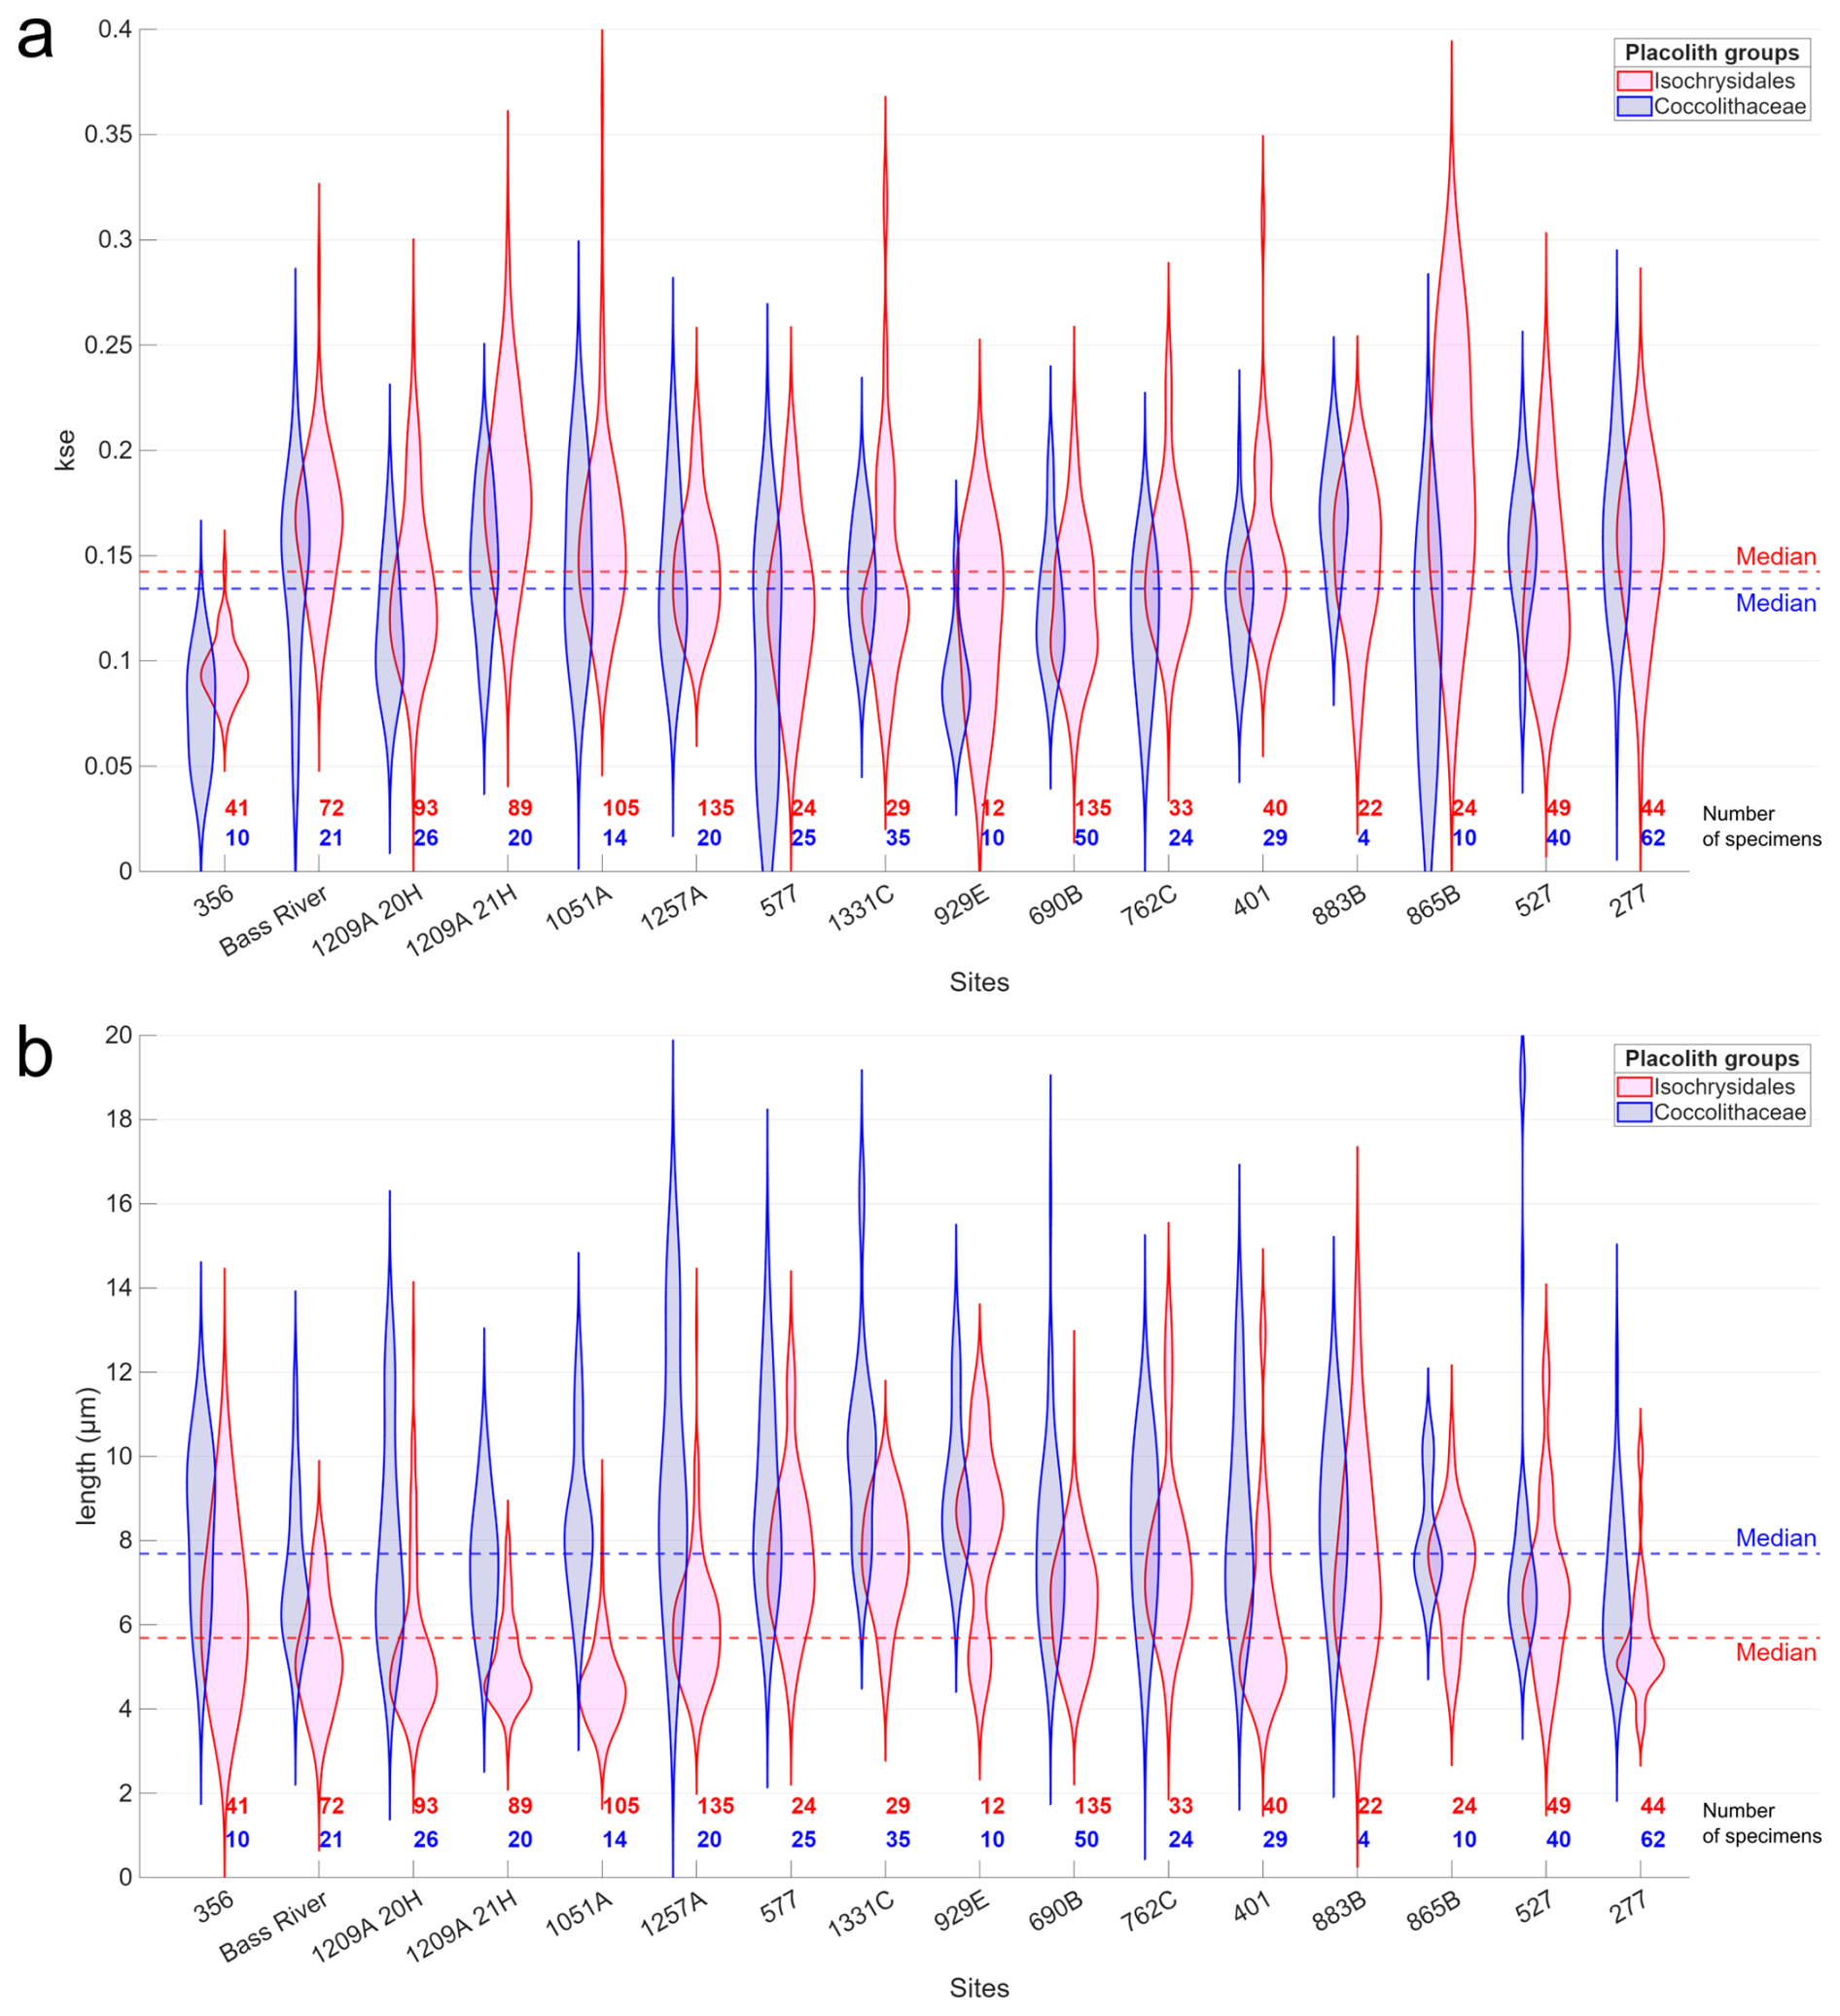
Figure 6Violin plots for every site, showing (a) kse and (b) length in µm of the two placolith groups with only identifiable specimens. The sites are sorted as in Fig. 5. The Isochrysidales group has pink shading, the Coccolithaceae group has blue shading, and the number of specimens per site and placolith group is shown at the bottom in the same colour scheme. The total median values for each placolith group are given as dotted red and blue lines respectively.
There is a significant positive correlation between the median lengths of the Isochrysidales and Coccolithaceae groups (ρ=0.51, p=0.04), which both separately have a significant positive correlation to palaeowater depth (Table 1). While the median kse has a weak positive correlation, the standard deviation of the Isochrysidales kse has a moderate positive correlation with % CaCO3. Further, the Isochrysidales median kse has a moderate negative correlation to the palaeowater depth but has no other correlations between kse and the length to the other depositional environment parameters. The Coccolithaceae only have a moderate negative correlation between the spread/standard deviation of the length and the burial depth and a significant negative correlation between the spread/standard deviation of kse and the palaeowater depth. Both groups have generally unimodally distributed kse values and lengths for all sites except for a bimodal or skewed distribution for sites 277 and 929E (Fig. 6).
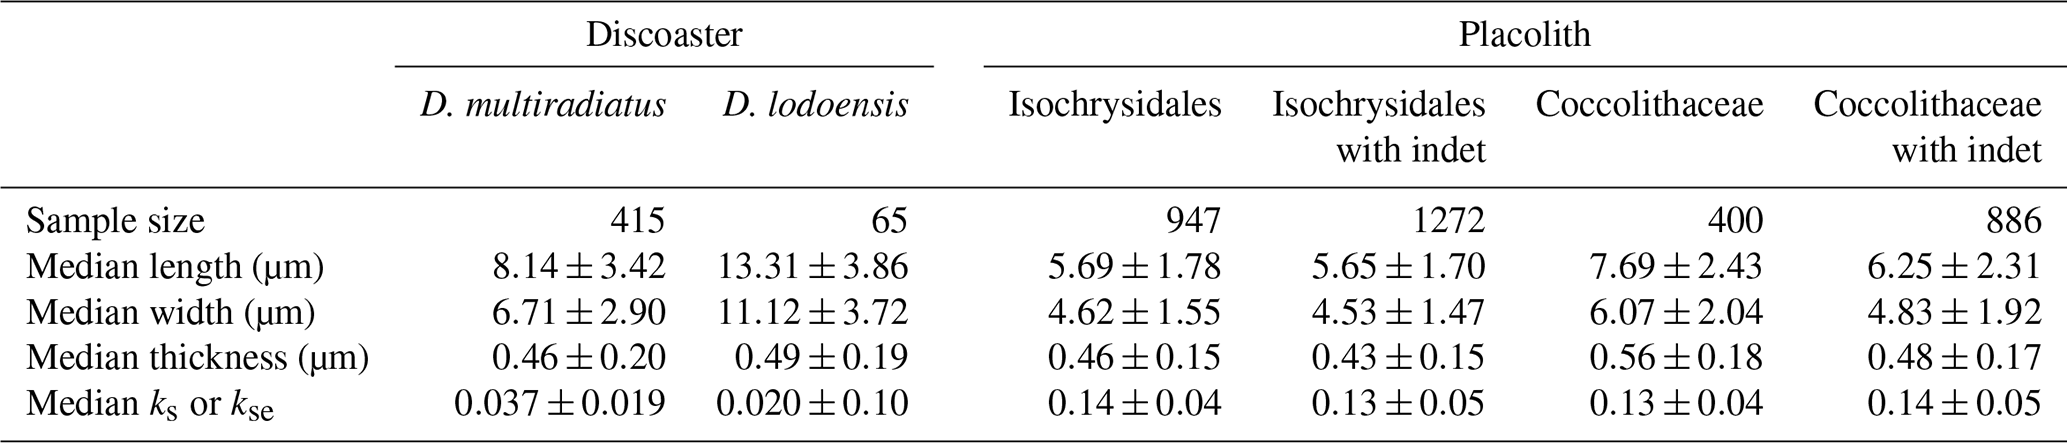
With placoliths, there is potential for a bias towards clearly identifiable specimens and thus potentially less overgrown or dissolved placoliths. Therefore, we also expand the classified population to include the less easily identifiable specimens (indet), with those having circular or elliptical features assigned to Isochrysidales and Coccolithaceae respectively. For the Coccolithaceae including the indet, the median length, width, and thickness become smaller, yet kse is almost identical (Table 2), a result of including smaller and less easily identifiable specimens, but there is still a representative sample pool for placolith thickness assessment. The morphometric data for the Isochrysidales indet are similar to those for the Isochrysidales (Table 2).
Table 2Discoaster and placolith morphometric data as median and standard deviation using specimens from all sites. Both placolith groups have a column with and without indet specimens.
The median kse of both placolith groups is generally unaffected by the % CaCO3 and burial depth, but both groups' median kse has a moderate negative correlation with palaeowater depth (Fig. 7; Table 3).
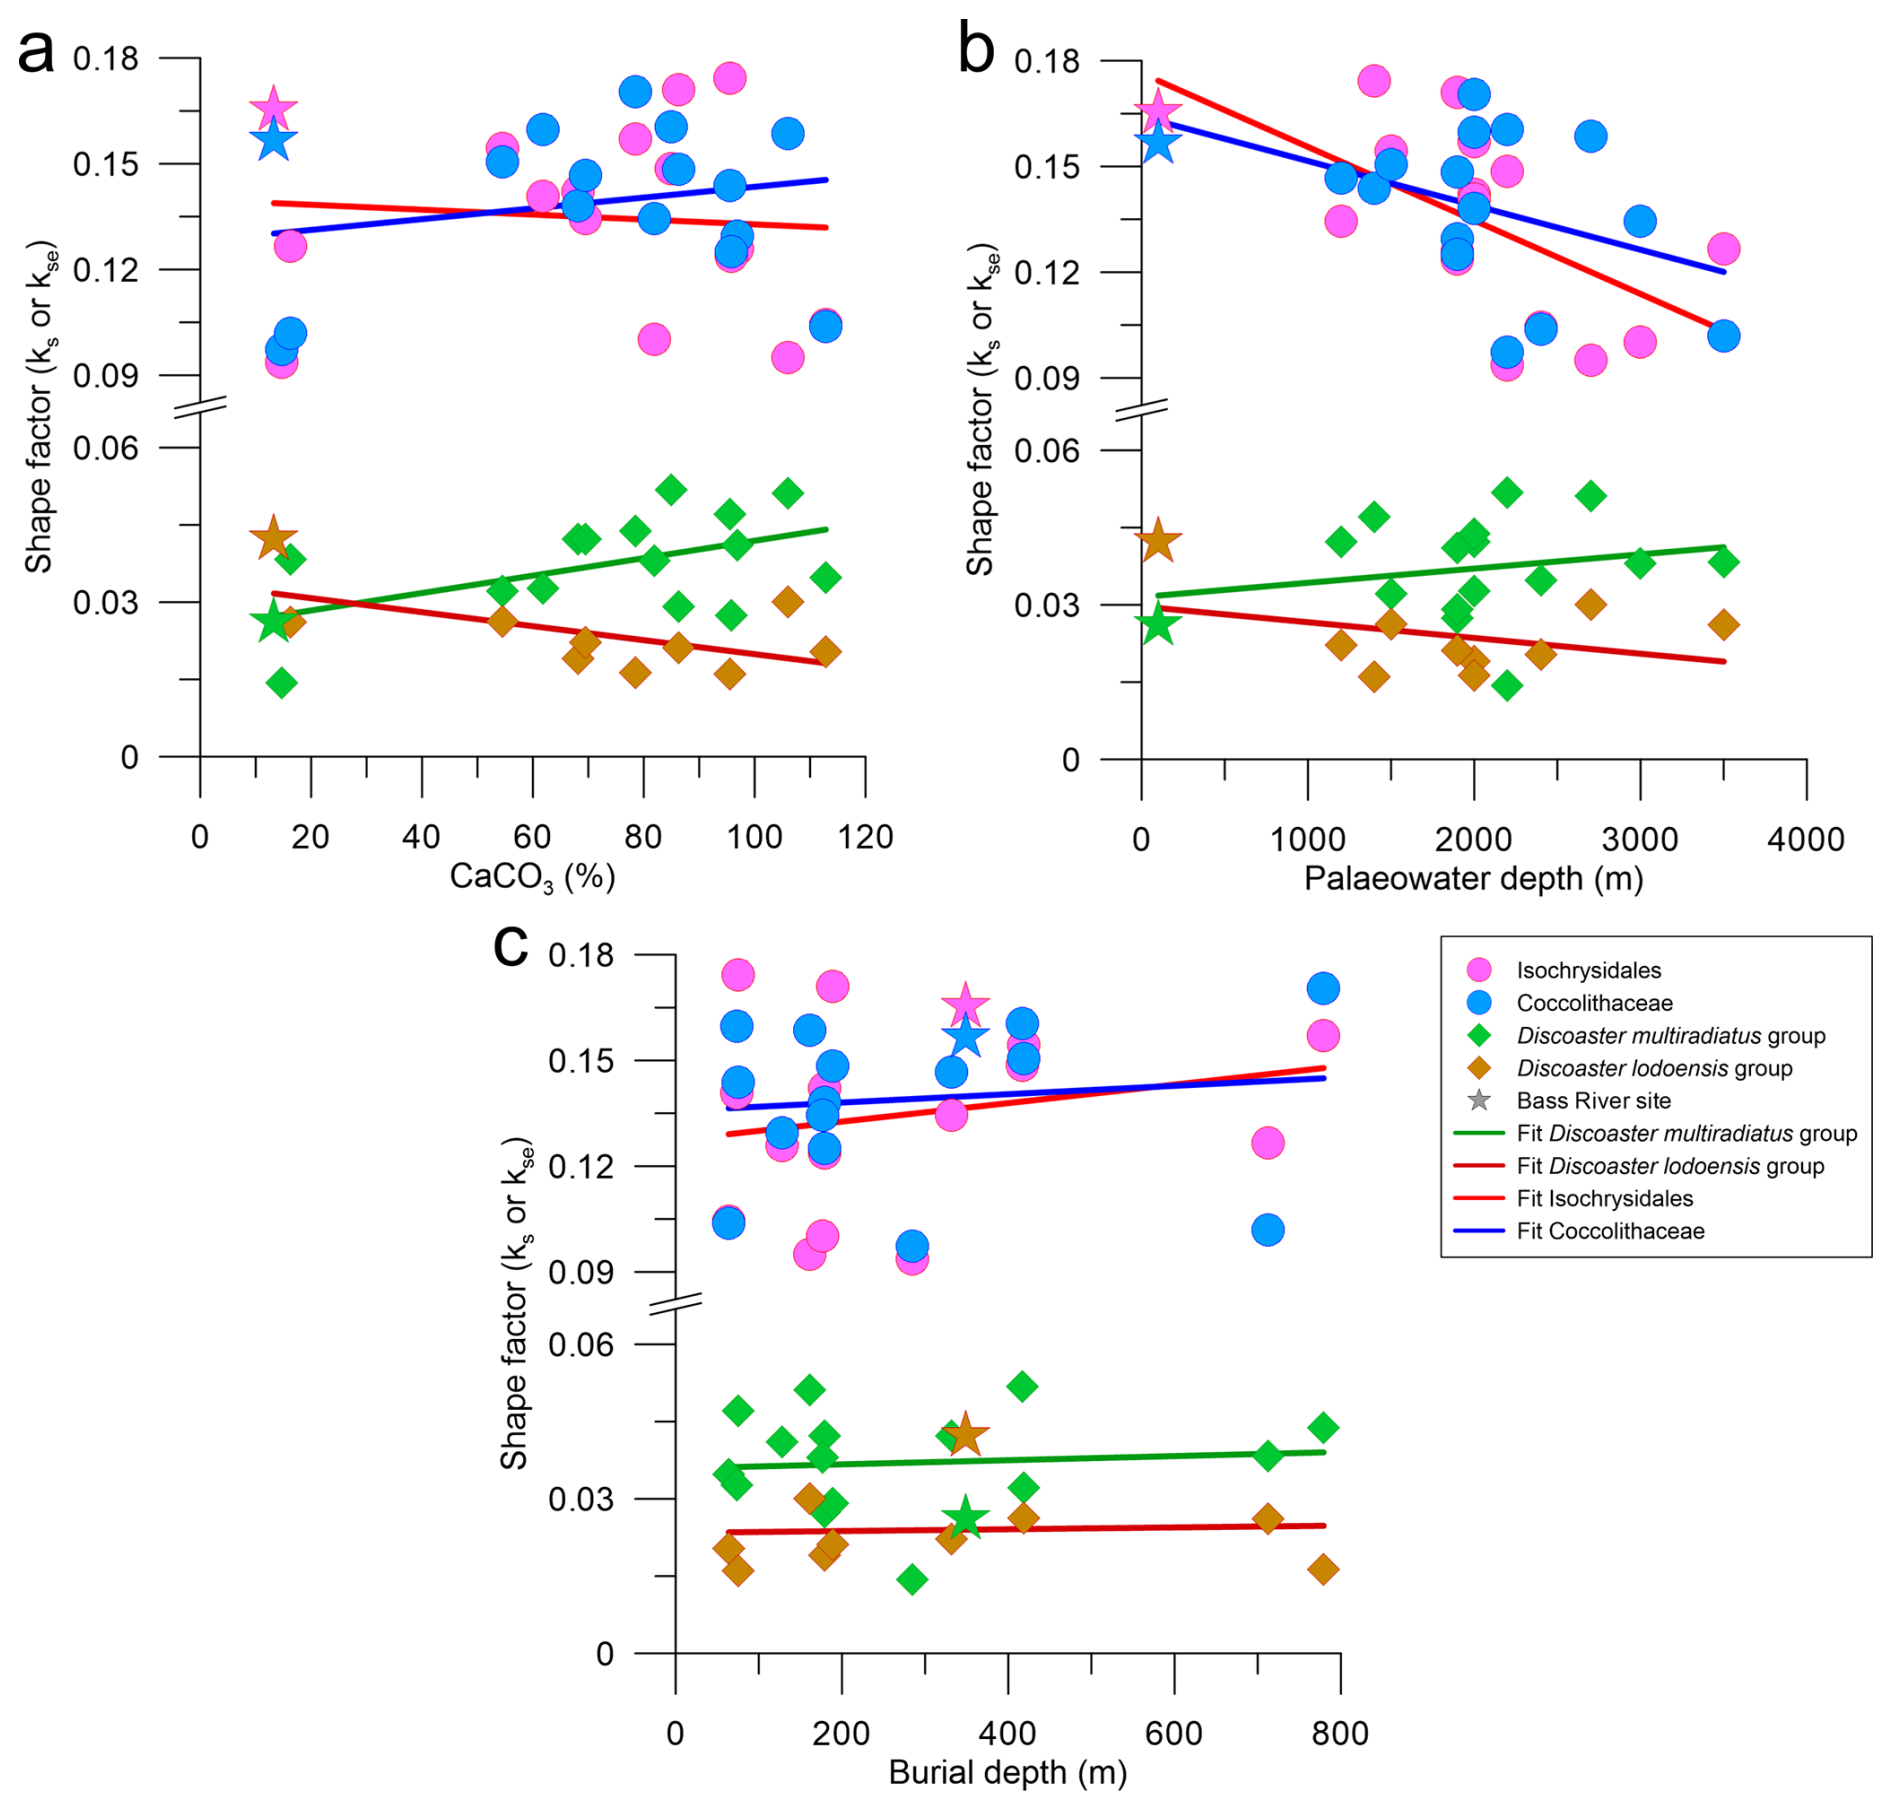
Figure 7Median shape factor of each placolith, including indet specimens, and discoaster group against (a) CaCO3 concentration measured in percent, (b) palaeowater depth measured in metres, and (c) burial depth measured in metres. The Isochrysidales placolith group are pink circles, the Coccolithaceae placolith group are blue circles, the Dm group are green diamonds, and the Dl group are brown diamonds. Linear fits follow the same colour scheme. The values for the Bass River site are indicated as a star, following the same colour scheme.
Table 3Correlation table between three depositional environment parameters (% CaCO3, palaeowater depth, burial depth) and the median and standard deviation of the placolith kse including indet specimens. Significant correlations are marked as bold.
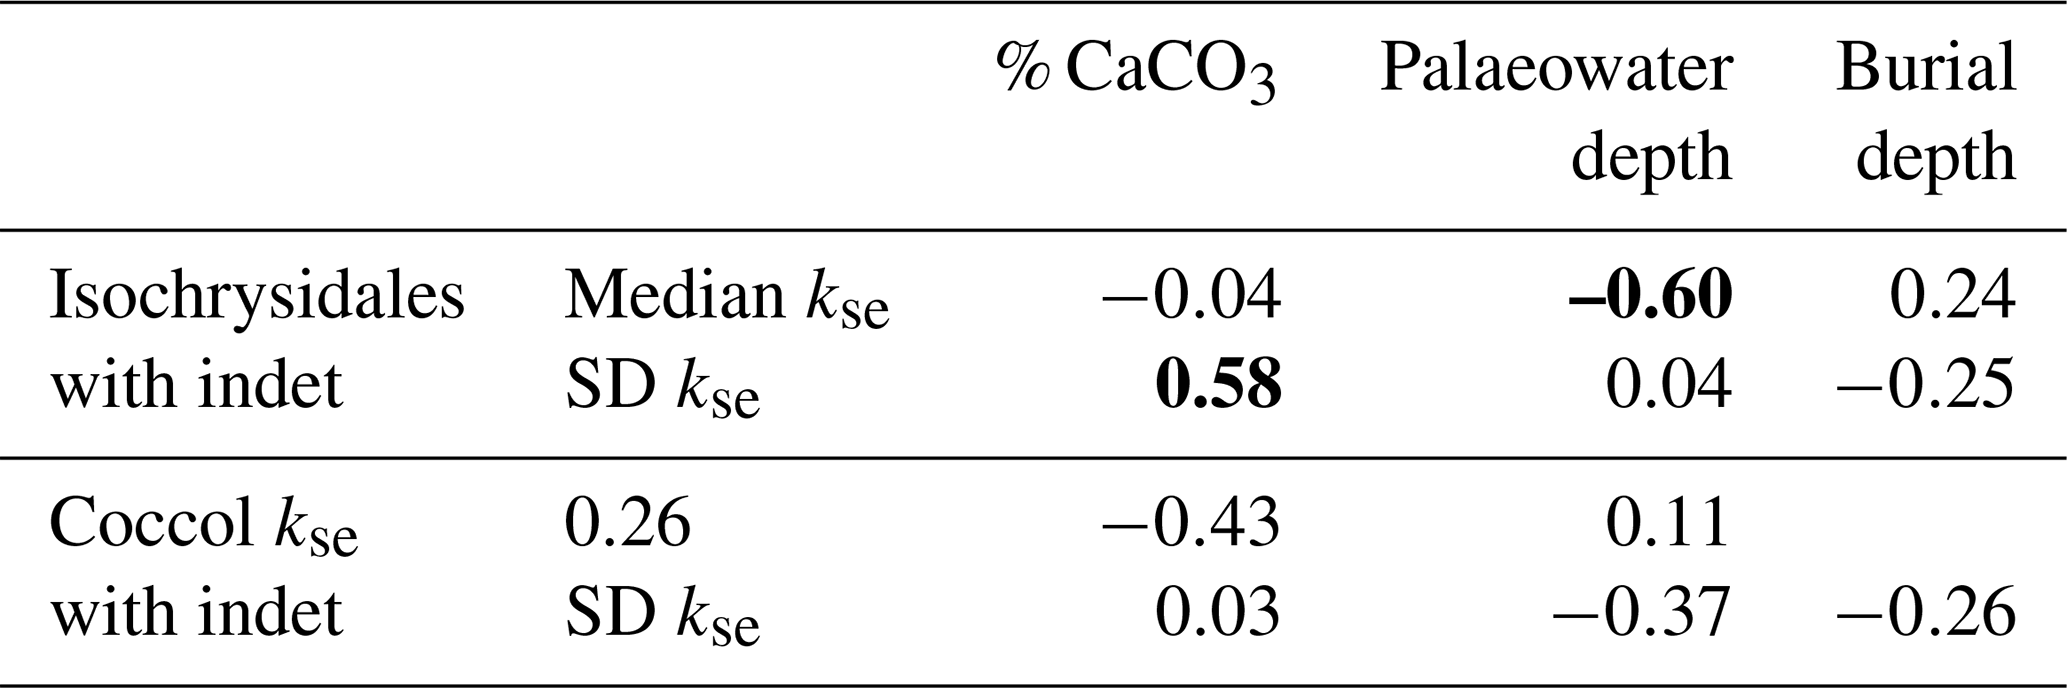
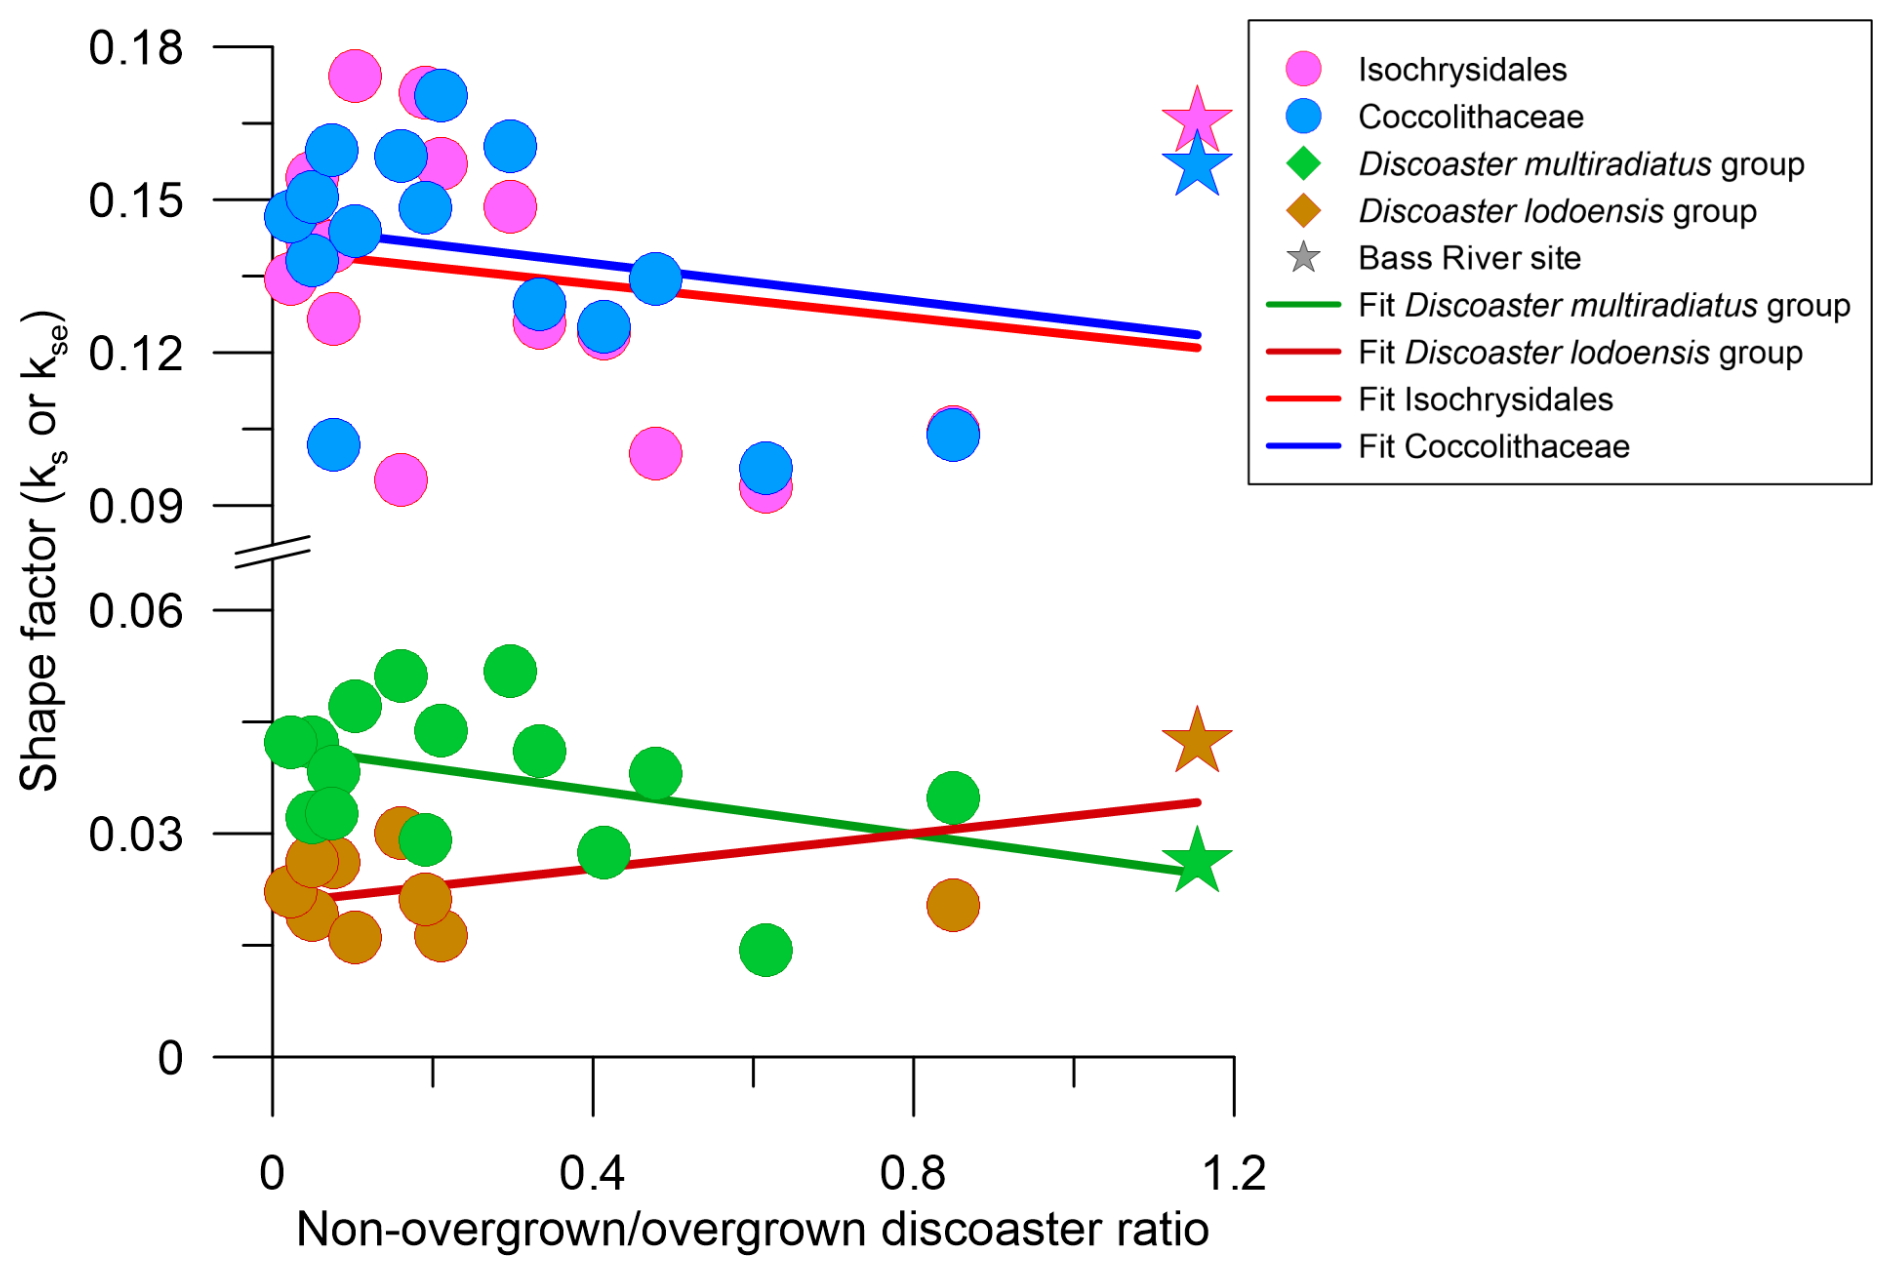
Figure 8Placolith and discoaster shape factor against the ratio of non-overgrown to overgrown discoasters. The colour and shape scheme is the same as in Fig. 7.
4.1 Overgrowth as a mechanism for variations in Discoaster multiradiatus ks
The Bass River site has qualitatively been described as having excellent preservation during our approximate time interval for both placoliths and foraminifera due to its high clay content (Stassen et al., 2015). Our finding that the Bass River Dm group median ks is the second lowest compared to all other sites (Fig. 5a) may be interpreted as discoasters at this site retaining a low primary ks value with limited thickening due to sedimentary diagenetic overgrowth. This conclusion is supported by this site having the highest ratio of “non-overgrown” (non-birefringent and not visible under cpl) to “overgrown” (birefringent and visible under cpl) discoasters (Fig. 8). Overall, the median ks of the Dm group has a moderate negative correlation with the non-overgrown to overgrown discoaster ratio (, p=0.06; Fig. 8), confirming that overgrowth is a main driver of thickness in the Dm group. The median Dm group ks at five other sites (sites 356, 577, 1051A, 1209A_21H, 1257A) is within 1 standard deviation of Bass River, which may indicate that these sites have similar preservation and a lack of overgrowth (Fig. 5a). A site featuring a thinner Dm group ks than Bass River may indicate greater dissolution or a lower degree of primary biomineralisation (Dedert et al., 2014). At six sites (sites 277, 401, 527, 762C, 865B, 883B), the Dm group median ks is >50 % higher than that at the Bass River site, accompanied by a greater proportion of overgrown to non-overgrown discoasters, suggesting that at these sites a significant fraction of the discoaster calcite may have been formed as secondary overgrowths. This high fraction of secondary overgrowth would impact geochemical measurements on discoasters. The significant positive correlation for the Dm median ks with the % CaCO3 at all sites (ρ=0.56; p=0.02) indicates that overgrowth is more significant in conditions where % CaCO3 is high (Table 1; Fig. 7a).
4.2 Dissolution contributes to thickness variations in early Eocene placoliths
Unlike for the D. multiradiatus group, the placolith kse at Bass River is generally above most other sites and above the median of all sites (Fig. 6a). Yet, the placolith length for both Isochrysidales and Coccolithaceae at Bass River is below the median of all sites, indicating that size is not the cause of the high placolith kse. We interpret the placolith kse at the well-preserved Bass River setting as indicative of primary biomineral thickness and regard the reduced placolith thickness and kse at other sites in this study as a result of secondary dissolution. The most significant correlation between the placolith kse and the depositional environment parameters is the decrease in kse with increasing water depth, suggesting that dissolution is more prevalent than overgrowth and increases with increasing palaeowater depth, either at the water–sediment interface while sinking through the water column or in the euphotic zone (Milliman et al., 1999; Beaufort et al., 2007; Langer et al., 2007; Sulpis et al., 2021; Dean et al., 2024). There is an apparent decrease in Isochrysidales kse at Eocene settings at a palaeowater depth of around 2 km; however this is most likely not linked to dissolution due to the calcite compensation depth as it is shallower than the reconstructed calcite compensation depths of 3–4 km for the early Eocene (Pälike et al., 2012; Slotnick et al., 2015; Greene et al., 2019) and the reconstructed placolith dissolution depth of ∼4 km for extratropical, lower Eocene to Miocene placoliths (Burns, 1975). We acknowledge that our imaged Coccolithaceae most likely underestimate the overall thickness and kse as we do not image the non-birefringent V-unit crystals. Despite this, the similar behaviour of both placolith groups with regard to the depositional environment parameters (Table 3; Fig. 7) and the known dissolution resistance and higher estimated primary biomineral thickness of modern Coccolithaceae relative to Isochrysidales further suggest that dissolution is the cause of reduced placolith kse (Adelseck et al., 1973; Roth and Berger, 1975; Young and Ziveri, 2000).
The significant positive correlation of % CaCO3 with Isochrysidales kse standard deviation indicates higher variability in Isochrysidales thickness with more sedimentary carbonate content (Table 3). A previous study on Oligocene and Miocene coccoliths also found a higher median kse and variability with an increase in % CaCO3, although this was only moderate due to their limited range in % CaCO3 (Guitián et al., 2020, 2022). Furthermore, the moderate negative correlation between the median length and kse of both placolith groups agrees with a dissolution experiment of placoliths from surface sediments over a wide range of depths and values of deep calcite saturations (Gerotto et al., 2023), where smaller placoliths were preferentially dissolved in more dissolution-prone settings and consequently increased the median length but decreased kse (Fig. 9). Thus, our data suggest that % CaCO3 does not lead to a direct indication of overgrowth in coccoliths but can indicate higher variability and hence more variable preservation potential within a sample. In surface sediment transects across dissolution gradients, the Isochrysidales kse was found to be reduced by ∼40 %–50 % in higher-dissolution settings (D'Onofrio et al., 2016; Gerotto et al., 2023; Pige et al., 2023). Taking the Bass River median kse as the primary Isochrysidales thickness, our Isochrysidales kse from the Eocene falls well within this range, with sites 356 and 527 both showing the highest reduction in Isochrysidales kse of 43 % relative to the Bass River site. Sites 577 and 1331 show a reduction in Isochrysidales kse of 38 %, while the other sites show reductions ≤ 25 %.
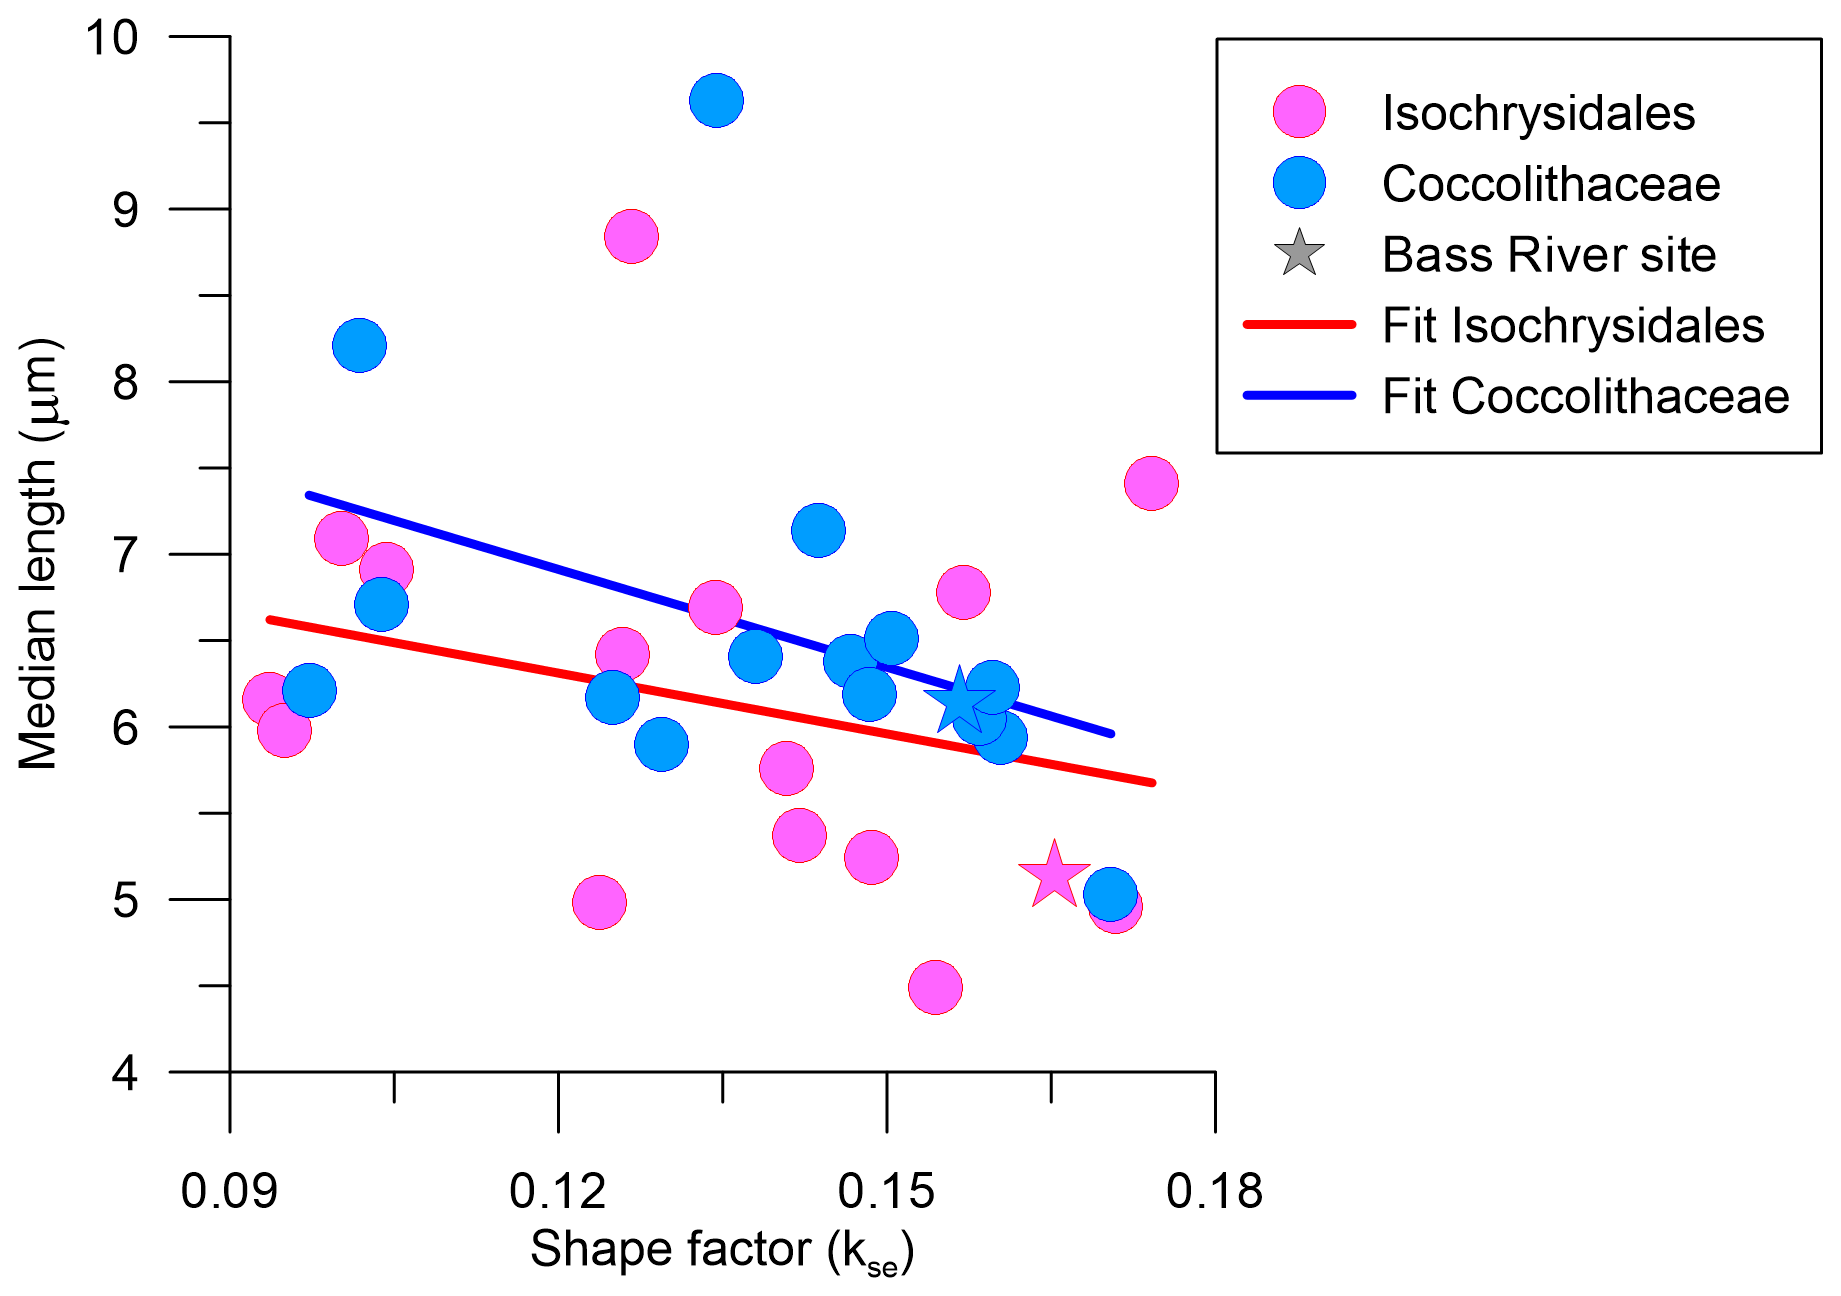
Figure 9Median length in µm against shape factor (kse) for both Isochrysidales and Coccolithaceae including indet specimens, following the same colour and symbol scheme of Fig. 7.
The nannolith to placolith ratio has been suggested as another potential indicator of dissolution because many nannoliths are suspected to be more dissolution resistant than placoliths (Gibbs et al., 2004; Guitián et al., 2022). In our dataset, there are weak correlations between the nannolith to placolith ratio and the ks or kse of discoasters and placoliths (Fig. 10). However, the relative abundance of discoasters and sphenoliths is also proposed to depend on ecological factors, with the genus Discoaster suggested to be associated with warm and oligotrophic conditions (Aubry, 1992). Consequently, discoasters and/or sphenoliths are less abundant at higher latitudes. Indeed, the lowest nannolithplacolith ratio is at 690B, a high-latitude site with a total of only nine discoasters and one sphenolith. Yet, the nannolithplacolith ratio is the second lowest for the equatorial site of 1257A, with a total of 27 discoasters and 1 sphenolith. Further, while the “well-preserved” Bass River site is on the lower side of the nannolithplacolith ratio, this could be due to either the high productivity at the coastal site or the slight dissolution of smaller placoliths, as discussed above. We suggest that, due to the mixture of ecological and dissolution influence, this ratio is not suitable for detecting the dissolution intensity to which placoliths were subjected.
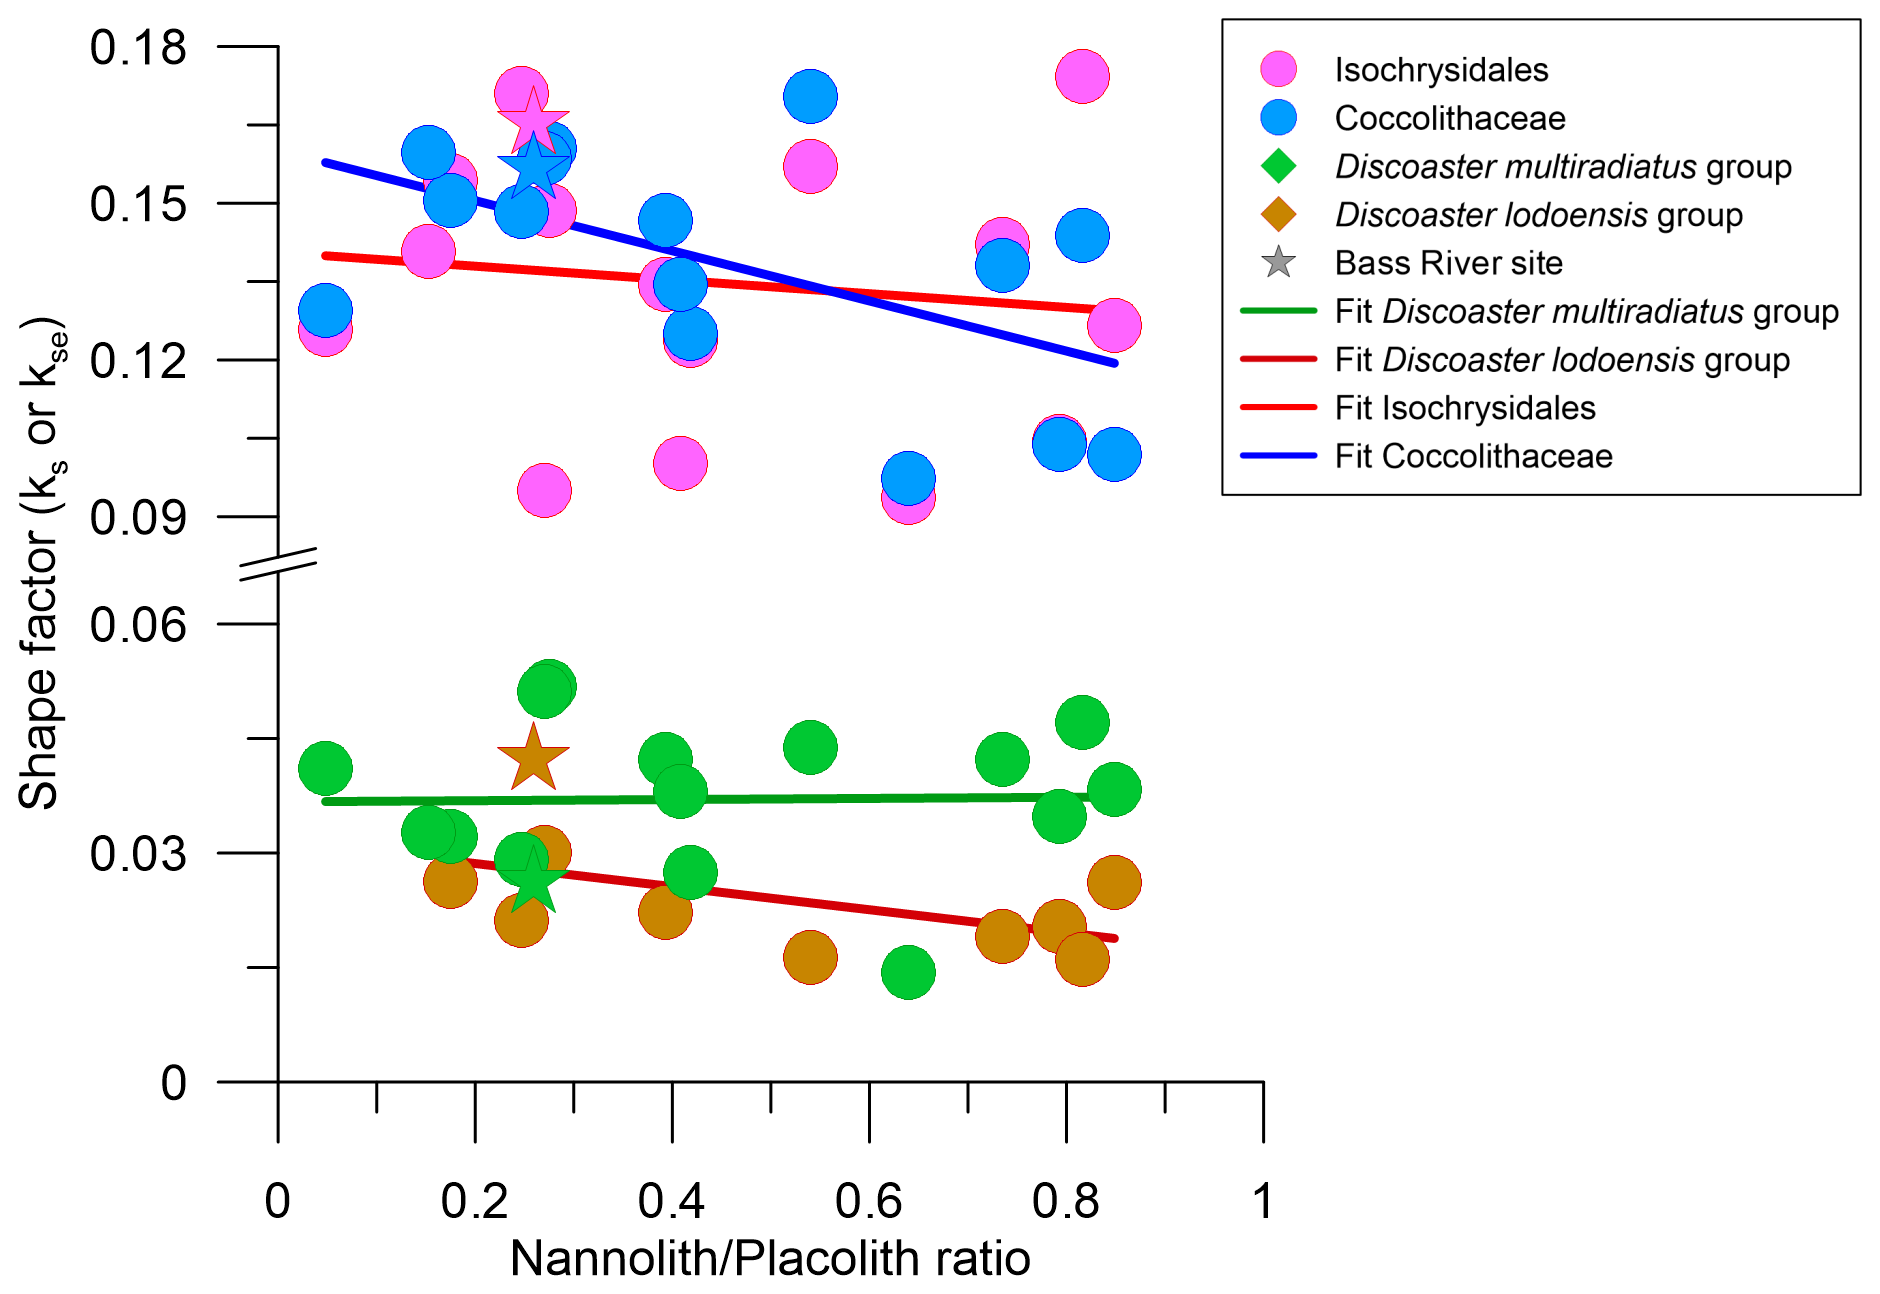
Figure 10Placolith and discoaster shape factor against (a) the nannolith to placolith ratio and (b) the ratio of non-overgrown to overgrown discoasters. The colour and shape scheme is the same as in Fig. 7.
Both placolith groups have kse values that are comparable to or lower than those of Bass River, which may suggest that limited overall diagenetic overgrowth affected the placoliths. This interpretation is supported by the weak negative correlations between kse and preservation of discoasters, as assessed by the non-overgrown to overgrown discoaster ratio ( and −0.27 and p=0.46 and 0.32 for Isochrysidales and Coccolithaceae respectively; Fig. 8).
4.3 Processes contributing to contrasting responses of discoasters and placoliths to sedimentary diagenesis
The propensity for overgrowth or dissolution in calcareous nannofossils has been linked to crystal size, nannofossil morphology, and crystal orientation, as well as to the presence of an organic coating (Bukry, 1971b; Adelseck et al., 1973; Henriksen et al., 2004; Hassenkam et al., 2011; Dedert et al., 2014; Sand et al., 2014). In general, following the Ostwald ripening process, larger crystals have lower surface free energies than smaller crystals, are thus energetically more favourable in solutions near equilibrium, and will grow at the expense of smaller crystals (Madras and McCoy, 2002). Generally, at diagenetically affected settings, Discoasters would thus preferentially have overgrowth, while placoliths would preferentially dissolve (Adelseck et al., 1973).
Besides crystal size, the crystallographic orientation of the crystal planes relative to the c axis has also been suggested to aid in the dissolution resistance of a crystal. Crystal planes perpendicular to the c axis are more dissolution resistant, while crystals with planes parallel to the c axis are less dissolution resistant (Bain, 1941; Bukry, 1971b; Adelseck et al., 1973). As such, the central units of placoliths such as Coccolithaceae (formed by R units) are preferentially dissolved, while the distal shield is more resistant (formed by V units; Young et al., 1999). Potentially, it can also be related to the V-unit crystallographic orientation, as discoasters and the distal shields of Coccolithaceae are usually dominant in dissolution-prone settings, resulting in strongly dissolved nannofossil assemblage (Bukry, 1971b; Roth and Berger, 1975). Additionally, the organic coating covering placoliths further inhibits the nucleation of other calcite particles and can also protect the placolith from dissolution (Bukry, 1971b; Hassenkam et al., 2011; Sand et al., 2014). If dissolution occurs, it is mainly along the placolith sutures and edges (Adelseck et al., 1973; Honjo, 1975; Henriksen et al., 2004). This has also been observed for placoliths from Cretaceous chalk, with a dominantly small size fraction indicative of fragmentation relative to authigenic precipitation (Hassenkam et al., 2011; Sand et al., 2014).
Increased exposure of sediment to seawater through low sedimentation rates would likely amplify any of the abovementioned diagenetic effects. Yet, while the sedimentation rate has a weak positive correlation with the placolith median kse (ρ≤0.20), it has a moderate negative correlation with the Dm median ks (, p=0.09). Coupled to the lack of correlation between the Dm median ks and sample depth, this suggests that overgrowth mainly occurs at the sediment–seawater interface, and therefore a higher sedimentation rate reduces the potential for discoaster overgrowth and, to a lesser extent, placolith dissolution. Furthermore, the non-overgrown to overgrown discoaster ratio has a significant positive correlation to the sedimentation rate (ρ=0.70, p<0.05), further suggesting that a higher sedimentation rate reduces the potential for diagenetic processes to affect calcareous nannofossils.
We imaged and quantified the thickness and shape factors of both discoasters (ks) and placoliths (kse) from 16 samples of early Eocene age (54–50 Ma) with a range of carbonate content, palaeowater, and burial depths to determine whether these indicators of sedimentary burial environment correlate with evidence of overgrowth and/or dissolution. We find distinct and separate responses of the dominant discoasters and placolith groups. At the shallow clay-rich sediments of Bass River, we find that the Discoaster multiradiatus group is thinner for a given size, with lower ks and with a lower proportion of birefringent specimens relative to sites with progressively higher % CaCO3 that feature thicker discoasters and a higher proportion of birefringent specimens. We interpret this as evidence of progressively greater degrees of sedimentary diagenetic overgrowth affecting the D. multiradiatus group. In contrast, placoliths of Isochrysidales and Coccolithaceae are thicker for a given size, with high kse values, in the shallow clay-rich sediments of Bass River. Furthermore, in other sedimentary environments with higher % CaCO3, these placoliths feature either comparable or lower kse. The kse values of both Eocene Isochrysidales and Eocene Coccolithaceae placoliths are negatively correlated to the palaeowater depth, suggesting that in the Eocene settings prone to diagenesis, placoliths are mainly affected by dissolution and not by overgrowth. We find that the nannolith to placolith ratio is not a good indicator of overgrowth or dissolution, but the ratio of non-overgrown to overgrown discoasters of the D. multiradiatus group shows potential as an indicator of overgrowth potential.

Figure A1SEM images showing varying degrees of placolith preservation and abundance. The samples are from site 277 (a, b), site 356 (c, d), site 401 (e, f), site 527 (g, h), site 577 (i, j), and site 690 (k, l). The scale bar is 1 µm.
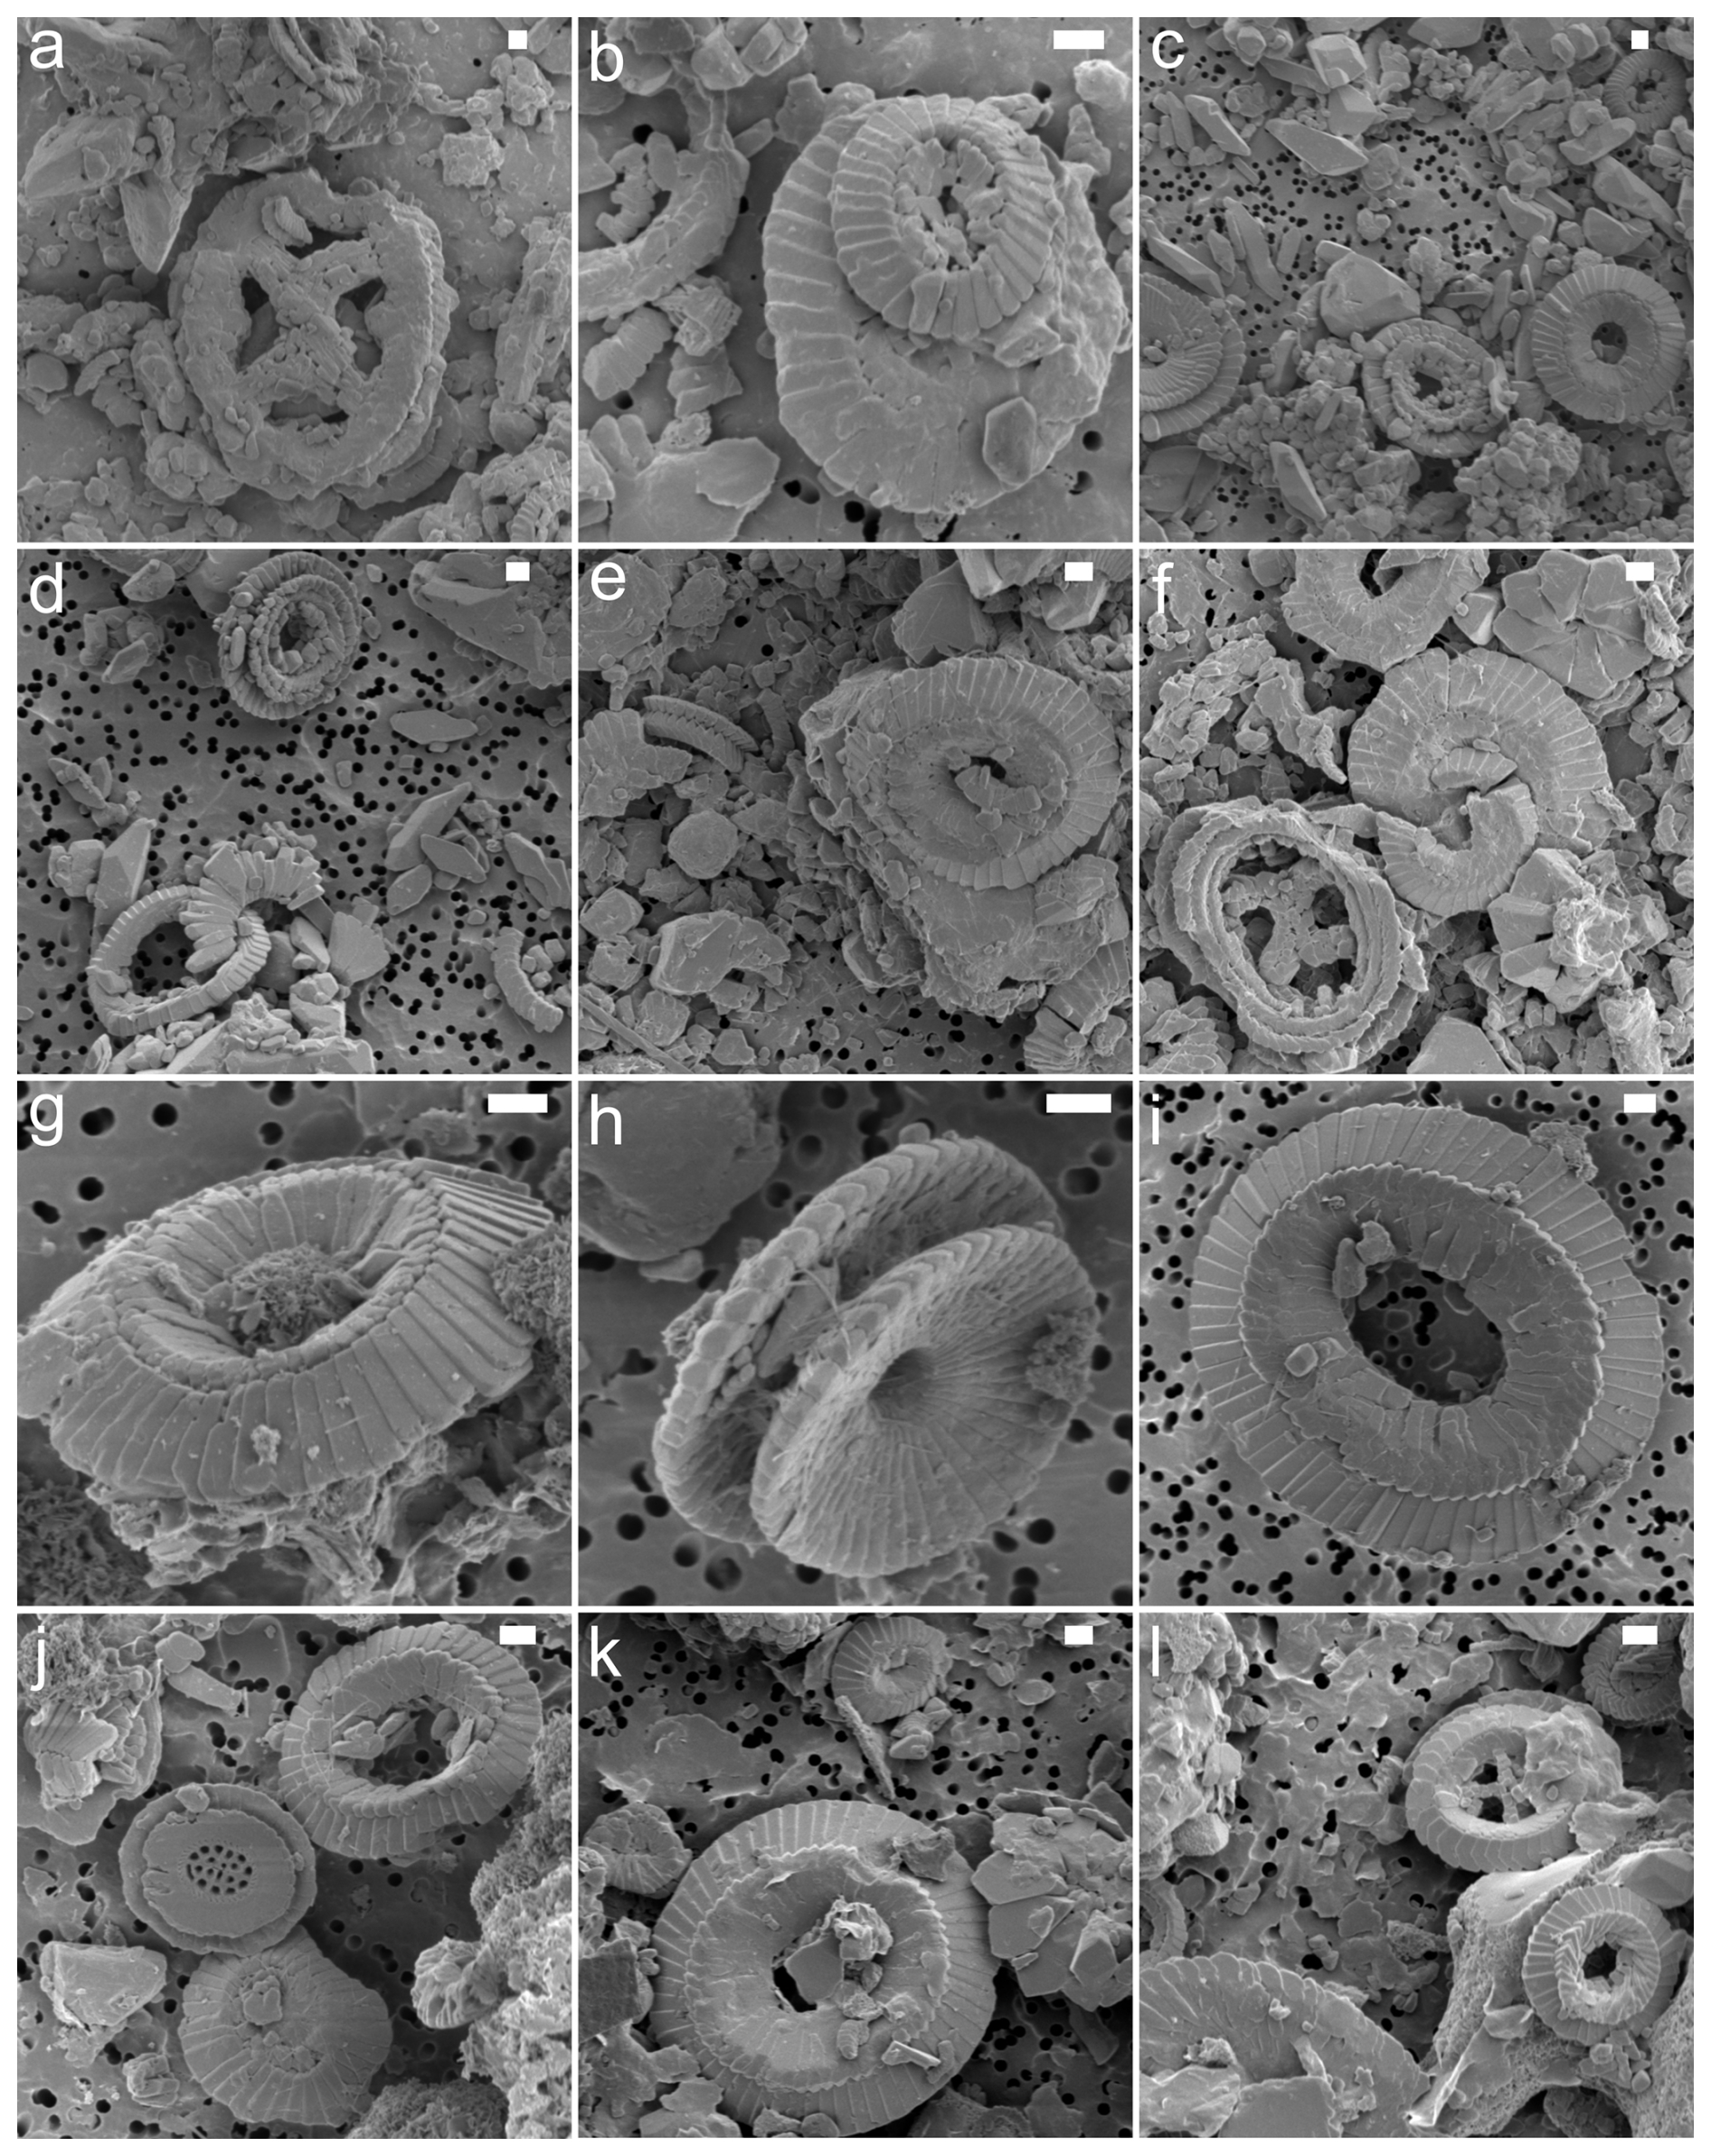
Figure A2SEM images showing varying degrees of placolith preservation and abundance. The samples are from site 762 (a, b), site 865 (c, d), site 883 (e, f), site 929 (g–j), and site 1051 (k, l). The scale bar is 1 µm.
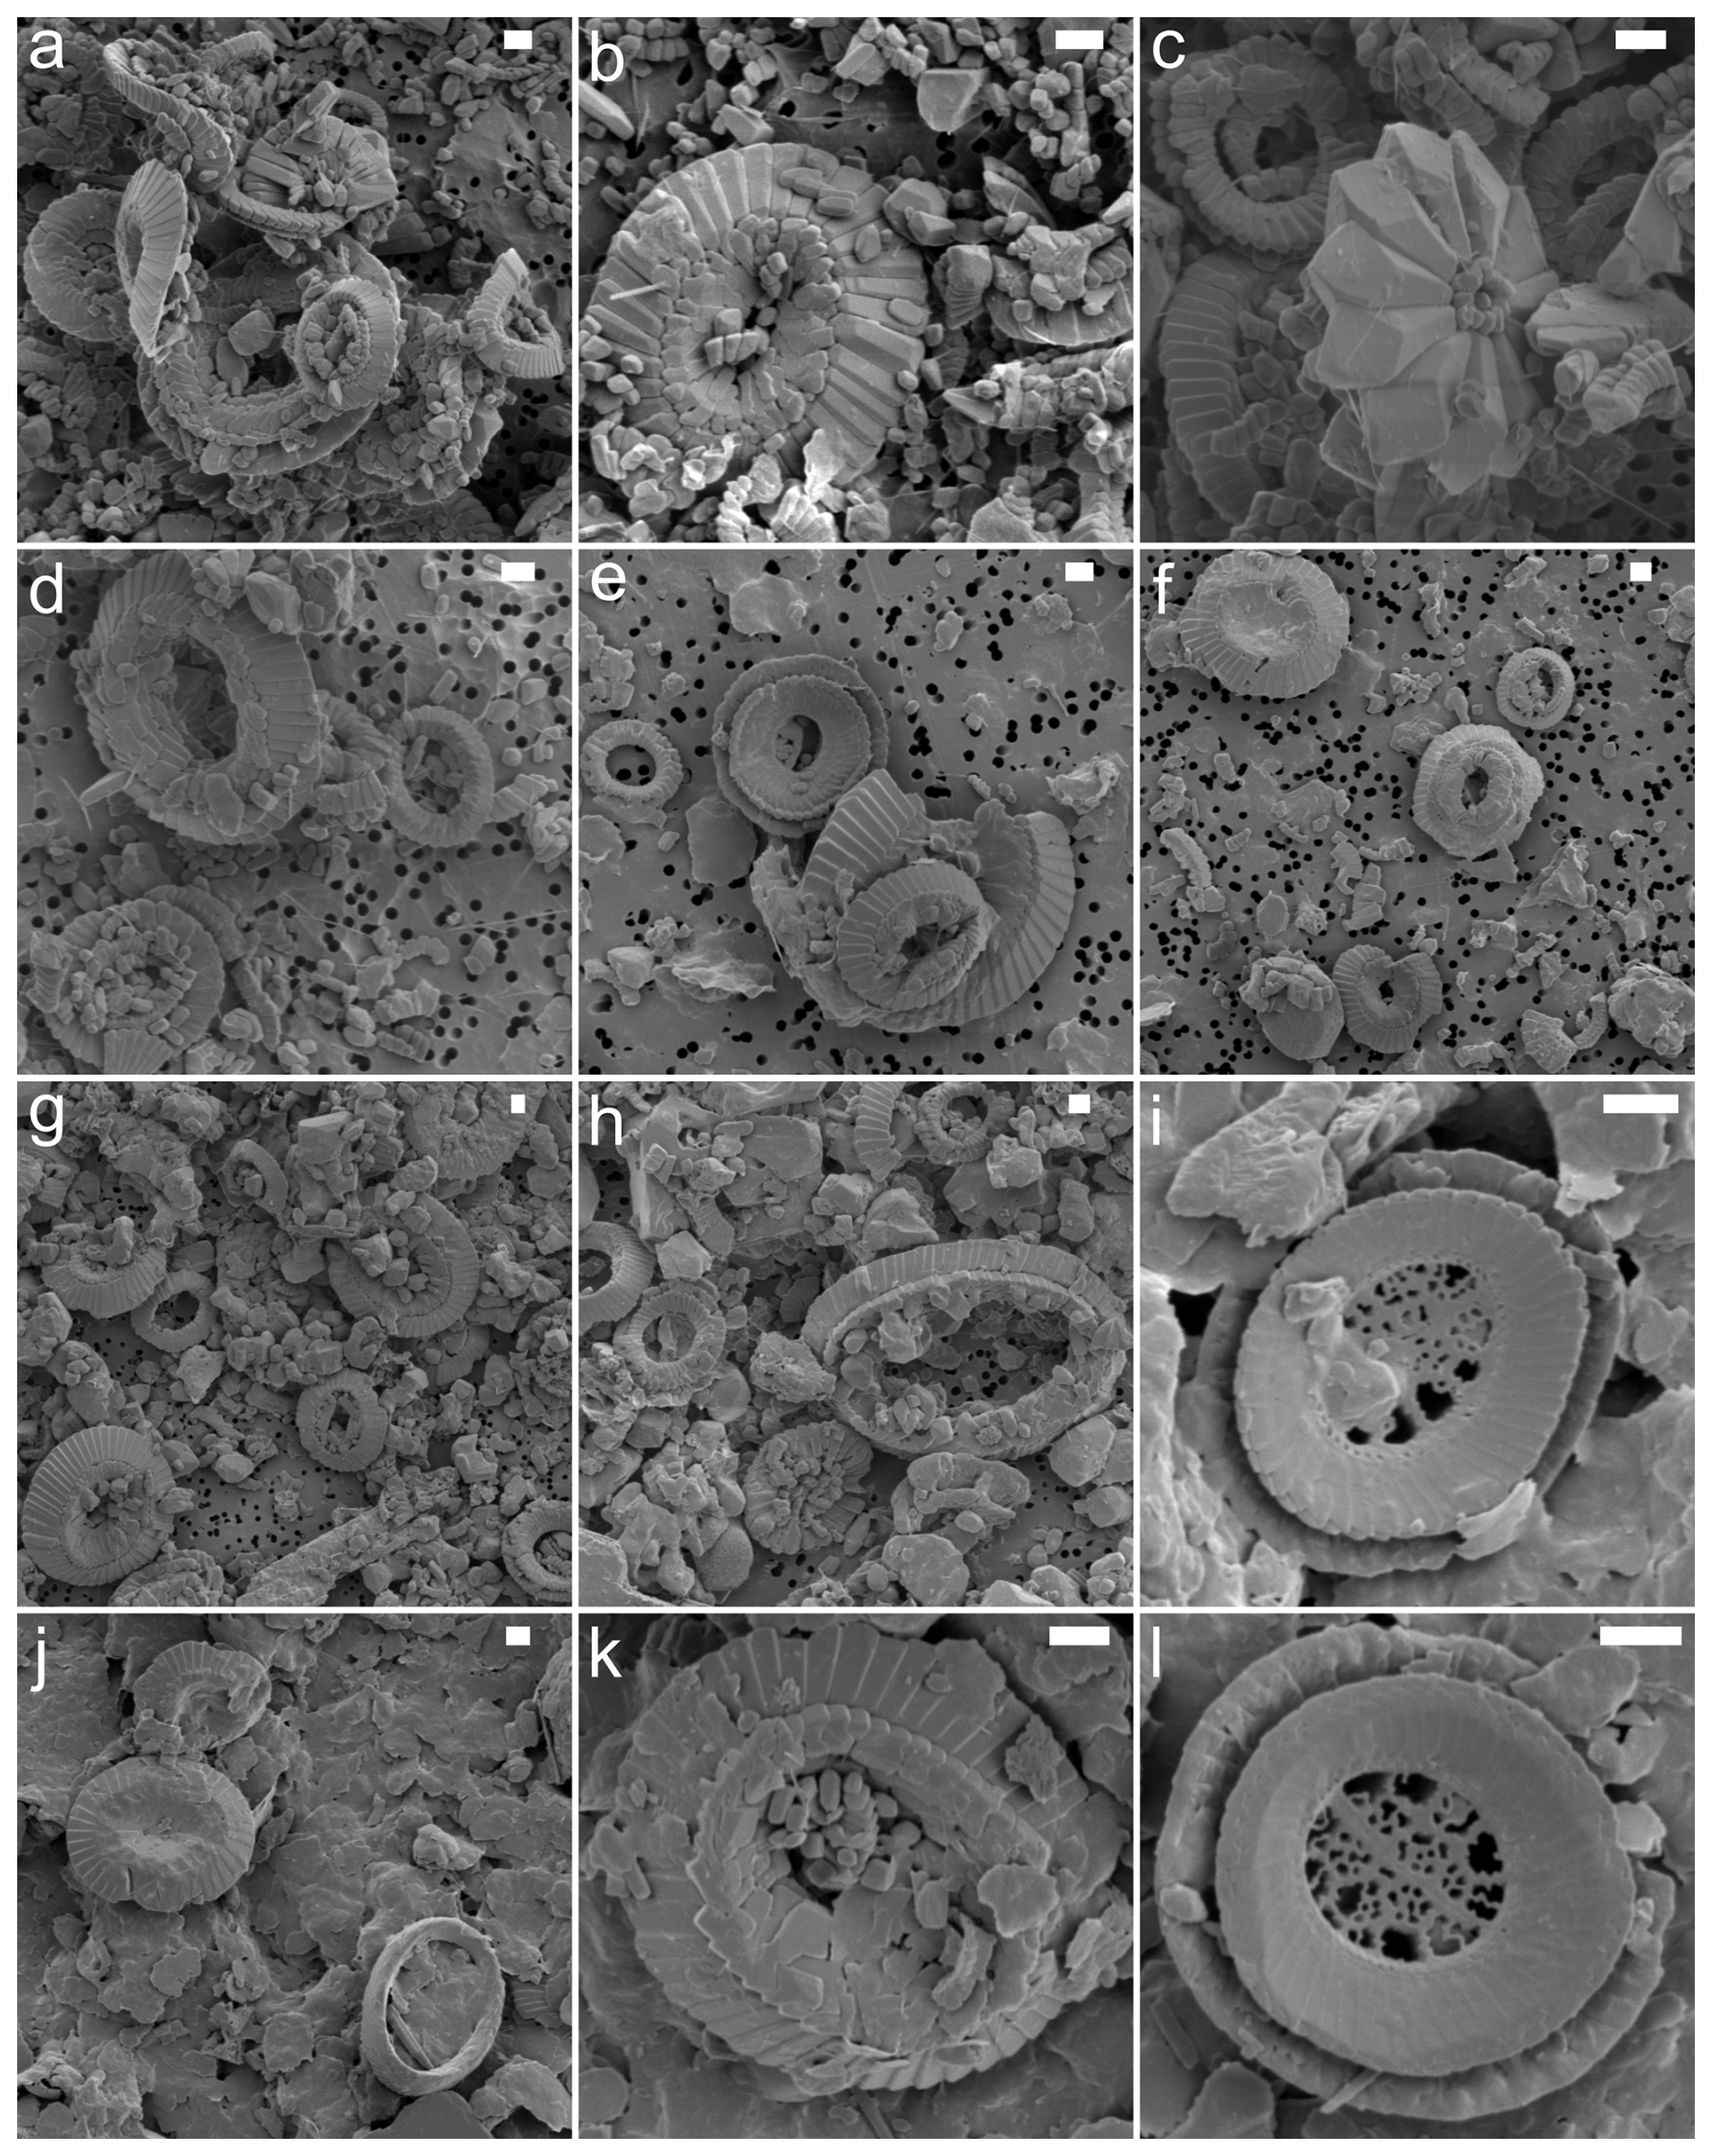
Figure A3SEM images showing varying degrees of placolith preservation and abundance. The samples are from site 1209_20H (a, b), site 1209_21H (c, d), site 1257 (e, f), site 1331 (g, h), and Bass River (i–l). The scale bar is 1 µm.
All data are available in the main text and in the Supplement.
The samples and non-polarised and cpl images are stored at the Geological Institute, ETH Zürich, Switzerland, and are available on request.
The Supplement related to this work was submitted, processed, and made available upon final publication at the ETH Zürich Research Collection (Clark et al., 2025b). The supplement related to this article is available online at https://doi.org/10.5194/jm-44-673-2025-supplement.
AJC and HMS designed the study. AJC, MJ, and KB carried out sample preparation. AJC and KB collected and processed the microscopy images and performed the statistical analyses. MJ measured the carbonate content. AGL did the taxonomic identification. All authors contributed to the writing and editing.
The contact author has declared that none of the authors has any competing interests.
Publisher's note: Copernicus Publications remains neutral with regard to jurisdictional claims made in the text, published maps, institutional affiliations, or any other geographical representation in this paper. While Copernicus Publications makes every effort to include appropriate place names, the final responsibility lies with the authors. Views expressed in the text are those of the authors and do not necessarily reflect the views of the publisher.
This work was supported by ETH (grant ETH-02 21-1). The authors thank Anne-Greet Bitterman of ScopeM for their support with the SEM. The authors also thank the two anonymous reviewers and Emanuela Mattioli for their helpful comments and editorial support.
This research has been supported by the ETH Zürich Foundation (grant no. ETH-02 21-1).
This paper was edited by Emanuela Mattioli and reviewed by Nicolas Pige and one anonymous referee.
Adelseck, C., Geehan, G., and Roth, P.: Experimental Evidence for the Selective Dissolution and Overgrowth of Calcareous Nannofossils During Diagenesis, Geol. Soc. Am. Bull., 84=, 2755–2762, https://doi.org/10.1130/0016-7606(1973)84<2755:EEFTSD>2.0.CO;2, 1973.
Arney, J. and Wise Jr., S.: Paleocene-Eocene Nannofossil Biostratigraphy of ODP Leg 183, Kerguelen Plateau, in: Proceedings of the Ocean Drilling Program, Scientific Results, 183, 1–59, https://www-odp.tamu.edu/publications/183_SR/VOLUME/CHAPTERS/014.PDF (last access: 12 December 2025), 2003.
Arreguín-Rodríguez, G., Thomas, E., D'haenens, S., Speijer, R., and Alegret, L.: Early Eocene deep-sea benthic foraminiferal faunas: Recovery from the Paleocene Eocene thermal maximum extinction in a greenhouse world, PLoS ONE, 13, https://doi.org/10.1371/journal.pone.0193167, 2018.
Aubry, M.-P.: Late Paleogene nannoplankton evolution: A tale of climatic detereoration, in: Eocene-Oligocene Climatic and Biotic Evolution, edited by: Prothero, D. R. and Berggren, W. A., Princeton Univ. Press, Princeton, NJ, USA, 272–309, ISBN 9781400862924, 1992.
Bain, G.: Papers – Geological, chemical and physical problems in the marble industry (T.P. 1261), AIME Technical Publication 1261, The American Institute of Mining, Metallurgical, and Petroleum Engineers, 1–16, https://www.onemine.org/documents/papers-geological-chemical-and-physical-problems-in-the-marble-industry-t-p-1261- (last access: 12 December 2025), 1941.
Beaufort, L., Probert, I., and Buchet, N.: Effects of acidification and primary production on coccolith weight: Implications for carbonate transfer from the surface to the deep ocean, Geochem. Geophy. Goesy., 8, 1–18, https://doi.org/10.1029/2006GC001493, 2007.
Beaufort, L., Gally, Y., Suchéras-Marx, B., Ferrand, P., and Duboisset, J.: Technical note: A universal method for measuring the thickness of microscopic calcite crystals, based on bidirectional circular polarization, Biogeosciences, 18, 775–785, https://doi.org/10.5194/bg-18-775-2021, 2021.
Bolton, C., Hernández-Sánchez, M., Fuertes, M., González-Lemos, S., Abrevaya, L., Mendez-Vicente, A., Flores, J., Probert, I., Giosan, L., Johnson, J., and Stoll, H.: Decrease in coccolithophore calcification and CO2 since the middle Miocene, Nat. Commun., 7, 10284, https://doi.org/10.1038/ncomms10284, 2016.
Bown, P. (Ed.): Calcareous nannofossil biostratigraphy, Kluwer Academic Publishers, Dordrecht, the Netherlands, 314 pp., ISBN 0412789701, 1999.
Bralower, T., Zachos, J., Thomas, E., Parrow, M., Paull, C., Kelly, D., Silva, I., Sliter, W., and Lohmann, K.: Late Paleocene to Eocene paleoceanography of the equatorial Pacific Ocean: Stable isotopes recorded at Ocean Drilling Program Site 865, Allison Guyot, Paleoceanography, 10, 841–865, https://doi.org/10.1029/95PA01143, 1995.
Brown, S. and Elderfield, H.: Variations in Mg Ca and Sr Ca ratios of planktonic foraminifera caused by postdepositional dissolution: Evidence of shallow Mg-dependent dissolution, Paleoceanography, 11, 543–551, https://doi.org/10.1029/96PA01491, 1996.
Bukry, D.: Discoaster evolutionary trends, Micropaleontology, 17, 43–52, https://doi.org/10.2307/1485036, 1971a.
Bukry, D.: Cenozoic calcareous nannofossils from the Pacific ocean, T. San Diego Soc. Nat. Hist., 16, 303–328, https://doi.org/10.5962/bhl.part.15464, 1971b.
Burns, D.: Distribution, abundance, and preservation of nannofossils in Eocene to Recent Antarctic sediments. New Zeal. J. Geol. Geophys., 18(, 583–595, https://doi.org/10.1080/00288306.1975.10421558, 1975.
Clark, A., Jaggi, M., Bernasconi, S., Fiebig, J., and Stoll, H.: Clumped Isotope Temperatures of Coccolithophores From Global Sediment Traps, Paleoceanogr. Paleoclimatol., 40, 2081–2101, https://doi.org/10.1029/2024PA005054, 2025a.
Clark, A., Gonzalez-Lanchas, A., Bachmakova, K., Jaggi, M., and Stoll, H.: Supplementary material to Quantification of diagenetic overgrowth in early Eocene calcareous nannofossils through circular polarised light microscopy, ETH Zürich Research Collection [data set], http://hdl.handle.net/20.500.11850/783016 (last access: 11 December 2025), 2025b.
Claxton, L., McClelland, H., Hermoso, M., and Rickaby, R.: Eocene emergence of highly calcifying coccolithophores despite declining atmospheric CO2, Nat. Geosci., 15, 826–831, https://doi.org/10.1038/s41561-022-01006-0, 2022.
Dean, C. L., Harvey, E. L., Johnson, M. D., and Subhas, A. V.: Microzooplankton grazing on the coccolithophore Emiliania huxleyi and its role in the global calcium carbonate cycle, Sci. Adv., 10, https://doi.org/10.1126/sciadv.adr5453, 2024.
Dedert, M., Stoll, H., Kars, S., Young, J., Shimizu, N., Kroon, D., Lourens, L., and Ziveri, P.: Temporally variable diagenetic overgrowth on deep-sea nannofossil carbonates across Palaeogene hyperthermals and implications for isotopic analyses, Mar. Micropaleontol., 107, 18–31, https://doi.org/10.1016/j.marmicro.2013.12.004, 2014.
D'haenens, S., Bornemann, A., Stassen, P., and Speijer, R.: Multiple early Eocene benthic foraminiferal assemblage and δ13C fluctuations at DSDP Site 401 (Bay of Biscay – NE Atlantic), Mar. Micropaleontol., 88–89, 15–35, https://doi.org/10.1016/j.marmicro.2012.02.006, 2012.
D'Onofrio, R., Luciani, V., Fornaciari, E., Giusberti, L., Boscolo Galazzo, F., Dallanave, E., Westerhold, T., Sprovieri, M., and Telch, S.: Environmental perturbations at the early Eocene ETM2, H2, and I1 events as inferred by Tethyan calcareous plankton (Terche section, northeastern Italy), Paleoceanography, 31, 1225–1247, https://doi.org/10.1002/2016PA002940, 2016.
Flores, J. and Sierro, F.: Revised Technique for Calculation of Calcareous Nannofossil Accumulation Rates, Micropaleontology, 43, 321–324, https://doi.org/10.2307/1485832, 1997.
Fuertes, M., Flores, J., and Sierro, F.: The use of circularly polarized light for biometry, identification and estimation of mass of coccoliths, Mar. Micropaleontol., 113, 44–55, https://doi.org/10.1016/j.marmicro.2014.08.007, 2014.
Gerotto, A., Zhang, H., Nagai, R., Stoll, H., Figueira, R., Liu, C., and Hernández-Almeida, I.: Fossil coccolith morphological attributes as a new proxy for deep ocean carbonate chemistry, Biogeosciences, 20, 1725–1739, https://doi.org/10.5194/bg-20-1725-2023, 2023.
Gibbs, S., Shackleton, N., and Young, J.: Identification of dissolution patterns in nannofossil assemblages: A high-resolution comparison of synchronous records from Ceara Rise, ODP Leg 154, Paleoceanography, 19, https://doi.org/10.1029/2003PA000958, 2004.
González-Lemos, S., Guitián, J., Fuertes, M.-Á., Flores, J.-A., and Stoll, H.: Technical note: An empirical method for absolute calibration of coccolith thickness, Biogeosciences, 15, 1079–1091, https://doi.org/10.5194/bg-15-1079-2018, 2018.
Greene, S., Ridgwell, A., Kirtland Turner, S., Schmidt, D., Pälike, H., Thomas, E., Greene, L., and Hoogakker, B.: Early Cenozoic decoupling of climate and carbonate compensation depth trends, Paleoceanogr. Paleoclimatol., 34, 930–945, https://doi.org/10.1029/2019PA003601, 2019.
Guitián, J., Dunkley Jones, T., Hernández-Almeida, I., Löffel, T., and Stoll, H.: Adaptations of Coccolithophore Size to Selective Pressures During the Oligocene to Early Miocene High CO2 World, Paleoceanogr. Paleoclimatol., 35, e2020PA003918, https://doi.org/10.1029/2020PA003918, 2020.
Guitián, J., Fuertes, M., Flores, J., Hernández-Almeida, I., and Stoll, H.: Variation in calcification of Reticulofenestra coccoliths over the Oligocene-Early Miocene, Biogeosciences, 19, 5007–5019, https://doi.org/10.5194/bg-19-5007-2022, 2022.
Hassenkam, T., Johnsson, A., Bechgaard, K., and Stipp, S.: Tracking single coccolith dissolution with picogram resolution and implications for CO2 sequestration and ocean acidification, P. Natl. Aca. Sci. USA, 108, 8571–8576, https://doi.org/10.1073/pnas.1009447108, 2011.
Henriksen, K., Young, J., Brown, P., and Stipp, S.: Coccolith biomineralisation studied with atomic force microscopy, Palaeontology, 47, 725–743, https://doi.org/10.1111/j.0031-0239.2004.00385.x, 2004.
Honjo, S.: Dissolution of suspended coccoliths in the deep-sea water column and sedimentation of coccolith ooze, in: Dissolution of Deep-sea Carbonates No. 13, edited by: Sliter, W., Bé, A., and Berger, W., Cushman Foundation for Foraminiferal Research, 87–113, ISBN 9781970168075, 1975.
Kennett, J. and Stott, L.: 49. Proteus and proto-oceanus: ancestral Paleogene oceans as revealed from Antarctic stable isotopic results; ODP leg 113, Proceedings of the Ocean Drilling Program, Scientific Results, 113, 865–880, 1990.
Kennett, J., Houtz, R., Andrews, P., Edwards, A., Gostin, V., Hajós, M., Hampton, M., Jenkins, D., Margolis, S., Thomas Ovenshine, A., and Perch-Nielsen, K.: 44. Cenozoic Paleoceanography in the southwest Pacific Ocean, Antarctic glaciation, and the development of the circum-Antarctic Current, Initial Rep. Deep Sea, 29, 1155–1169, 1975.
Kirtland Turner, S., Sexton, P., Charles, C., and Norris, R.: Persistence of carbon release events through the peak of early Eocene global warmth, Nat. Geosci., 7, 748–751, https://doi.org/10.1038/NGEO2240, 2014.
Langer, G., Nehrke, G., and Jansen, S.: Dissolution of Calcidiscus leptoporus coccoliths in copepod guts? A morphological study, Mar. Ecol.-Prog. Ser., 331, 139–146, https://doi.org/10.3354/meps331139, 2007.
Madras, G. and McCoy, B.: Ostwald ripening with size-dependent rates: Similarity and power-law solutions, J. Chem. Phys., 117, 8042–8049, https://doi.org/10.1063/1.1510769, 2002.
Mather, B., Müller, R., Zahirovic, S., Cannon, J., Chin, M., Ilano, L., Wright, N. M., Alfonso, C., Williams, S., Tetley, M., and Merdith, A.: Deep time spatio-temporal data analysis using pyGPlates with PlateTectonicTools and GPlately, Geosci. Data J., 11, 3–10, https://doi.org/10.1002/gdj3.185, 2023.
Mattioli, E.: Nannoplankton productivity and diagenesis in the rhythmically bedded Toarcian-Aalenian Fiuminata section (Umbria-Marche Apennine, central Italy), Palaeogeogr. Palaeoclimatol., 130, 113–133, https://doi.org/10.1016/S0031-0182(96)00127-7, 1997.
Milliman, J. D., Troy, P. J., Balch, W. M., Adams, A. K., Li, Y.-H., and Mackenzie, F. T.: Biologically mediated dissolution of calcium carbonate above the chemical lysocline?, Deep-Sea Res. Pt. I, 46, 1653–1669, https://doi.org/10.1016/S0967-0637(99)00034-5, 1999.
Nomura, R., Hiroyuki, T., and Tsujimoto, A.: Data report: early to middle Eocene benthic foraminifers at Sites U1331 and U1333, equatorial central Pacific Ocean, Expedition 320/321, in: Proceedings of the Integrated Ocean Drilling Program, 320–321, https://doi.org/10.2204/iodp.proc.320321.212.2013, 2013.
Pak, D. and Miller, K.: 8. Isotopic and faunal record of Paleogene deep-water transitions in the north Pacific, Proceedings of the Ocean Drilling Program, Scientific Results, 145, 265–281, 1995.
Pälike, H., Lyle, M., Nishi, H., Raffi, I., Ridgwell, A., Gamage, L., Klaus, A., Acton, G., Anderson, L., Backman, J., Baldauf, J., Beltran, C., Bohaty, S., Bown, P., Busch, W., Channell, J., Chun, C., Delaney, M., Dewangan, P., Dunkley Jones, T., Edgar, K., Evans, H., Fitch, P., Foster, G., Gussone, N., Hasegawa, H., Hathorne, E., Hayashi, H., Herrle, J., Holbourn, A., Hovan, S., Hyeong, K., Iijima, K., Ito, T., Kamikuri, S., Kimoto, K., Kuroda, J., Leon-Rodriguez, L., Malinverno, A., Moore Jr, T., Murphy, B., Murphy D., Nakamura, H., Ogane, K., Ohneiser, C., Richter, C., Robinson, R., Rohling, E., Romero, O., Sawada, K., Scher, H., Schneider, L., Sluijs, A., Takata, H., Tian, J., Tsujimoto, A., Wade, B., Westerhold, T., Wilkens, R., Williams, T., Wilson, P., Yamamoto, Y., Yamamoto, S., Yamazaki, T., and Zeebe, R.: A Cenozoic record of the equatorial Pacific carbonate compensation depth, Nature, 488, 609–614, https://doi.org/10.1038/nature11360, 2012.
Paul, H., Zachos, J., Flower, B., and Tripati, A.: Orbitally induced climate and geochemical variability across the Oligocene/Miocene boundary, Paleoceanography, 15, 471–485, https://doi.org/10.1029/1999PA000443, 2000.
Pearson, P. and Burgess, C.: Foraminifer test preservation and diagenesis: Comparison of high latitude Eocene sites, Geol. Soc. Spec. Publ., 303, 59–72, https://doi.org/10.1144/SP303.5, 2008.
Pige, N., Suan, G., Buiron, E., Langlois, V. J., Mehir, A., Vincon-Laugier, A., and Mattioli, E.: Microfossil fragmentation across the Paleocene-Eocene transition at ODP Site 1209 (North Pacific): Implication for reconstructing nannofossil fluxes, Mar. Micropaleontol., 179, 102213, https://doi.org/10.1016/j.marmicro.2023.102213, 2023.
Rickaby, R., Henderiks, J., and Young, J.: Perturbing phytoplankton: Response and isotopic fractionation with changing carbonate chemistry in two coccolithophore species, Clim. Past, 6, 771–785, https://doi.org/10.5194/cp-6-771-2010, 2010.
Roth, P. and Berger, W.: Distribution and dissolution of coccoliths in the south and central Pacific, in: Dissolution of Deep-sea Carbonates No. 13, edited by: Sliter, W., Bé, A., and Berger, W., Cushman Foundation for Foraminiferal Research, 87–113, ISBN 9781970168075, 1975.
Roth, P. and Thierstein, H.: 14. Calcareous nannoplankton: leg 14 of the deep sea drilling project, Initial Rep. Deep Sea Drilling Project, 14, 421–485, 1972.
Sand, K., Pedersen, C., Sjöberg, S., Nielsen, J., Makovicky, E., and Stipp, S.: Biomineralization: Long-term effectiveness of polysaccharides on the growth and dissolution of calcite, Cryst. Growth Des., 14, 5486–5494, https://doi.org/10.1021/cg5006743, 2014.
Schneider, L., Bralower, T., and Kump, L.: Response of nannoplankton to early Eocene ocean destratification, Palaeogeogr. Palaeoclimatol., 310, 152–162, https://doi.org/10.1016/j.palaeo.2011.06.018, 2011.
Scotese, C. R.: PALEOMAP PaleoAtlas for GPlates and the PaleoData Plotter Program, PALEOMAP Project, http://www.earthbyte.org/paleomap-paleoatlas-for-gplates/ (last access: 11 December 2025), 2016.
Shamrock, J., Watkins, D., and Johnston, K.: Eocene biogeochronology and magnetostratigraphic revision of ODP Hole 762C, Exmouth Plateau (Northwest Australian Shelf), Stratigraphy, 9, 55–75, 2012.
Siesser, W. and Bralower, T.: 36. Cenozoic calcareous nannofossil biostratigraphy on the Exmouth Plateau, eastern Indian Ocean, Proceedings of the Ocean Drilling Program, Scientific Results, 122, 601–631, 1992.
Slotnick, B., Lauretano, V., Backman, J., Dickens, G., Sluijs, A., and Lourens, L.: Early Paleogene variations in the calcite compensation depth: new constraints using old borehole sediments from across Ninetyeast Ridge, central Indian Ocean, Clim. Past, 11, 473–493, https://doi.org/10.5194/cp-11-473-2015, 2015.
Stassen, P., Thomas, E., and Speijer, R.: Paleocene-Eocene Thermal Maximum environmental change in the New Jersey Coastal Plain: Benthic foraminiferal biotic events, Mar. Micropaleontol., 115, 1–23, https://doi.org/10.1016/j.marmicro.2014.12.001, 2015.
Stewart, D., Pearson, P., Ditchfield, P., and Singano, J.: Miocene tropical Indian Ocean temperatures: Evidence from three exceptionally preserved foraminiferal assemblages from Tanzania, J. Afr. Earth Sci., 40, 173–189, https://doi.org/10.1016/j.jafrearsci.2004.09.001, 2004.
Su, X., Baumann, K.-H., and Thiede, J.: 4. Calcareous nannofossils from leg 168: Biochronology and diagenesis, Proceedings of the Ocean Drilling Program, Scientific Results, 168, 39–49, 2000.
Sulpis, O., Jeansson, E., Dinauer, A., Lauvset, S. K., and Middelburg, J. J.: Calcium carbonate dissolution patterns in the ocean, Nat. Geosci., 14, 423–428, https://doi.org/10.1038/s41561-021-00743-y, 2021.
Takeda, K. and Kaiho, K.: Faunal turnovers in central Pacific benthic foraminifera during the Paleocene-Eocene thermal maximum, Palaeogeogr. Palaeoclimatol., 251, 175–197, https://doi.org/10.1016/j.palaeo.2007.02.026, 2007.
Thierstein, H. and Roth, P.: Stable isotopic and carbonate cyclicity in Lower Cretaceous deep-sea sediments: Dominance of diagenetic effects, Mar. Geol., 97, 1–34, https://doi.org/10.1016/0025-3227(91)90017-X, 1991.
Tremolada, F., De Bernardi, B., and Erba, E.: Size variations of the calcareous nannofossil taxon Discoaster multiradiatus (Incertae sedis) across the Paleocene-Eocene thermal maximum in ocean drilling program holes 690B and 1209B, Mar. Micropaleontol., 67, 239–254, https://doi.org/10.1016/j.marmicro.2008.01.010, 2008.
Turchyn, A., Bradbury, H., Walker, K., and Sun, X.: Controls on the Precipitation of Carbonate Minerals Within Marine Sediments, Front. Earth Sci., 9, 618311, https://doi.org/10.3389/feart.2021.618311, 2021.
Viganò, A., Dallanave, E., Alegret, L., Westerhold, T., Sutherland, R., Dickens, G. R., Newsam, C., and Agnini, C.: Calcareous nannofossil biostratigraphy and biochronology across the Eocene-Oligocene transition: the record at IODP Site U1509 (Tasman Sea) and a global overview, Newsl. Stratigr., 57, 1–23, https://doi.org/10.1127/nos/2023/0751, 2023.
Westerhold, T., Röhl, U., Donner, B., and Zachos, J.: Global Extent of Early Eocene Hyperthermal Events: A New Pacific Benthic Foraminiferal Isotope Record From Shatsky Rise (ODP Site 1209), Paleoceanogr. Paleoclimatol., 33, 626–642, https://doi.org/10.1029/2017PA003306, 2018.
Widmark, J. and Malmgren, B.: Biogeography of terminal Cretaceous deep-sea benthic foraminifera from the Atlantic and Pacific Oceans, Palaeogeogr. Palaeoclimatol., 92, 375–405, 1992.
Young, J. and Ziveri, P.: Calculation of coccolith volume and its use in calibration of carbonate flux estimates, Deep-Sea Res. Pt. II, 47, 1679–1700, https://doi.org/10.1016/S0967-0645(00)00003-5, 2000.
Young, J., Davis, S., Bown, P., and Mann, S.: Coccolith ultrastructure and biomineralization, J. Struct. Biol., 126, 195–215, https://doi.org/10.1006/jsbi.1999.4132, 1999.
Young, J., Bown, P., and Lees, J.: Nannotax3 website, https://www.mikrotax.org/Nannotax3/ (last access: 31 July 2025), 2025.
Zachos, J. and Arthur, M.: Paleoceanography of the Cretaceous/Tertiary Boundary Event: Inferences from stable isotopic and other data, Paleoceanography, 1, 5–26, https://doi.org/10.1029/PA001i001p00005, 1986.
Zahirovic, S., Eleish, A., Doss, S., Pall, J., Cannon, J., Pistone, M., and Fox, P.: Subduction kinematics and carbonate platform interactions, Geosci. Data J., 9, 371–383, https://doi.org/10.1002/gdj3.146, 2022.
Zeebe, R. and Tyrrell, T.: History of carbonate ion concentration over the last 100 million years II: Revised calculations and new data, Geochim. Cosmochim. Ac., 257, 373–392, https://doi.org/10.1016/j.gca.2019.02.041, 2019.