the Creative Commons Attribution 4.0 License.
the Creative Commons Attribution 4.0 License.
 | 11 Feb 2026
Developing a new species-level database of Cretaceous calcareous nannoplankton occurrences – Uneptune
Yi Zhang
Jeremy R. Young
Paul R. Bown
Chengshan Wang
Xi Chen
Calcareous nannofossils are abundant and globally distributed fossils that are widely used in the study of stratigraphy and palaeoclimate. A large number of nannofossil data have been generated over the past several decades, but the information is distributed across the published scientific literature in a wide variety of formats, and data compilation has focussed on the Cenozoic. In Cretaceous marine sediments, nannofossils are a key group of microfossils, and they have been extensively studied for both biostratigraphy and palaeoceanography. However, only a fraction of these data have been compiled. In order to exploit this archive of palaeontological information, we have (1) extended the capabilities of the Mikrotax database system to allow compilation of occurrence data, (2) tested this by compiling a large set of Cretaceous nannofossil occurrence records (Uneptune database), and (3) developed a suite of tools for displaying these data on the Nannotax database system, including biogeographic maps, time–latitude plots, and occurrence frequency range charts. For the Uneptune database, we selected a range of published high-quality Cretaceous nannofossil datasets, screening the data to standardise the taxonomy and revise the age models where appropriate. The resulting database includes around 7000 samples, 500 species, and 175 000 occurrence records, which is 3 times the size of the previous largest Neptune Cretaceous database.
- Article
(4096 KB) - Full-text XML
- BibTeX
- EndNote


Micropalaeontological studies typically generate huge amounts of information relating to taxonomy (what fossils are), stratigraphy (when fossils occurred), biogeography (where fossils occurred), and abundance (how many fossils there were). It is quite normal for thousands of specimens to be identified from hundreds of samples during a single research project. Such projects are typically conducted in order to address immediate questions such as determining the age or palaeoenvironments of a section, but the data accumulated have the potential to be used in other contexts. Large-scale compilation and exploitation of such data have become increasingly attractive in recent years in both academic and industrial contexts for various reasons: the volume of available data has become very large; there is interest in addressing large-scale questions such as how climate has evolved; and the information systems for gathering, storing, and querying large data have rapidly evolved, driving a shift toward data-driven scientific discovery projects (Reichstein et al., 2019; Bergen et al., 2019; Young, 2022).
Within the field of plankton micropalaeontology, the Neptune database (Lazarus, 1994; Spencer-Cervato, 1999; Renaudie et al., 2020) has been conspicuously successful. The database was initially produced in the 1990s by a team from ETH-Zurich with the aim of synthesising occurrence records of planktonic microfossils from ocean drilling. The team compiled records from 500 holes and 60 000 samples, including records of 7000 species ranging in age from Cretaceous to the present day. This freely accessible database was in turn used by many workers to investigate patterns of microfossil evolution and response to environmental change (e.g. Spencer-Cervato, 1999; Finkel et al., 2005; Kucera and Schönfeld, 2007; Rabosky and Sorhannus, 2009).
Whilst the Neptune database has most often been used for the study of large-scale patterns, its value for documenting patterns at species level has also been demonstrated through the Nannotax and pforams@mikrotax web taxonomy databases (Young et al., 2019). These databases aim to provide users of microfossil data with a convenient reference source of taxonomic data, including original descriptions, modern taxonomic concepts, images, references, and stratigraphic range data. To complement expert-opinion-based data on the stratigraphic range of species, Nannotax and pforams@mikrotax use the Neptune database to provide plots of occurrence records for each species. Obvious problems in doing this were that (1) the Neptune database has very uneven sampling, with heavy weighting toward the modern, and that (2) the database does not have a system for consistently recording abundance, so in essence it only has presence–absence data. To compensate for this, the metric plotted in Nannotax is occurrence frequency – the proportion of samples in a time bin in which the taxon occurs. This is a simple metric, but it has proven very useful – occurrence frequency plots provide in effect a proxy record of relative abundance, which closely corresponds to the experience of expert biostratigraphers, and these plots are provided on all species pages of Nannotax and pforams@mikotax (Fig. 1). The Neptune data are not perfect, since poorly dated samples, reworked specimens, and dubious identifications can be included, but these plots still provide valuable guides to the distribution of the species in a way which would be very hard to produce through text descriptions (Young et al., 2019).
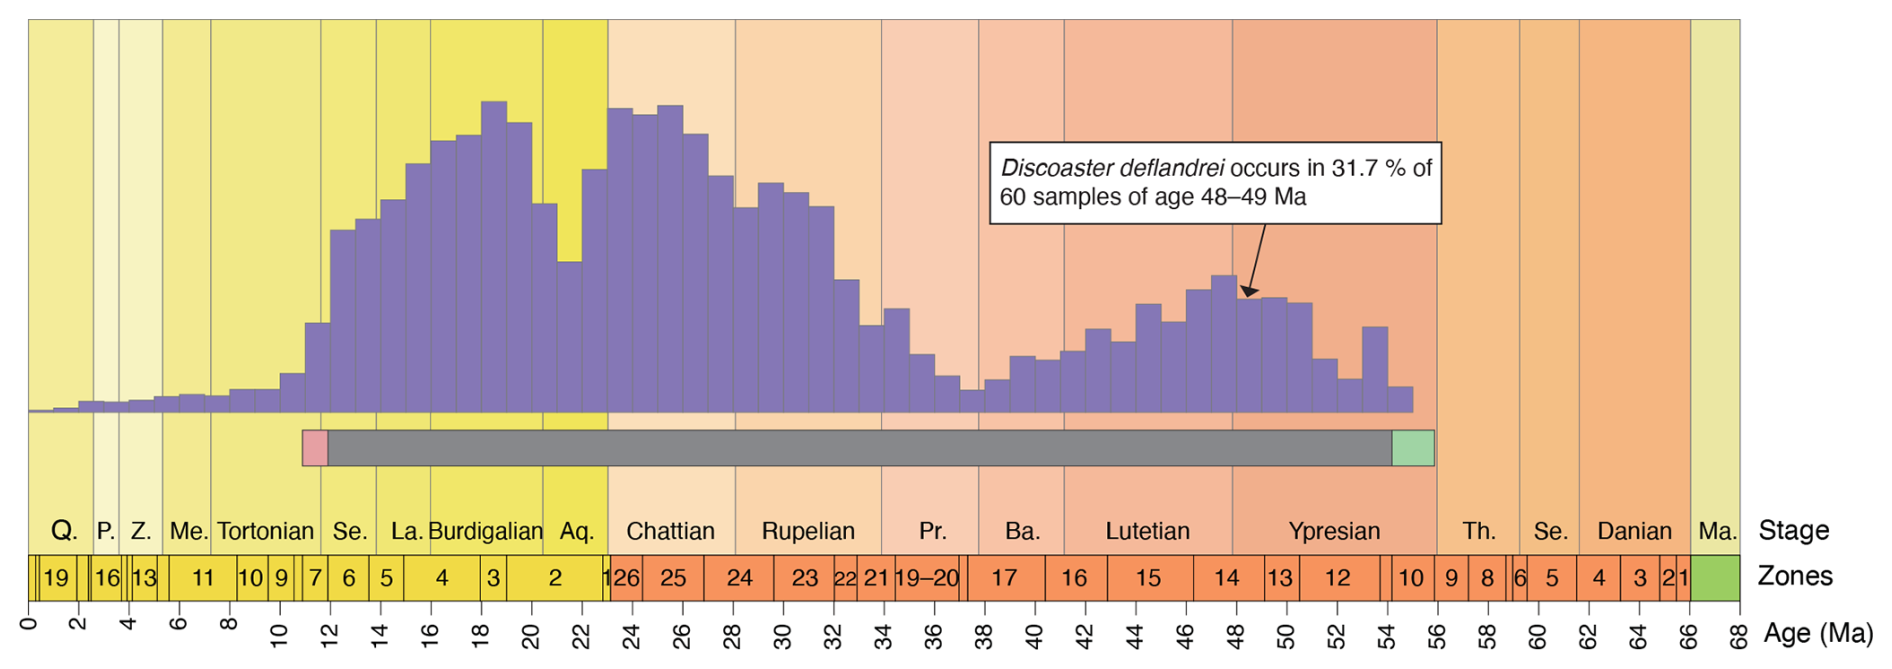
Figure 1Example of Nannotax plotting of occurrence frequency data from the Neptune database. The Nannotax and pforams@mikrotax show the Neptune data as bar charts, with each bar representing the occurrence frequency of a species within a 1 Ma bin. For comparison, the total species range based on expert opinion is shown as a horizontal bar. Although Neptune data provide only a rough model for precise ranges, they offer a rich dataset for tracking changes in frequency distribution through time. Abbreviations: Q, Quaternary; P, Piacenzian; Z, Zanclean; Me, Messinian; Se, Serravallian; La, Langhian; Aq, Aquitanian; Pr, Priabonian; Ba, Bartonian; Th, Thanetian; Se, Selandian; Ma, Maastrichtian.
The success of Neptune has been followed by various other projects, most notably Triton (Fenton et al., 2021; Dunhill et al., 2021), which aimed to expand the Neptune approach by incorporating data from both recent deep-sea drilling and a range of other sources to produce a much larger compilation of Cenozoic planktonic foraminifer occurrence records. Again, this has proven a very productive effort, with the database being used to support a range of high-profile studies (e.g. Fenton et al., 2023; Woodhouse et al., 2023). The Triton database project, like the Neptune project, produced the database without user-friendly visualisation tools. As with the Neptune project, we have taken a copy of the Triton database, reconfigured it into a more relational model, and used it on pforams@mikrotax to provide data on species occurrence. In particular, this system allows plotting of species occurrences on palaeogeographic maps and back-tracking of the data point to the original source data (Pearson et al., 2023; https://www.mikrotax.org/system/ranges-tritonbiogeog.php, last access: 31 January 2026).
The Triton project has demonstrated the potential for large-scale development of the Neptune approach, and here we document a new project to apply this to Cretaceous nannofossils. The project was developed as a collaboration between researchers at the China University of Geosciences, Beijing, and at University College London, with the dual aims of producing a Neptune-type database with greatly enhanced coverage of Cretaceous nannofossils and of developing a system integrated within Mikrotax for efficiently compiling and maintaining this type of database via webforms and online storage. The database has been developed to a stage where it represents a major improvement on the original Neptune coverage, and exploration of the dataset is in progress. This publication is intended to introduce the database and the tools available to use it and to document the database creation system.
The Uneptune database is composed of a set of mySQL tables within the Nannotax database system. The structure of the database is shown in Fig. 2a. There are three main tables: datasets, samples, and occurrences. A dataset is a set of records from a single deep-sea drilling site, or outcrop section, from a single publication or report. Typically, this information is presented as a single table in the publication. The dataset table contains metadata relating to the dataset, including the geographical location, the type of data recorded (e.g. percentage abundance, qualitative abundance, presence/absence), data source and other literature references, and notes on the study. Each sample in the dataset is recorded as one entry in the samples table, with a link back to the dataset it comes from. For samples, the essential primary data are the sample label and depth; additional data may include data on preservation, on total abundance, and on stratigraphic assignments made in the source paper (e.g. that the assemblage found was interpreted as belonging to a particular biozone). For each sample there are normally multiple occurrence records, and these are stored separately in the occurrences table; i.e. they are recording that a given taxon was observed, at a given abundance, in a given sample. The taxon identification is recorded as both the taxon label used in the original study and the interpreted identification as an “id” link to the Nannotax taxonomy (i.e. each taxon has a unique code in the database).
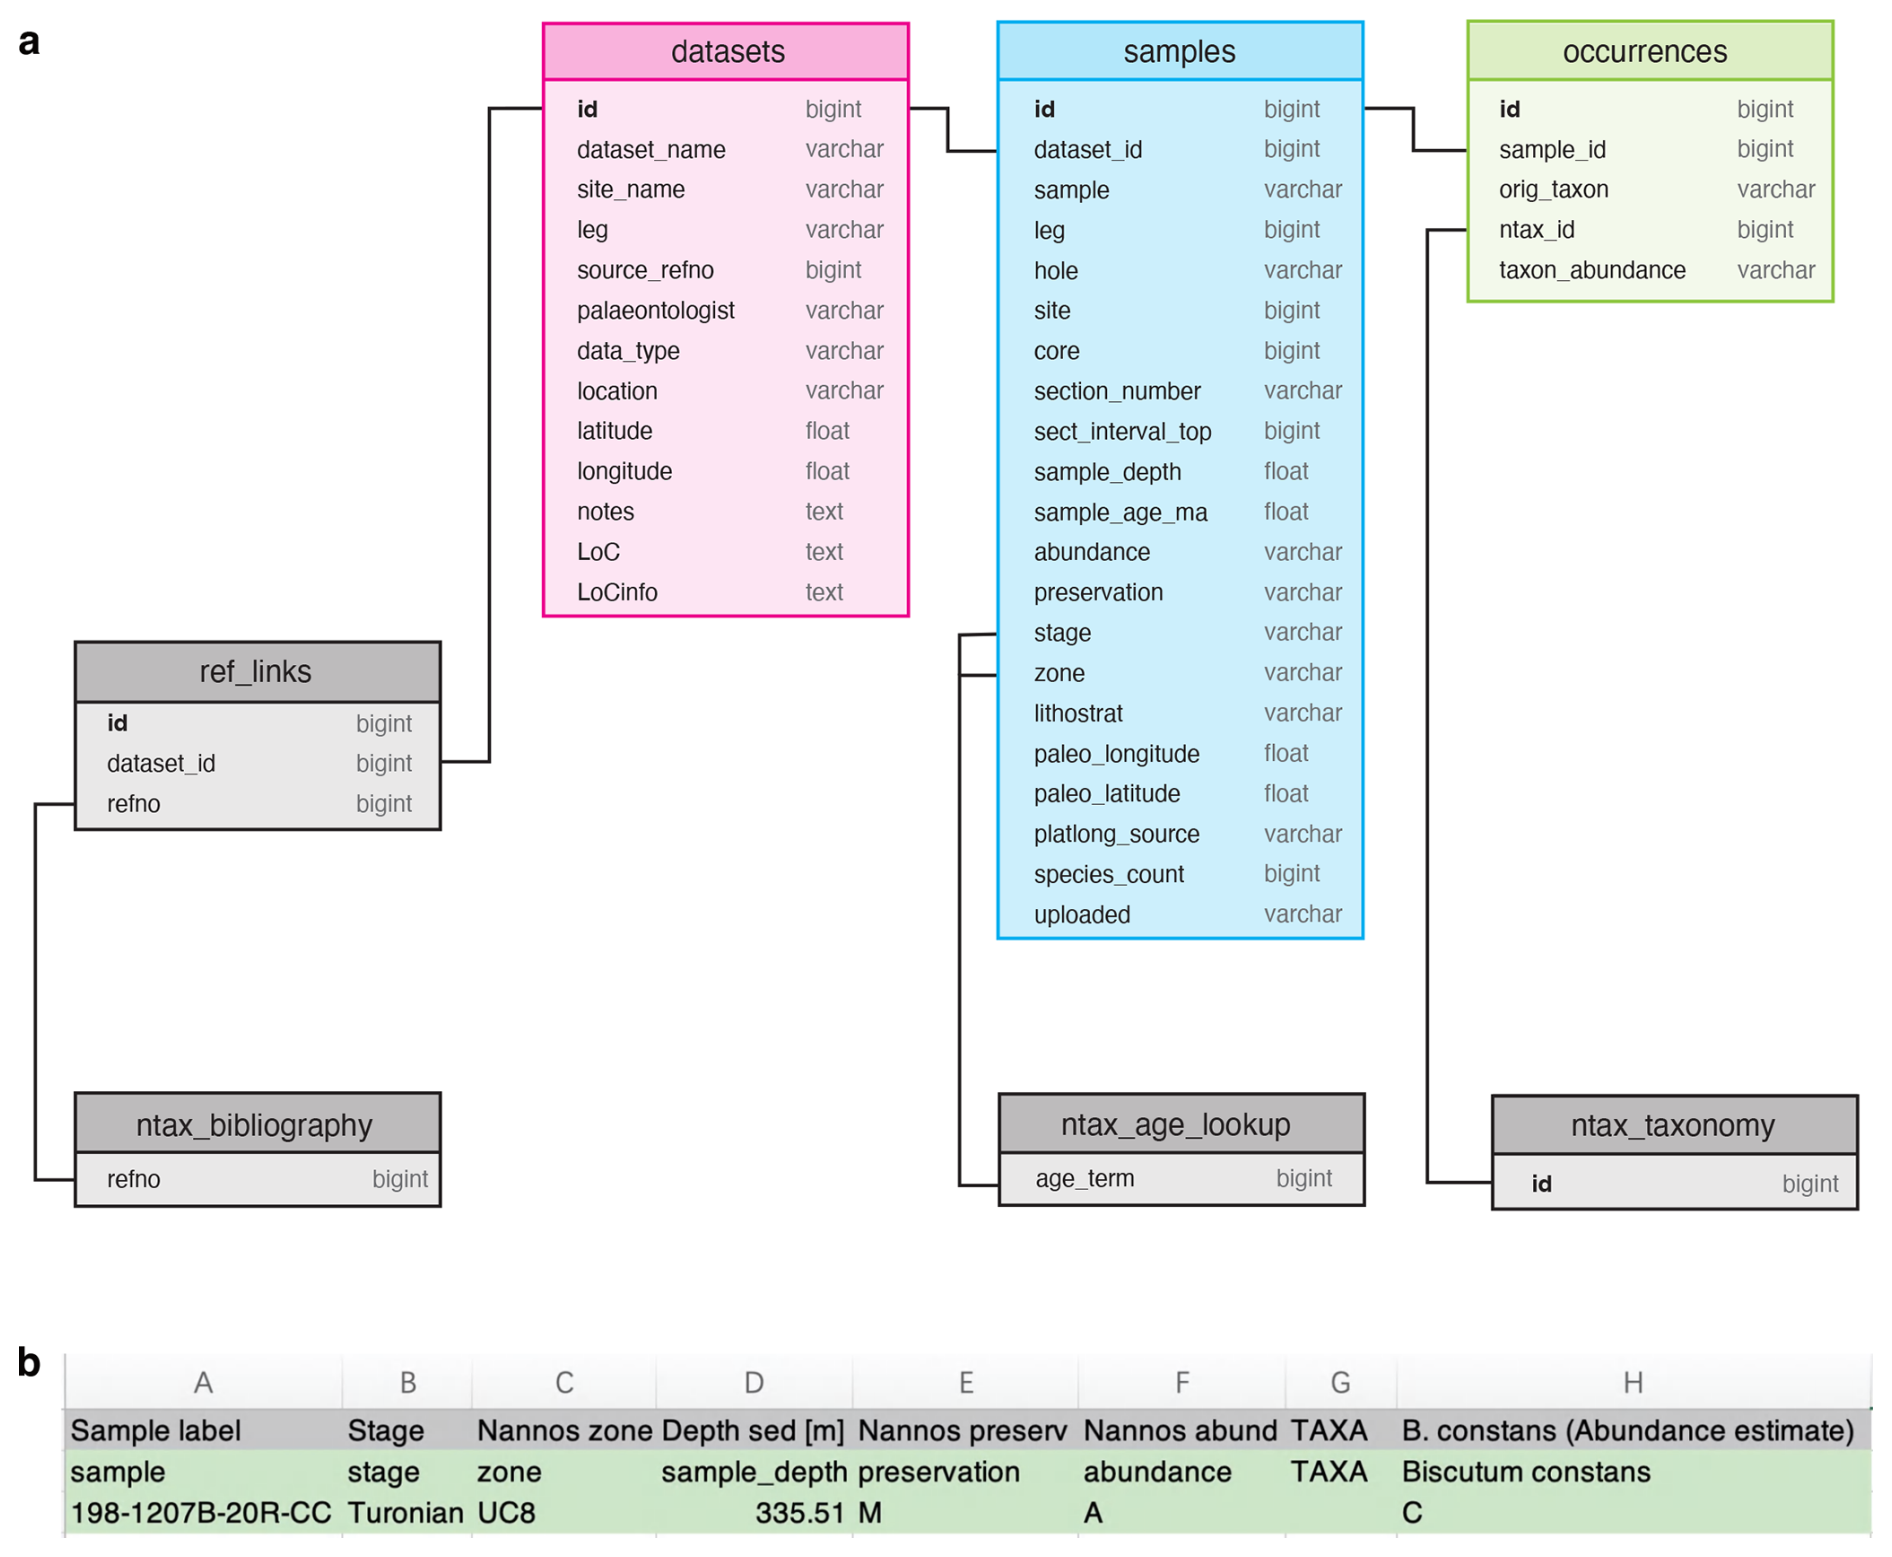
Figure 2Simplified database schema and data input example for the Uneptune system. (a) Primary data are stored in the occurrences table, with associated metadata in the samples and datasets tables. Reference data are drawn from other components of the Nannotax system, including taxonomy, age lookup (e.g. age range of zones or chronostratigraphic units), and bibliography. The diagram indicates the relevant Nannotax tables but does not show their field structure (see Young et al., 2019, for the details of these auxiliary tables). (b) Example of a reformatted input spreadsheet (data sourced from Bown, 2005). The first row retains original column headings; the second row provides the standardised headings used for database ingestion.
The relational structure adopted allows metadata to be efficiently maintained and updated. Since the database is embedded within the larger Nannotax system, the bibliography, age lookup tables, and taxonomy are provided by the Nannotax system rather than being separately created for this database. Secondary data are compiled within the system rather than coming from the primary sources, and they include the mapping of original species identifications onto Nannotax taxa, Ma age assignments, palaeolatitudes and palaeolongitudes for each sample, the line of correlation from the age model, and sample depths, if these are not explicitly given in the original publication.
The Uneptune database has a very similar data-structure to that used in Nannotax, and a large body of data was converted directly from Neptune into our database. A primary objective of the project, however, was to develop a system which would allow efficient and systematic compilation and uploading of data through the use of webforms and scripts. This process and the scripts developed are outlined here. The relevant webpages are only accessible to logged-in user-editors, but the approach would be applicable to other systems and the php scripts are available on request.
The first step of data acquisition is to find the data source. We used only published data, with data tables coming from tables included in the publication, as supplementary data or deposited separately in data repositories such as PANGAEA (Diepenbroek et al., 1999, 2002). For the current stage of database development, we focussed on PANGAEA and carried out an extensive search on the database for Cretaceous nannofossil occurrence datasets. This involved using targeted keyword combinations (e.g. “Cretaceous + nannofossil”) followed by a stage-by-stage verification (e.g. “Cenomanian + nannofossil”) to maximise coverage and minimise omissions. As a result, we identified relevant data from 50 publications, many with more than one data table. We also included data from Street and Bown (2000), as this was a major study of Early Cretaceous nannofossils, sourcing the original distribution charts from Street (1999).
Tables from the data sources need to be converted into consistent spreadsheet format. We used a basic format of one row per sample with the first set of columns providing sample metadata, followed by the columns of taxon occurrence data. Standard labels need to be applied to metadata columns. For each taxon, the first row represents the original label from the data source, and the second row corresponds to the standardised Nannotax name (Fig. 2b). The Nannotax names are checked through an automated process upon upload, where the system verifies the initially copied original names against the taxonomic database to reconcile synonyms and abbreviations and highlights any ambiguous names for manual checking.
Once the table has been prepared, the dataset metadata are entered via a webform and the table is uploaded. After upload, the sample metadata headings are checked, including the Nannotax names; at this stage, the system will map synonyms onto modern names and highlight any ambiguous or problematic identities which can then be corrected. Once data verification is completed, a further script parses the data into the sample and occurrence tables.
3.1 Data checking and depth
After data have been uploaded, various routines are available to check and clean up the data. In particular, it is essential to have sample depths, but in many publications dealing with deep-sea drilling sites, the sample reference is often given in site-core-section-depth format (e.g. 242-3-4 123 cm) instead of in metres below sea floor. In these cases, it is necessary to convert the sample reference into a depth. Conversely, for reference purposes, it is useful to have both the site-core-section reference and the depth. The IODP LIMs database (https://web.iodp.tamu.edu/LORE/, last access: 31 January 2026) has documentation of all deep-sea drilling cores, and it was possible to download from there a table of core depths; i.e. it records for each core the depth below sea floor of the top of the core, and from this it is possible to calculate sample depths. The Nannotax site includes a script to convert site-core-section-depth labels to metre depths or vice versa. The final database entry contains both sample depths and site-hole-core-section-interval data in consistent format.
3.2 Age models
The single most complex and time-consuming part of databasing fossil occurrence data is age model creation, i.e. converting sample depths into Ma ages (Fig. 3). To facilitate this, the Uneptune system includes an age–depth model program. This allows the plotting of calibration points from the site and the drawing of a line of correlation. The line of correlation is then both saved to the dataset table and used to calculate Ma ages for each sample in the dataset. Ages are calculated from GTS 2020 (Gradstein et al., 2020). Since the age–depth program is integrated into the system, the age model can be reviewed and edited at any stage. The program is written in javascript, and a publicly accessible version of it is available on Nannotax from the “Tools” dropdown menu (https://www.mikrotax.org/system/age-depth-plot.php, last access: 31 January 2026). This can be used to generate age models from user data or for teaching exercises.
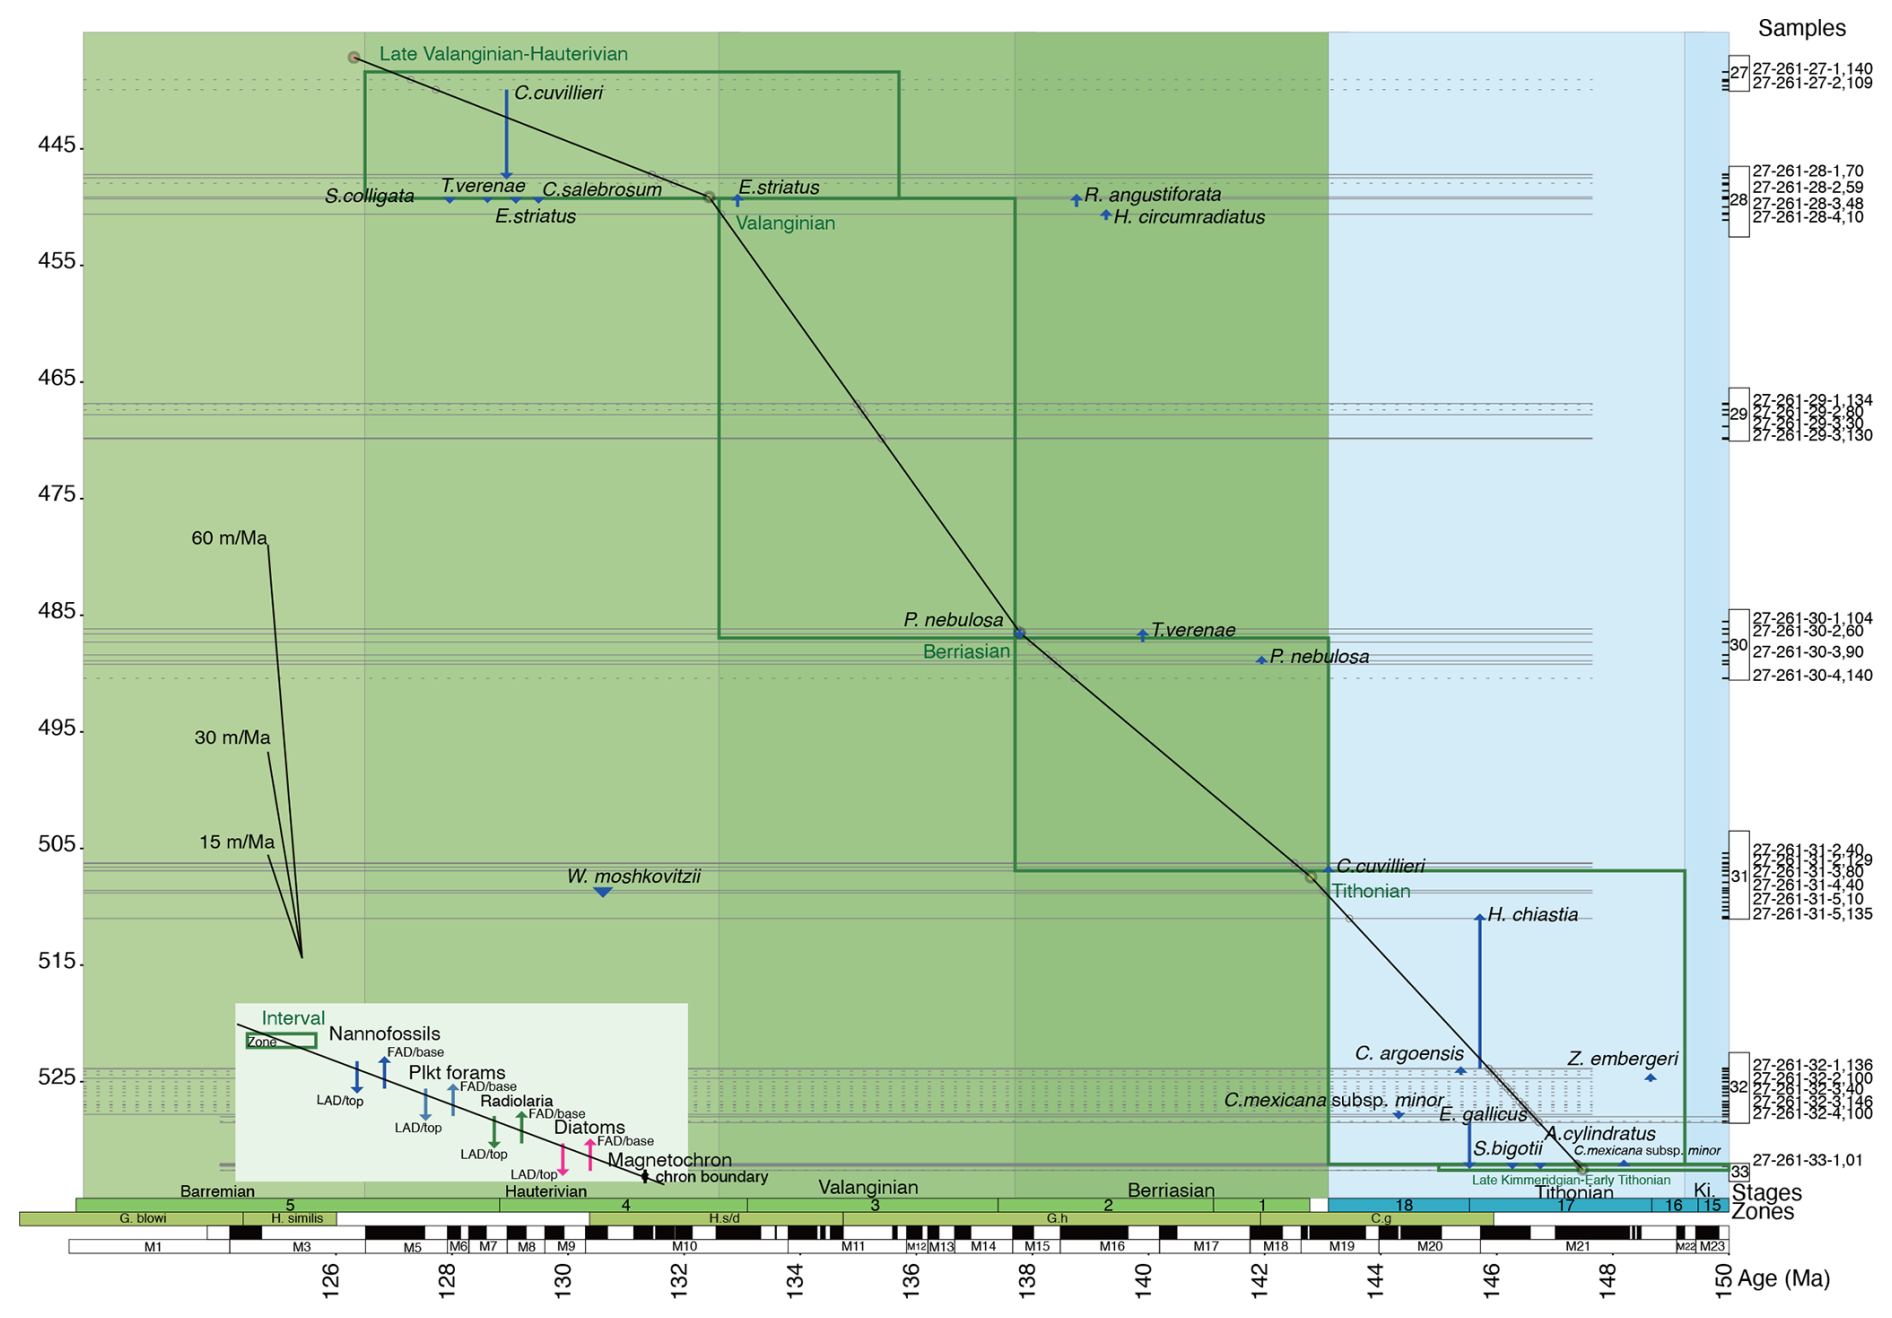
Figure 3Example of a Nannotax age–depth plot (DSDP Site 261; data from Bown, 1992). The blue arrows are nannofossil first (base) and last (top) occurrences, and the green boxes are biozonal assignments from the original paper. Horizontal lines represent samples. The line of correlation is set using movable controls, with sample ages (grey circles) projected onto it. Both age assignments and the line of correlation can be saved from this interface in the database. Ki.: Kimmeridgian. Ages are from GTS 2020 (Gradstein et al., 2020).
3.3 Palaeolatitude and palaeolongitude calculation
The final step of data compilation for a site is to calculate the palaeolatitude and palaeolongitude, based on the current geographic position and the geological age of the site. This step is not yet integrated into our system, but instead, sample lists are exported from the database and palaeolatitude–longitude pairs are calculated using routines in GPlates (https://portal.gplates.org, last access: 31 January 2026). It should be noted that, even for the Cretaceous, there are significant error margins (often ±10°), with different plate models providing different solutions, and for some locations, especially in tectonically complex areas, the models cannot provide solutions. We used the plate tectonic model by Matthews et al. (2016). This model is an updated version of the model by Seton et al. (2012) used in Neptune and is most suitable for deep-sea environments, where most samples were collected (Fenton et al., 2021). In addition, for some sites where solutions were not available from GPlates, we used the palaeolatitude website (https://paleolatitude.org, last access: 31 January 2026) or extrapolated the location downward from the last available solution. All these complications mean that palaeolocation data need to be interpreted with caution, but imperfect estimates are still much more useful than no data.
The complete dataset we have compiled is available for download and could be used for a range of palaeobiological and climatic research, as has been done with the Neptune (Lazarus, 1994; Spencer-Cervato, 1999; Renaudie et al., 2020) and Triton datasets (Fenton et al., 2021). However, we were more immediately interested in providing tools which would enable micropalaeontologists to use the data, as we have previously done with the other databases via Nannotax and Mikrotax. As noted above, with the Neptune database, we found that a useful metric to plot was the occurrence frequency of a species, i.e. the proportion of samples in which the species occurs within a particular bin defined by time and/or palaeolatitude. This occurrence frequency metric provides a proxy for relative abundance.
Most of the plotting tools have been adapted from routines developed previously for displaying the Neptune and Triton databases on the Mikrotax website. In each case, a php script runs mySQL queries on the server and the data returned are then plotted using javascript routines based on the Raphael library (https://github.com/DmitryBaranovskiy/raphael, last access: 31 January 2026). The principal tools are outlined below. Taken together, they provide a flexible system for exploring the distribution of species in space and time. Nannotax now uses the Uneptune database instead of just the Neptune database to generate the occurrence frequency plots for Cretaceous species, and this database can be queried using a range of other data plotting tools.
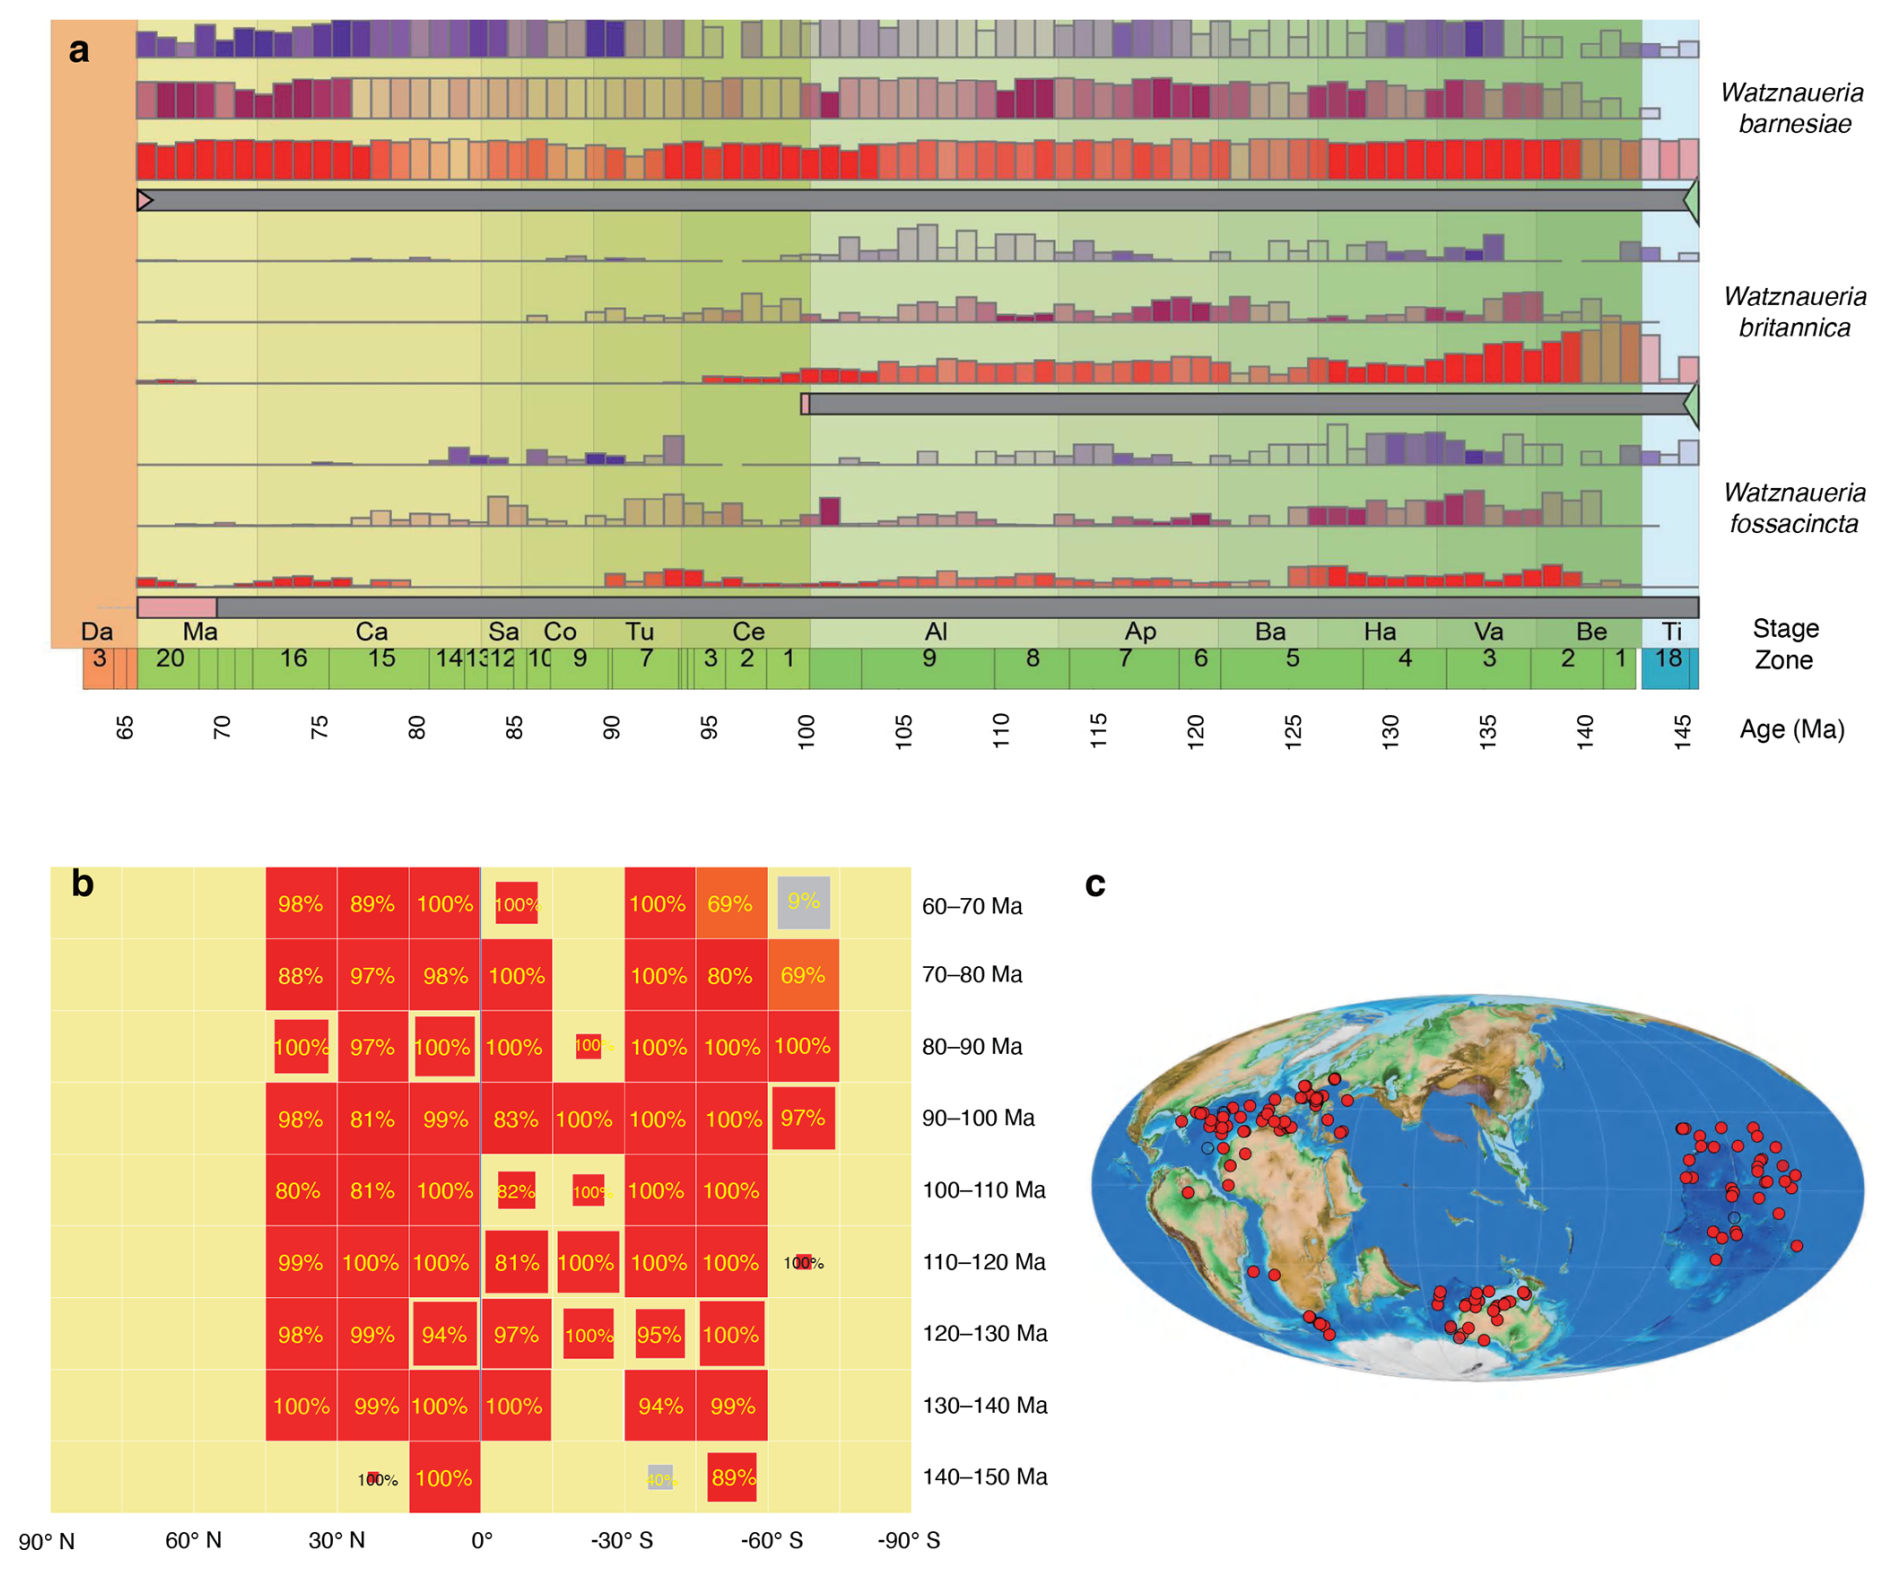
Figure 4Sample data visualisation from the Uneptune database using the tools available from the Nannotax website. (a) Range chart for the three common Watznaueria species, binned into 1 Ma intervals and subdivided by latitude (high, mid, and low). Latitude and age bins can be customised. Coloured histograms plot the frequency of occurrence of the taxon (and synonyms) in the Uneptune database. Solid colours (purple – high latitude; pink – mid-latitude; and red – low latitude) indicate bins with >50 samples per latitude category, with increasing transparency for bins with fewer samples. Range boxes (grey) display the species ranges as recorded on the Nannotax website: green shading marks the interval containing the first occurrence (base), and pink shading marks the interval containing the last occurrence (top). Triangles indicate bioevents for which a precise stratigraphic placement has been suggested (e.g. the green triangle for Watznaueria barnesiae marks the base of biozone NJT11). (b) Time–space plot of a single species, enabling more detailed analysis than the range chart; data can also be aggregated at higher taxonomic levels (e.g. genus). Box size represents the number of samples per bin. For bins with <40 samples, area scales proportionally with sample count. For bins with ≥ 40 samples, a fixed maximum area is used for visual consistency. (c) Biogeographic distribution plotted on a palaeogeographic map. All sites with samples in the time interval are plotted as circles, and the opacity of the red fill is coloured according to the occurrence frequency of the taxon.
4.1 Dataset viewer
The dataset viewer displays the reconstructed species occurrence table, the table of age events, and the age–depth plot. It is implemented on the same system page (https://www.mikrotax.org/system/unep/unep-displaydata.php, last access: 31 January 2026) that hosts the age model creation function. From the perspective of an end-user, this viewer simply provides a read-only display of the data for verification and browsing; data editing and model creation are restricted to authorised users.
4.2 Range charts
A range chart program, adapted from one used for Neptune data, allows users to plot the occurrence data through time of any set of species (Fig. 4a). With the rather large sample set in the Uneptune database, it also proved possible to subdivide the samples by palaeolatitude, and so the plotting program can provide separate plots for different palaeolatitude bands.
4.3 Time–space plots
These plots (Fig. 4b) display the occurrence frequency of a single taxon across a grid of palaeolatitude and time. They allow exploration of the distribution of single species through their geological record. There is also the related facility to select a palaeolatitude- and time-defined subset of the samples in the database and produce a table of occurrence data from that interval.
4.4 Biogeographic maps
A page allows the user to select a time interval and taxon. The page then displays a palaeogeographic map for that interval with the sites in the database having samples of that age shown and coloured according to the occurrence frequency of the taxon (Fig. 4c). The global biogeographic basemaps were generated using GPlates, at 2 Ma intervals, and are stored as static png images. The maps use the Mollweide projection to avoid the distortions of the Mercator projection whilst keeping lines of latitude horizontal. They are centred on 100° E to minimise the splitting of oceans.
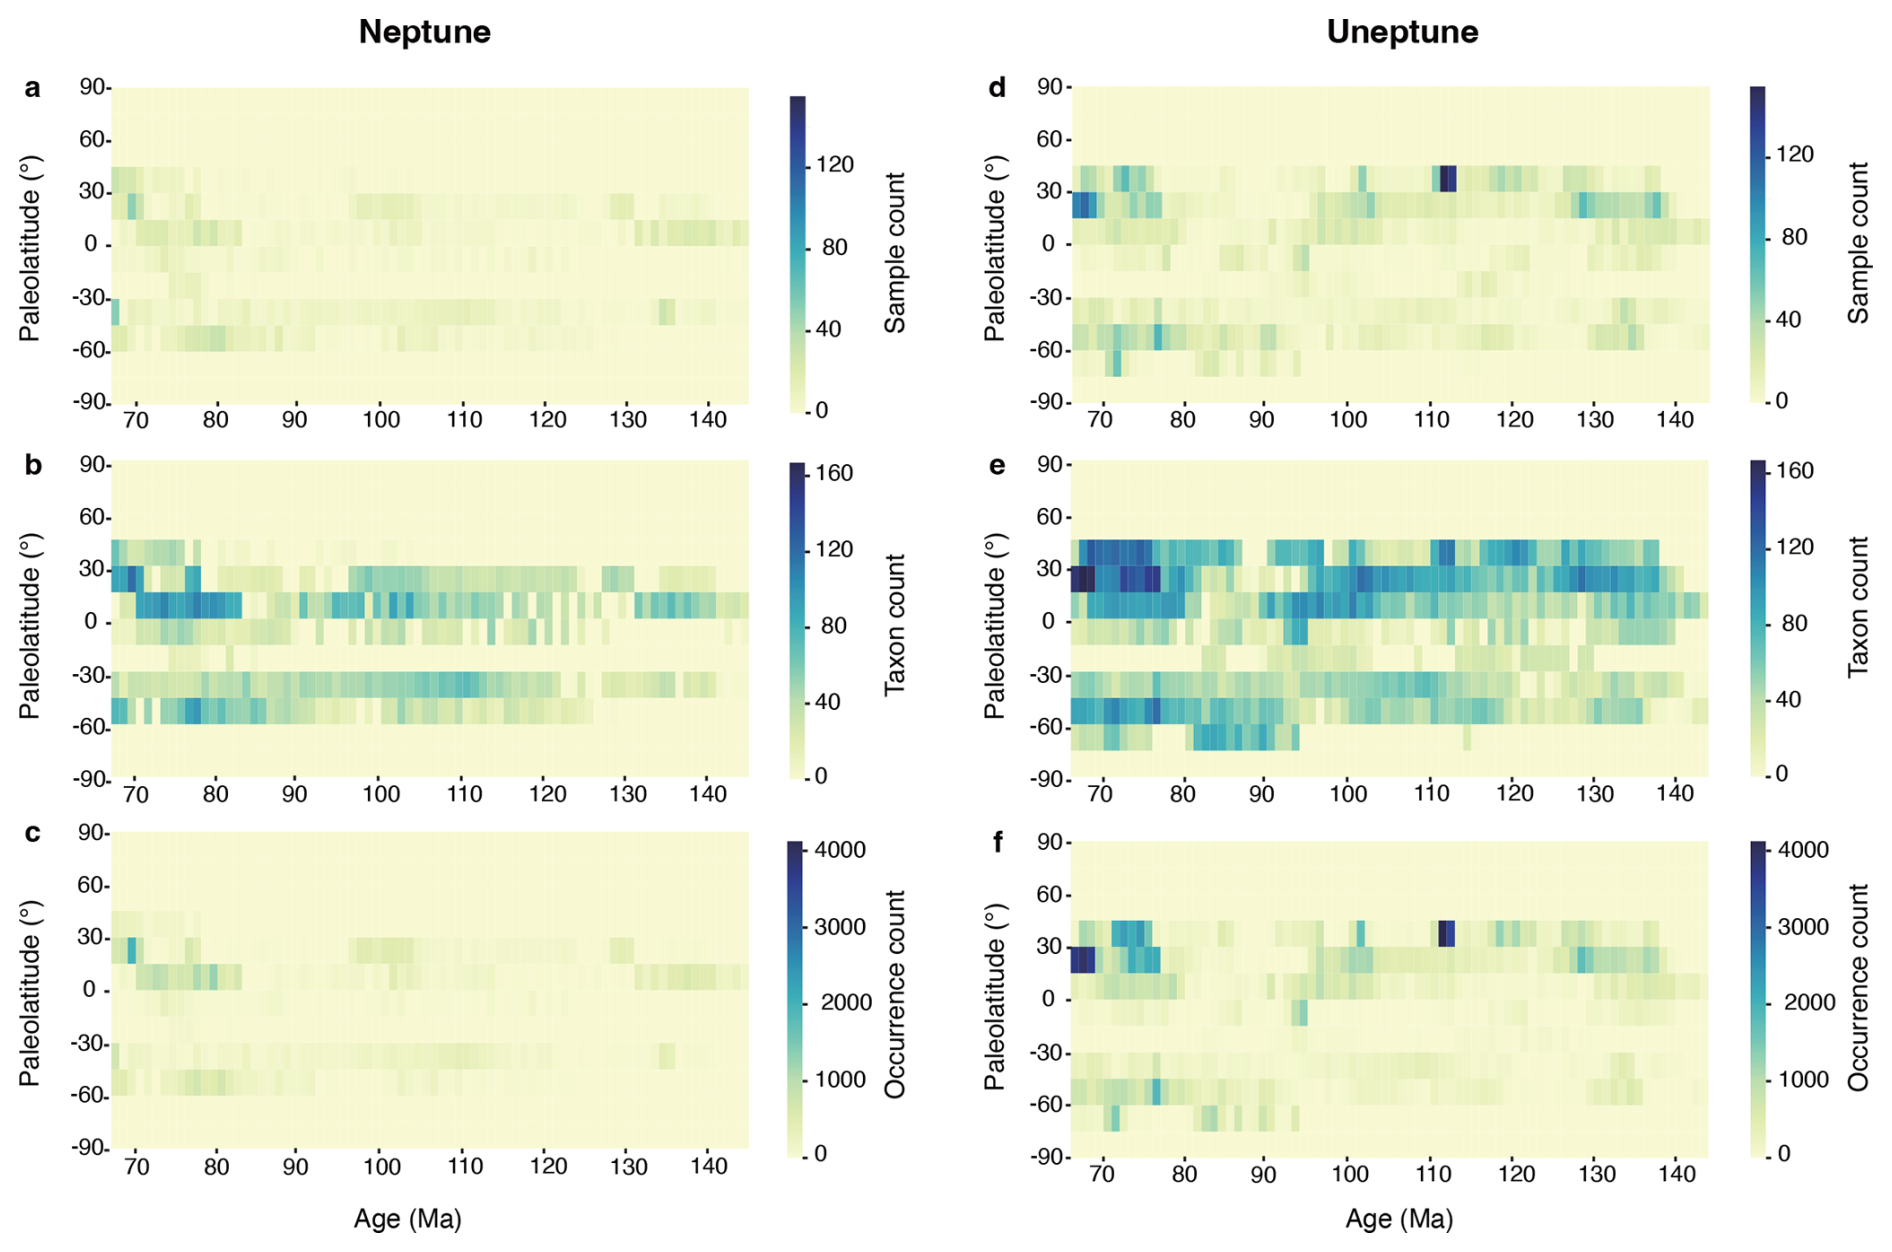
Figure 5The latitudinal spread of data through time showing the current data in Neptune and Uneptune. (a) Sample count in Neptune; (b) taxon count in Neptune; (c) occurrence count in Neptune; (d) sample count in Uneptune; (e) taxon count in Uneptune; (f) occurrence count in Uneptune.
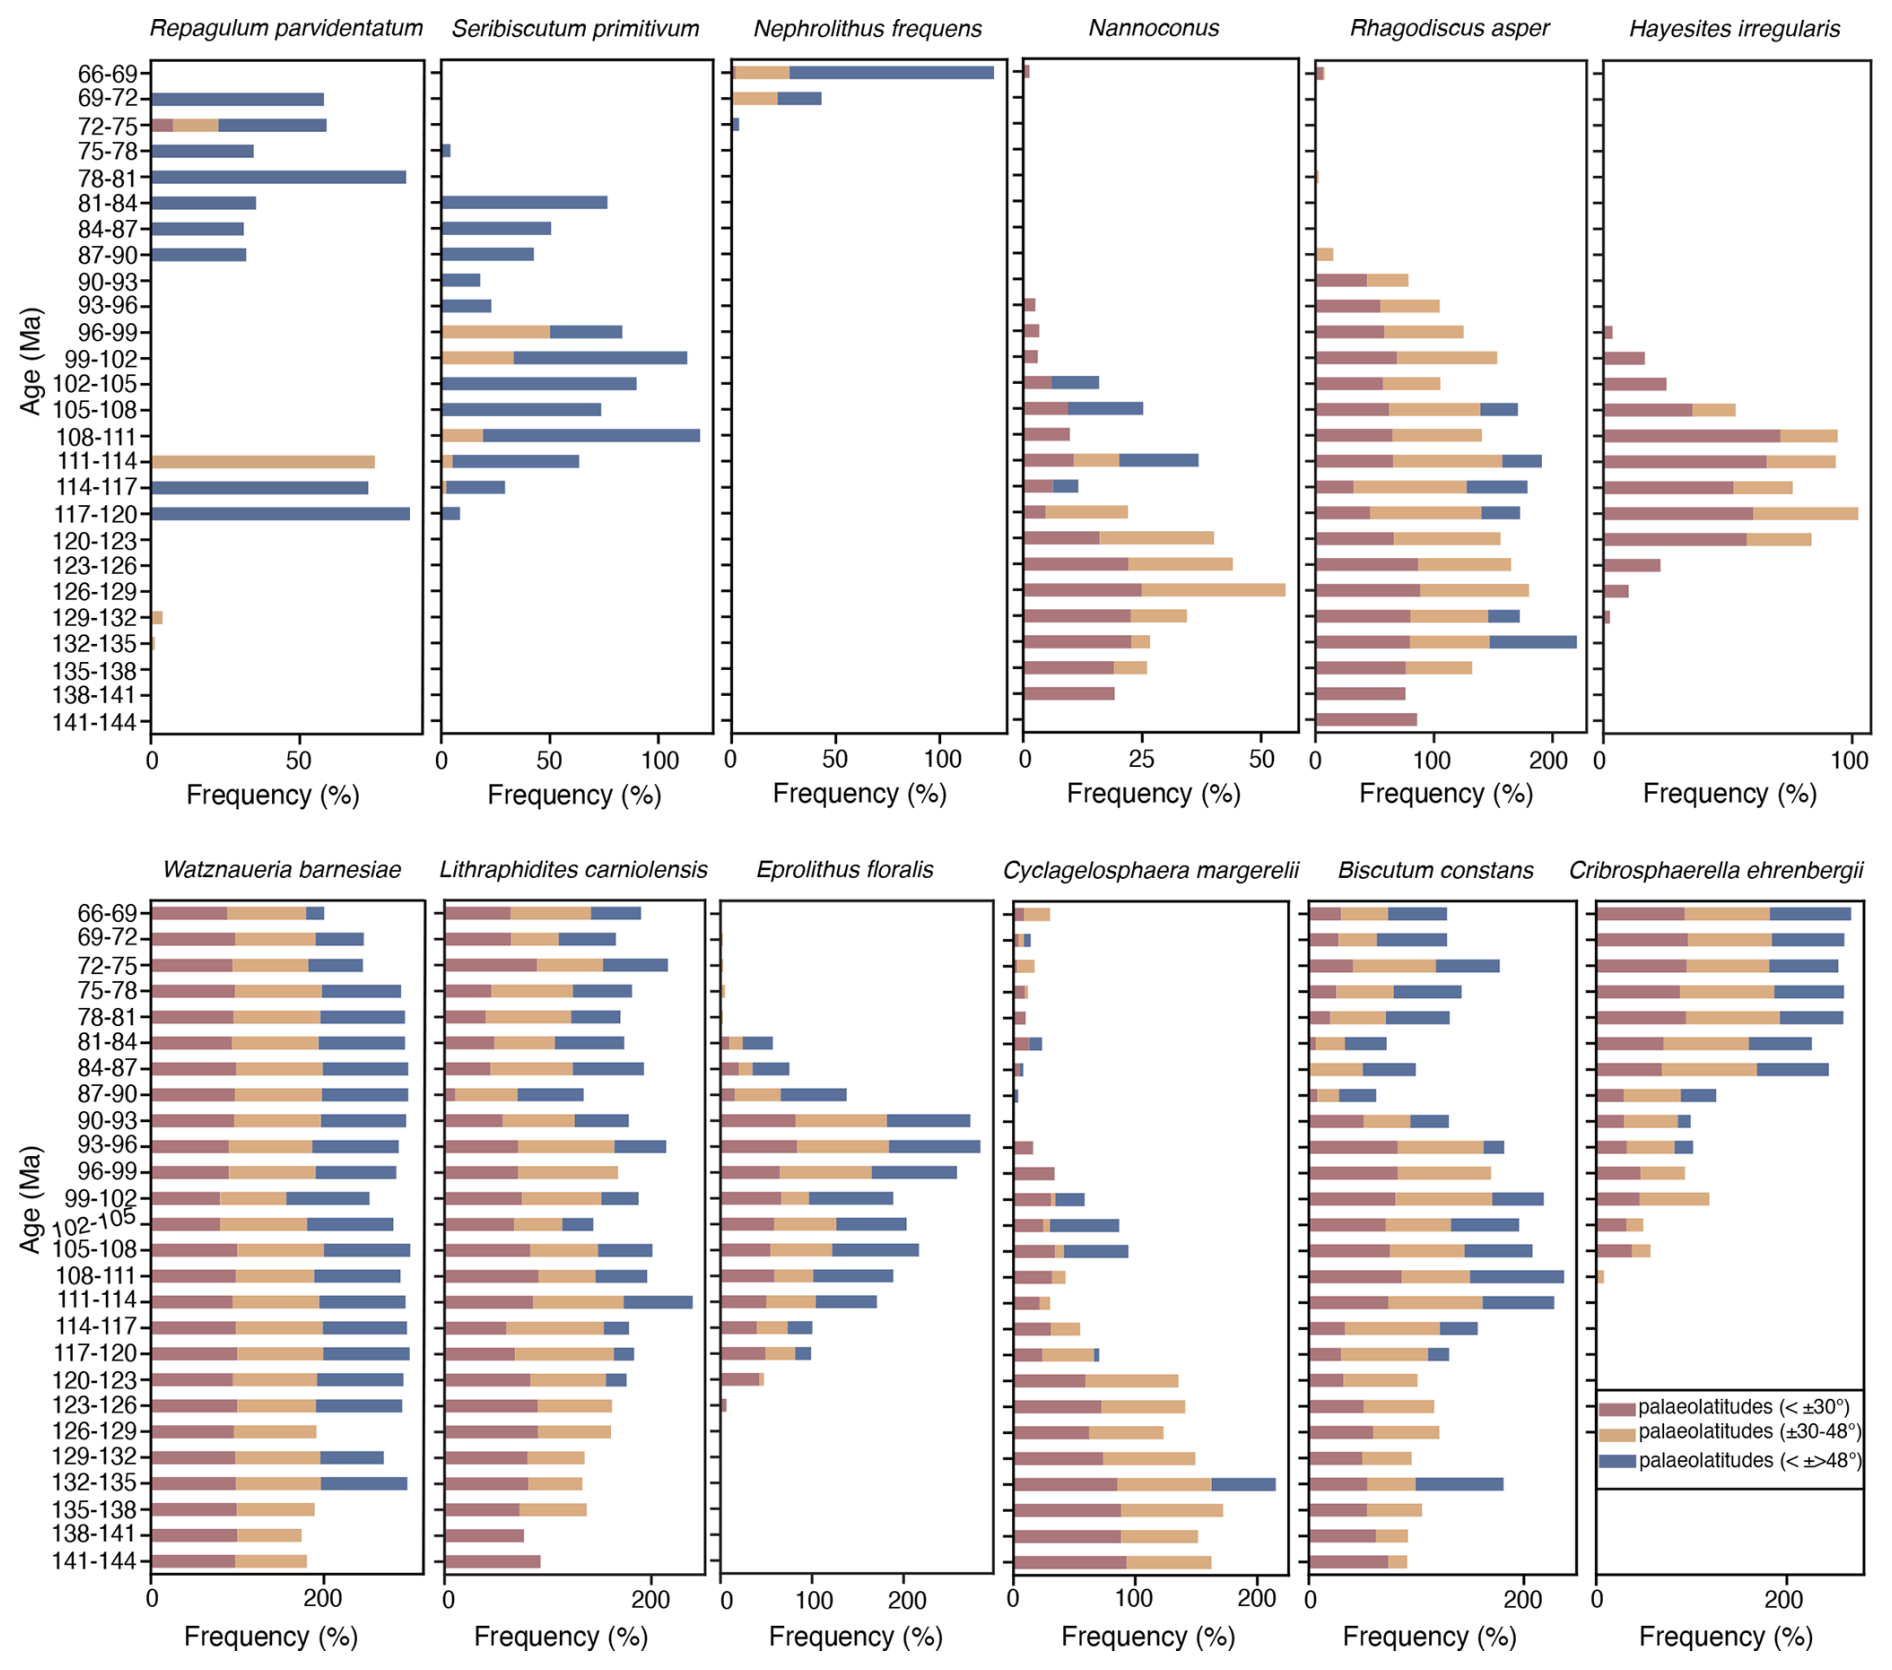
Figure 6The latitudinal distribution patterns of selected taxa in the Uneptune database. Frequency (%) represents the proportion of samples containing a given species relative to the total number of samples (samples with the speciestotal samples ⋅ 100), serving as a proxy for relative abundance in large-scale palaeontological datasets. Red, yellow, and blue bars indicate frequency % data for low (°), middle (±30–48°), and high (°) palaeolatitude sites.
The final Uneptune dataset includes about 7000 samples, 500 species, and 175 000 occurrence records distributed throughout the entire Cretaceous. By comparison, the Neptune dataset, which was previously the most comprehensive dataset for Cretaceous calcareous nannofossils, contained records for about 2000 samples, 400 species, and 55 000 records. Uneptune coverage is therefore nearly 3 times greater than the equivalent Neptune coverage. Moreover, the Neptune database coverage was heavily skewed toward low latitudes and the Upper Cretaceous. We actively sought datasets from higher latitudes and from the Lower Cretaceous, and Uneptune significantly improves data density in these areas (Fig. 5). One noteworthy advantage of this is that the increased latitudinal coverage allows testing of hypotheses of palaeotemperature preferences of Cretaceous calcareous nannofossils and so can contribute to the development of improved temperature indices.
As a preliminary test of the dataset, we examined records of taxa that have previously been reported to exhibit distinct latitudinal distribution patterns in the Cretaceous (e.g. Herrle et al., 2003; Lees, 2002; Lees et al., 2005; Bottini et al., 2015). To assess whether these biogeographic trends are captured in the compiled data, we investigated the distribution of representative cosmopolitan, high-latitude, and low-latitude species (Fig. 6). The cosmopolitan taxa, such as Watznaueria barnesiae and Lithraphidites carniolensis, show relatively uniform occurrence across all palaeolatitude bins, with slightly higher frequencies in mid- to low-latitude regions, consistent with their ecological tolerance to a wide range of sea surface conditions.
In contrast, the high-latitude taxon Repagulum parvidentatum displays a pronounced preference for cooler, higher-latitude settings (Fig. 6). Conversely, Nannoconus is largely confined to tropical and subtropical regions but with high-latitude occurrences during the mid-Cretaceous (Fig. 6), reflecting the appearance of short-ranging boreal species (Bown, 2005). In each of these cases, there is good support from the Uneptune database for these previously reported biogeographic distributions. Visual assessment of the Uneptune Nannotax charts also shows distinct distribution patterns for other taxa, with examples such as Seribiscutum primitivum and Nephrolithus frequens displaying strong high-latitudinal partitioning. Taxa displaying low-latitude/tropical preferences include Rhagodiscus asper, Diazomatolithus lehmanii, and Hayesites irregularis. (Fig. 6).
We have also identified biogeographies that shift and broaden through time, which require further investigation (Fig. 6). Biscutum constans and Eprolithus floralis appear to withdraw from the tropics during peak Cretaceous warmth (ca. 81–90 Ma; Huber et al., 2018), whereas Cribrosphaerella ehrenbergii expands its latitudinal range during the same interval. Cyclagelosphaera margerelii shows a more complex trend, characterised by a marked reduction in frequency and contraction of range from the Aptian onwards. Micrantholithus (e.g. Micrantholithus hoschulzii) displays a similar decline and range contraction. While the distribution patterns presented here provide new insights, their interpretation requires consideration of several potential biases. For example, variations in fossil preservation across different environments, historical taxonomic practices, lumping versus splitting of taxa, and spatial–temporal sampling density may influence the detection of some biogeographic signals. Nevertheless, the coherent large-scale trends observed in this study support the utility of the Uneptune database for refining Cretaceous biogeographic reconstructions and for identifying taxa that may serve as sensitive indicators of palaeoenvironmental change.
The database is currently at a useful state of development, but there is much potential for developing it further, ideally on a collaborative basis. In particular, we hope to achieve the following:
-
Deepen coverage by including more datasets, especially from land sections. This may require extraction of data from printed tables as opposed to digital copy, but there is a very substantial body of data potentially available to expand the coverage and fill temporal and geographical gaps.
-
Extend coverage back into the Jurassic. There are only a handful of ocean drilling sites with pre-Cretaceous records, but with the addition of land sections, a good level of coverage is potentially available.
-
Develop plots using abundance data, as has been achieved with the Triton database where diverse abundance data have been transformed into relative abundance codes on a 1–10 scale, which in turn allows more sophisticated data plotting.
These developments are expected to substantially enhance the completeness, consistency, and analytical capacity of the Uneptune database, establishing it as a standardised and integrative framework for calcareous nannofossil research, enabling high-resolution quantitative, biogeographic, and palaeoenvironment analyses across the entire Mesozoic interval.
Data can be accessed by contacting the primary author.
YZ: data collection, standardisation, and writing (original draft preparation). JRY: conceptualisation and database coding and development. PRB: expert advice on nannofossil taxonomic consistency, age–depth plot, and biogeography. XC: conceptualisation, supervision, and funding acquisition. CSW: supervision and funding acquisition. All authors helped with quality control and writing (review and editing).
The contact author has declared that none of the authors has any competing interests.
Publisher's note: Copernicus Publications remains neutral with regard to jurisdictional claims made in the text, published maps, institutional affiliations, or any other geographical representation in this paper. The authors bear the ultimate responsibility for providing appropriate place names. Views expressed in the text are those of the authors and do not necessarily reflect the views of the publisher.
We are especially grateful to the editors-in-chief, Francesca Sangiorgi and Luke Mander; the handling editor, Emanuela Mattioli; and the two reviewers, Micaela Chaumeil Rodríguez and Jon Scheuth, for their constructive and detailed comments, which significantly improved the paper.
This work is financially supported by the National Key Research and Development Program of China (2023YFF0804000), the National Natural Science Foundation of China (42050102), and the Science and Technology Leading Talents Team Funds for the Central Universities for the Frontiers Science Center for Deep-time Digital Earth, China University of Geosciences (Beijing) (2652023001). It contributes to IGCP 739.
This paper was edited by Emanuela Mattioli and reviewed by Micaela Chaumeil Rodríguez and Jon Scheuth.
Bergen, K. J., Johnson, P. A., de Hoop, M. V., and Beroza, J. C.: Machine learning for data driven discovery in solid Earth geoscience, Science, 363, eaau0323, https://doi.org/10.1126/science.aau0323, 2019.
Bottini, C., Erba, E., Tiraboschi, D., Jenkyns, H. C., Schouten, S., and Sinninghe Damsté, J. S.: Climate variability and ocean fertility during the Aptian Stage, Clim. Past, 11, 383–402, https://doi.org/10.5194/cp-11-383-2015, 2015.
Bown, P. R.: New calcareous nannofossil taxa from the Jurassic/Cretaceous boundary interval of Sites 765 and 261, Argo Abyssal Plain, Proceedings of the Ocean Drilling Program, Scientific Results, 123, 369–379, https://doi.org/10.2973/odp.proc.sr.123.170.1992, 1992.
Bown, P. R.: Cenozoic calcareous nannofossil biostratigraphy, ODP Leg 198 Site 1208 (Shatsky Rise, northwest Pacific Ocean), in: Proceedings of the Ocean Drilling Program, Scientific Results, edited by: Bralower, T. J., Premoli Silva, I., and Malone, M. J., College Station, TX (Ocean Drilling Program), 198, 1–44, https://doi.org/10.2973/odp.proc.sr.198.104.2005, 2005.
Diepenbroek, M., Grobe, H., Reinke, M., Schlitzer, R., and Sieger, R.: Data management of proxy parameters with PANGAEA, in: Use of Proxies in Palaeoceanography – Examples from the South Atlantic, edited by: Fischer, G. and Wefer, G., Springer, Berlin, Heidelberg, 715–727, 1999.
Diepenbroek, M., Grobe, H., Reinke, M., Schindler, U., Schlitzer, R., Sieger, R., and Wefer, G.: PANGAEA – an information system for environmental sciences, Comput. Geosci., 28, 1201–1210, https://doi.org/10.1016/s0098-3004(02)00039-0, 2002.
Dunhill, A., Renaudie, J., Young, J. R., Fenton, I. S., Saupe, E. E., Woodhouse, A., Aze, T., and Lazarus, D.: Triton, a new database of Cenozoic Planktonic Foraminifera, figshare [data set], Collection, https://doi.org/10.6084/m9.figshare.c.5242154.v4, 2021.
Fenton, I. S., Woodhouse, A., Aze, T., Lazarus, D., Renaudie, J., Dunhill, A. M., Young, J. R., and Saupe, E. E.: Triton, a new species-level database of Cenozoic planktonic foraminiferal occurrences, Sci. Data, 8, 1–9, https://doi.org/10.1038/s41597-021-00942-7, 2021.
Fenton, I. S., Aze, T., Farnsworth, A., Valdes, P., and Saupe, E. E.: Origination of the modern-style diversity gradient 15 million years ago, Nature, 614, 708–712, https://doi.org/10.1038/s41586-023-05712-6, 2023.
Finkel, Z. V., Katz, M. E., Wright, J. D., Schofield, O. M. E., and Falkowski, P. G.: Climatically driven macroevolutionary patterns in the size of marine diatoms over the Cenozoic, Proc. Natl. Acad. Sci. U.S.A., 102, 8927–8932, https://doi.org/10.1073/pnas.0409907102, 2005.
Gradstein, F. M., Ogg, J. G., Schmitz, M., and Ogg, G. M. (Eds.): The Geologic Time Scale 2020, Elsevier, Amsterdam, 69–73, ISBN 9780128243626, 2020.
Herrle, J. O., Pross, J., Friedrich, O., Kler, P., and Hemleben, C.: Forcing mechanisms for mid-Cretaceous black shale formation: evidence from the Upper Aptian and lower Albian of the Vocontian Basin (SE France), Palaeogeogr. Palaeoclimatol. Palaeoecol., 190, 399–426, https://doi.org/10.1016/S0031-0182(02)00616-8, 2003.
Huber, B. T., MacLeod, K. G., Watkins, D. K., and Coffin, M. F.: The rise and fall of the Cretaceous hot greenhouse climate, Glob. Planet. Chang., 167, 1–23, https://doi.org/10.1016/j.gloplacha.2018.04.004, 2018.
Kucera, M. and Schönfeld, J.: The origin of modern oceanic foraminiferal faunas and Neogene climate change, in: Deep-Time Perspectives on Climate Change: Marrying the Signal from Computer Models and Biological Proxies, edited by: Williams, M., Haywood, A. M., Gregory, F. J., and Schmidt, D. N., Micropalaeontology Society Special Publications, 409–425, https://doi.org/10.1144/TMS002, 2007.
Lazarus, D. B.: Neptune: A marine Micropaleontology Database, Math. Geo., 26, 817–832, https://doi.org/10.1007/bf02083119, 1994.
Lees, J. A.: Calcareous nannofossil biogeography illustrates palaeoclimate change in the Late Cretaceous Indian Ocean, Cre. Res., 23, 537–634, https://doi.org/10.1006/cres.2003.1021, 2002.
Lees, J. A., Bown, P. R., and Mattioli, E.: Problems with proxies? Cautionary tales of calcareous nannofossil paleoenvironmental indicators, Micropaleontology, 51, 333–343, https://doi.org/10.2113/gsmicropal.51.4.333, 2005.
Matthews, K. J., Maloney, K. T., Zahirovic, S., Williams, S. E., Seton, M., and Müller, R. D.: Global plate boundary evolution and kinematics since the late Paleozoic: Global plate boundary evolution and kinematics since the late Paleozoic, Glob. Planet. Chang., 146, 226–250, https://doi.org/10.1016/j.gloplacha.2016.10.002, 2016.
Pearson, P. N., Young, J., King, D. J., and Wade, B. S.: Biochronology and evolution of Pulleniatina (planktonic foraminifera), J. Micropalaeontol., 42, 211–255, https://doi.org/10.5194/jm-42-211-2023, 2023.
Rabosky, D. L. and Sorhannus, U.: Diversity dynamics of marine planktonic diatoms across the Cenozoic, Nature, 457, 183–187, https://doi.org/10.1038/nature07435, 2009.
Reichstein, M., Camps-Valls, G., Stevens, B., Jung, M., Denzler, J., Carvalhais, N., and Prabhat: Deep learning and process understanding for data-driven Earth system science, Nature, 566, 195–204, https://doi.org/10.1038/s41586-019-0912-1, 2019.
Renaudie, J., Lazarus, D. B., and Diver, P.: NSB (Neptune Sandbox Berlin): An expanded and improved database of marine planktonic nannofossil data and deep-sea stratigraphy, Palaeontol. Electron., 23, a11, https://doi.org/10.26879/1032, 2020.
Seton, M., Müller, R. D., Zahirovic, S., Gaina, C., Torsvik, T., Shephard, G., Talsma, A., Gurnis, M., Turner, M., Maus, S., and Chandler, M.: Global continental and ocean basin reconstructions since 200 Ma, Earth Sci. Rev., 113, 212–270, https://doi.org/10.1016/j.earscirev.2012.03.002, 2012.
Street, C.: Palaeobiogeography of early Cretaceous calcareous nannoplankton, PhD thesis, University College London, 1–405, https://discovery.ucl.ac.uk/id/eprint/1317754/ (last access: 8 February 2026), 1999.
Street, C. and Bown, P. R.: Palaeobiogeography of Early Cretaceous (Berriasian–Barremian) calcareous nannoplankton, Mar. Micropaleontol., 39, 265–291, https://doi.org/10.1016/S0377-8398(00)00024-4, 2000.
Spencer-Cervato, C.: The Cenozoic deep sea microfossil record: Explorations of the DSDP/ODP sample set using the NEPTUNE database, Palaeontol. Electron., 2, a13, https://doi.org/10.26879/99013, 1999.
Woodhouse, A., Swain, A., Fagan, W. F., Fraass, A. J., and Lowery, C. M.: Late Cenozoic cooling restructured global marine plankton communities, Nature, 614, 713–720, https://doi.org/10.1038/s41586-023-05694-5, 2023.
Young, J. R.: Best practices for preserving and reporting stratigraphical data: cyber infrastructure for stratigraphical data and information, in: Deciphering Earth's History: the Practice of Stratigraphy, edited by: Coe, A. L., The Geological Society, London, 277–292, https://doi.org/10.1144/GIP1-2022-28, 2022.
Young, J. R., Bown, P. R., Wade, B. S., Pedder, B. E., Huber, B. T., and Lazarus, D. B.: Mikrotax: developing a genuinely effective platform for palaeontological geoinformatics, Acta Geol. Sin.-Engl., 93, 70–72, https://doi.org/10.1111/1755-6724.14249, 2019.