the Creative Commons Attribution 4.0 License.
the Creative Commons Attribution 4.0 License.
 | 16 Jun 2026
Coccolithophore signatures across the termination of the late Miocene to early Pliocene biogenic bloom in the Atlantic and Indian oceans
Boris-Theofanis Karatsolis
Joseph D. Asanbe
Jorijntje Henderiks
Accumulation rates of biogenic carbonates and opal, mainly produced by marine algae such as coccolithophores and diatoms, have been widely used to understand when and why the late Miocene to early Pliocene biogenic bloom occurred and how long it lasted. Information is still limited on the synchronicity of its termination, as well as the compositional signatures of the main carbonate producers across ocean basins, although recent studies have started to address this question. A recent study demonstrated that the biogenic bloom ended at ∼ 3.3 Ma in the mid-latitude South Atlantic (ODP Site 1264), whereas a compilation of multiple deep-sea records pointed to a synchronous termination of the biogenic bloom in low latitudes at 4.6–4.4 Ma. Notably, the synchronous decrease in low-latitude paleoproductivity was accompanied by significant restructuring of the calcareous nannoplankton assemblages, at least offshore NW Australia (IODP Site U1463). Since coccolithophores are the main drivers of carbonate export production during the Neogene, such compositional shifts have the potential to be used as a first-order, biostratigraphic tool to identify the end of the biogenic bloom across ocean basins. To test this hypothesis, we compared the calcareous nannofossil compositions at ODP Site 1264 to those observed at IODP Site U1463 across the early Pliocene (5–3 Ma). This comparison reveals that although the main stepwise decrease in carbonate fluxes at Site 1264 occurred between ∼ 4.2–4.0 Ma, and therefore closer to the proposed synchronous end of the biogenic bloom in low latitudes, it was not accompanied by a change in the dominant coccolithophores. The widespread Pliocene rise of small Gephyrocapsa, as observed in the Indian Ocean, never occurred in this section of the South Atlantic. Instead, small Reticulofenestra remained dominant until ∼ 3.5 Ma. This indicates that regional contrasts in the dominant bloom-forming coccolithophores, which underpin export production, may explain the observed differences in the timing of early Pliocene declines in carbonate accumulation.
- Article
(3861 KB) - Full-text XML
-
Supplement
(1033 KB) - BibTeX
- EndNote


The late Neogene was marked by globally elevated accumulation rates of biogenic sediments, predominantly carbonates (CaCO3) and silica (SiO2). Higher burial rates were recorded in various locations across oceanic basins and most likely reflect higher export production of carbonate- and opal-producing phytoplanktonic organisms, such as coccolithophores and diatoms, and thus higher primary productivity. For this reason, this interval that roughly spanned 9–3.5 Ma is commonly referred to as the late Miocene to early Pliocene biogenic bloom (Dickens and Owen, 1999; Diester-Haass et al., 2002, 2005; Farrell et al., 1995). Although many previous studies have focused on identifying this event and the reasons why it occurred in different ocean basins and depositional environments, little is known about when and why it came to an end. A recent meta-analysis (Karatsolis et al., 2022) points to a synchronous termination of the biogenic bloom, expressed in an (on orbital timescales) abrupt step towards decreased paleoproductivity (PP) in low latitudes between 4.6–4.4 Ma. This shift coincided with a phase of decreasing eccentricity and a shift towards low-amplitude obliquity, an orbital configuration that may have led to a decrease in monsoon intensity and nutrient supply, therefore resulting in an abrupt decrease in biogenic sedimentation across oceanic basins (Karatsolis et al., 2022). However, an astronomically tuned CaCO3 accumulation rate (CMAR) record from South Atlantic ODP Site 1264 (Fig. 1) revealed that although a decrease in PP was observed at ∼ 4 Ma, elevated carbonate burial persisted in the southern mid-latitudes until the late Pliocene (∼ 3.3 Ma; Drury et al., 2021). Both studies prioritized age model accuracy, basing their results mainly on astronomically tuned records. Although similar patterns are revealed for the interval before the abrupt decrease in low-latitude PP, there appears to be a diachronicity of carbonate burial patterns after 4.4 Ma that cannot be readily attributed to age model discrepancies.
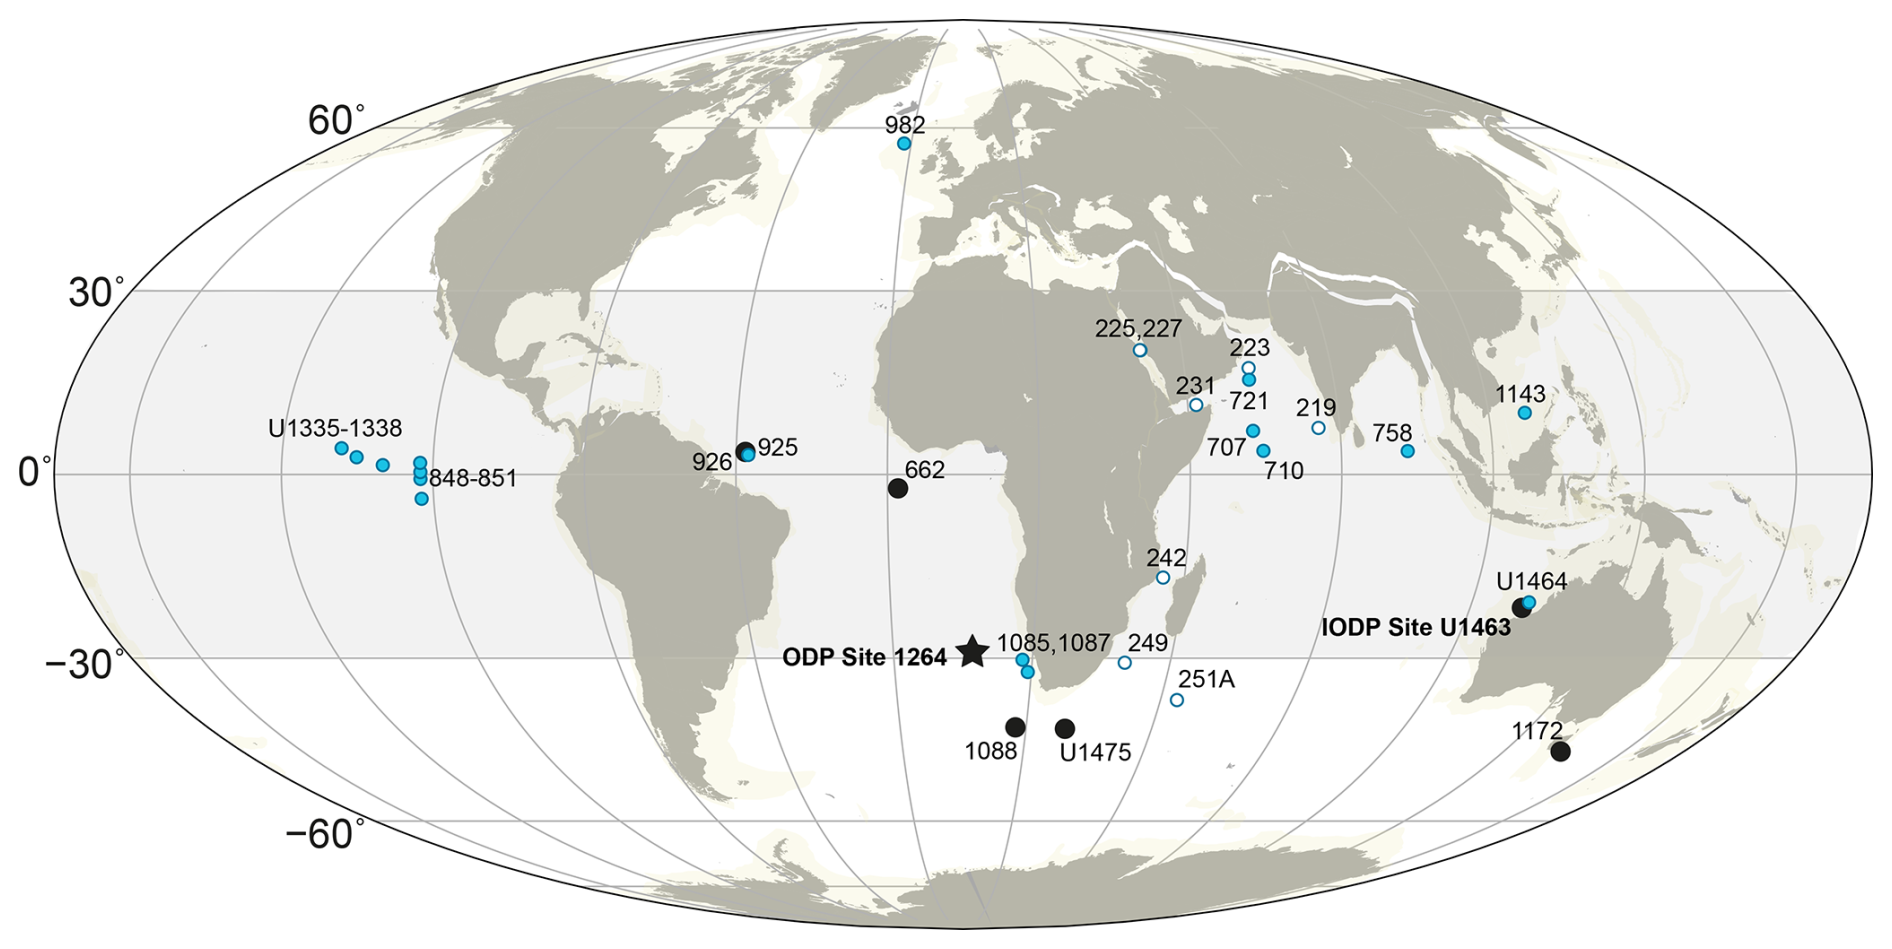
Figure 1Early Pliocene (4.5 Ma) paleogeographic reconstruction showing the drill sites discussed in this study; South Atlantic ODP Site 1264 (black star; main site of investigation), other sites with reported Pliocene nannofossil assemblages (black circles). Blue circles are sites included in the PP compilation of Karatsolis et al. (2022), and open (white) circles are Indian Ocean sites included in the nannofossil synthesis of Young (1990). The shaded area indicates the proposed latitudinal span of the synchronous end of the late Miocene to early Pliocene biogenic bloom. The basemap was generated using GPlately1.3.0 (Mather et al., 2023) based on plate motion data from Müller et al. (2019).
Here we investigate this temporal offset by focusing on how the end of the biogenic bloom was expressed in the assemblages of organisms that control carbonate burial. Among those, calcareous nannoplankton (mainly coccolithophores) are the most relevant group because they are primary producers, directly affected by changes in nutrient availability, and represent the bulk of biogenic carbonate in Neogene deep-sea sediments (Reghellin et al., 2022; Si and Rosenthal, 2019; Suchéras-Marx and Henderiks, 2014). At ODP Site 1264 (Fig. 1), coccolithophores were the group that drove the increased burial of CaCO3 during the Neogene, demonstrating increased productivity and dominating over foraminifera and biogenic silica producers (Drury et al., 2021; Keating-Bitonti and Peters, 2019). At IODP Site U1463 (and neighboring Site U1464), the end of the biogenic bloom was accompanied by a shift in the dominant bloom-forming coccolithophore species over the NW Australian shelf. The relative abundances and fluxes of small Reticulofenestra decreased abruptly, while small Gephyrocapsa started increasing in relative abundance and became dominant by 4.2 Ma (Karatsolis et al., 2020). Since these changes were attributed to a widespread decrease in nutrient availability in the global ocean, we hypothesize that similar shifts in taxonomic composition occurred in other locations which could have been synchronous to the abrupt decrease in CMAR, providing a biostratigraphically distinct event across different oceans and latitudes. The astronomically tuned sedimentary archive at ODP Site 1264 serves as an excellent record to investigate such changes in nannofossil assemblages and compare them to those observed on the NW Australian shelf, as well as other available Pliocene records.
2.1 Micropaleontological analysis
A total of 21 samples from the spliced record between Holes A (10 samples) and B (11 samples) of Walvis Ridge ODP Site 1264 (28°31.955′ S, 2°50.730′ E; water depth of 2507 m; Shipboard Scientific Party Leg 208, Zachos et al., 2004; Fig. 1) were selected from depth intervals that coincide with, or fall close to (maximum offset ± 3 cm), the astronomical tuning ties presented by Drury et al. (2021). Sample ages correspond to the age model of Drury et al. (2021), covering the time interval from 5–3 Ma with an average time step of ∼ 100 kyr (Table S1 in the Supplement). This sample resolution does not resolve fluctuations in nannofossil assemblages on orbital timescales (< 100 kyr). Nevertheless, it is adequate for capturing sustained changes in community structure that marked the termination of the biogenic bloom. Microscopy slides were prepared with the “drop technique” (Bordiga et al., 2015). The initial screening revealed a high density of coccoliths, so in order to increase the dispersal of particles within each field of view, the sediment suspensions were further diluted to a bulk-weight equivalent concentration of 0.06 mg mL−1 (Data Table 1 in https://doi.org/10.5281/zenodo.19854421, Karatsolis et al., 2026). The suspension was ultrasonicated, and the slides were prepared with a drop volume of 1.9 mL on each cover slip. Micropaleontological analysis was conducted at × 1000 magnification and included the examination of at least 300 specimens from at least 10 fields of view (FOVs). The relative abundance (%) for the most common nannofossil species was calculated. Species of the main taxonomic groups (genera), namely Reticulofenestra and Gephyrocapsa, were classified into small (< 3 µm), medium (3–5 µm), and large (> 5 µm) size categories, a standard cut-off that allows for comparison with previous studies (including results presented in Karatsolis et al., 2020). Error envelopes representing 95 % confidence intervals (CIs) were calculated for the nannofossil relative abundances (%) using PAST 4 software (Hammer et al., 2001; Suchéras-Marx et al., 2019). Absolute abundances for the abovementioned common taxa were estimated using Eq. (1) (e.g., Koch and Young, 2007):
where A is the coverslip area (mm2), N the number of nannofossils counted in all investigated fields of view, F the surface area of each field of view (FOV; mm2), n the number of FOVs, and W the dry bulk sediment weight on the coverslip (g).
The error estimate for the absolute abundances represents a reproducibility of ± 15 % (Bordiga et al., 2015), estimated for the total nannofossil abundance.
Nannofossil accumulation rates (NARs; in ) were calculated using Eq. (2):
where AA is absolute abundance (N g−1); LSR the linear sedimentation rate at each sample depth (Drury et al., 2021; since the samples were taken at core depths corresponding to astronomical ties, the sedimentation rate was calculated for each tie and the next one below); and DBD (g cm−3) the dry bulk density, which was estimated by linearly interpolating between two adjacent measurements (above and below the sample age) of calibrated GRA dry bulk density (Drury et al., 2021).
2.2 Calcium carbonate mass contributions and accumulation rates
The relative carbonate mass contribution of each nannofossil taxon was calculated following Suchéras-Marx and Henderiks (2014), based on nannofossil size and shape (volume) considerations (Table S1). For taxonomic groups that were only identified at the genus level, the average of several mass estimates for late Miocene and Pliocene species was applied (Suchéras-Marx and Henderiks, 2014; Young and Ziveri, 2000; Table S2). Most unidentified nannofossils were placolith-like nannofossils within the size range of small- and medium-sized Reticulofenestra. For Calcidiscus spp., the mean mass estimate for medium-sized (5–8 µm) species was used because specimens > 8 µm were not common in our samples. The nannofossil carbonate mass (NCmass) contribution within the bulk sample (g g−1 bulk) was calculated following Eq. (3):
where NCmass was calculated for each nannofossil taxon, with AA being its absolute abundance (N g−1) and MM its mean mass (in pg). The total nannofossil CaCO3 mass contribution (g g−1 bulk) was then calculated by summing all taxon-specific NCmass estimates. The nannofossil-derived CaCO3 mass accumulation rates (CMARnannos, ) were calculated by multiplying NAR by NCmass (for individual taxa and summed total). For the NW Australian shelf Site U1463, NCmass was calculated in the same way, multiplying previously published nannofossil absolute abundances (Karatsolis and Henderiks, 2023) by their respective coccolith masses (Suchéras-Marx and Henderiks, 2014; Young and Ziveri, 2000; Tables S1 and S2 in the Supplement).
Calculations of foraminifera-derived CaCO3 mass accumulation rates (CMARforams, ) were based on two assumptions. The first was that in a high-carbonate content nannofossil ooze (> 94 % CaCO3), all the coarse fraction belongs to the carbonate fraction of the sediment. The second assumption was that this coarse fraction mostly corresponds to foraminifera shells. Based on these assumptions, the coarse-fraction (> 63 µm wt %) measurements from Keating-Bitonti and Peters (2019) were resampled at the sample depths used in this study and multiplied by the LSR and DBD (see NAR description above).
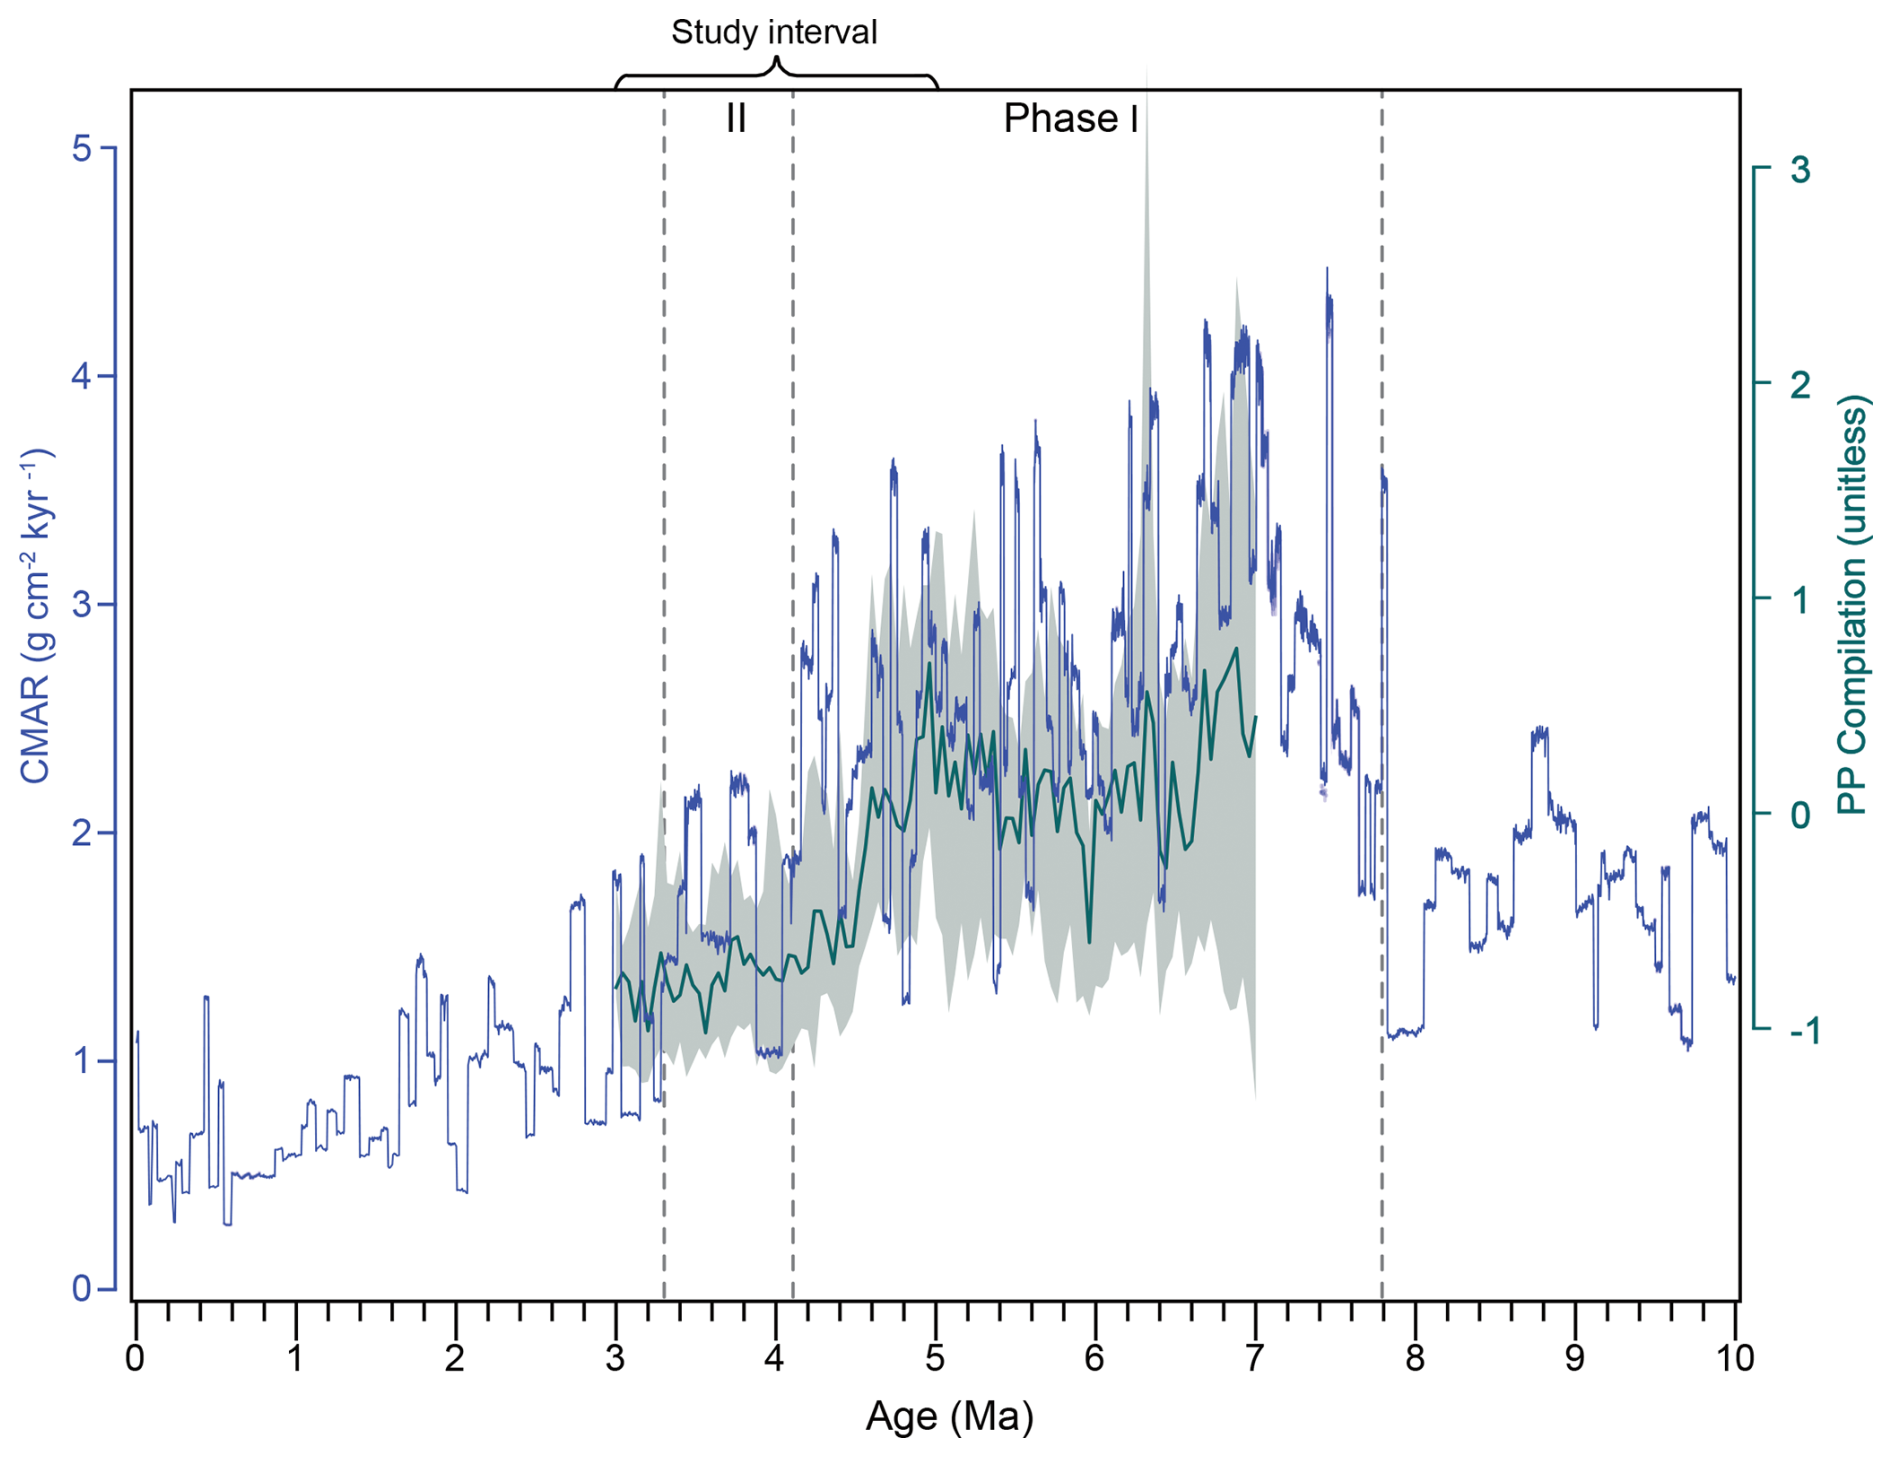
Figure 2Comparison between late Miocene–early Pliocene paleoproductivity (PP; unitless) in low latitudes (Karatsolis et al., 2022; dark green line, y axis to the right) and CMAR () at ODP Site 1264 for the last 10 Ma (Drury et al., 2020, 2021; blue line, y axis to the left). The PP compilation is unitless and represents the median of 25 binned and z-scored records reflecting biogenic sedimentation at 18 (mostly low-latitude) sites. The shaded area (light green) indicates the 15.9 and 84.1 percentiles (i.e., the central 68.2 percentile) of the binned records. Each record is plotted on its respective astronomically tuned age model. Vertical dashed lines delimit the selected time intervals for which median CMAR is discussed (see text for details).
2.3 Defining the end of the biogenic bloom
Biostratigraphic marker species, such as Reticulofenestra pseudoumbilicus (> 7 µm), Pseudoemiliania lacunosa, and Sphenolithus abies, were documented in order to evaluate any significant age discrepancies between observed biohorizons (first or last occurrences) and the astronomically tuned ages in the spliced record (Drury et al., 2021). Special focus was given to Amaurolithus primus, a species with a last occurrence (top) that has been astronomically calibrated in the equatorial Pacific (ODP Leg 138) between the Nunivak (4.48 Ma) and Sidufjall (4.8 Ma) geomagnetic subchrons to 4.5 Ma (Raffi et al., 2020, and references therein), falling very close to the timing of the end of the biogenic bloom, as suggested by Karatsolis et al. (2022). This biohorizon has a low degree of reliability (“D”: indistinct and poorly defined in terms of abundance change and which is demonstrated as diachronous; Raffi et al., 2006, 2020). Yet, it was the only calcareous nannofossil biohorizon available for constructing the initial age model between 4–5 Ma at ODP Site 1264, identified between section 3H-7-19 and 4H-1-40 at Hole A and between 4H-7-11 and 5H-CC at Hole B (shipboard biostratigraphy; Shipboard Scientific Party Leg 208, Zachos et al., 2004, and Drury et al., 2021). The mid-point depth between these sections has an age of ∼ 4.1 Ma (4115 ka) in the astronomically tuned age model (Drury et al., 2021), which supports a diachroneity of this bioevent between the equatorial Pacific and South Atlantic. We investigated > 200 FOVs to verify the presence or absence of Amaurolithus spp. in all samples (Data Table 3 in Karatsolis et al., 2026).
In order to identify different phases in overall CaCO3 fluxes, we calculated median CMAR values for three distinct time intervals (Fig. 2). These correspond to the interval before the biogenic bloom (10–7.8 Ma), the interval of the biogenic bloom as defined by Drury et al. (2021) (∼ 7.8–3.3 Ma), and the interval between the suggested termination of the biogenic bloom in this study (following visual inspection of stepwise changes in the CMAR record) and that by Drury et al. (2021) (4.1–3.3 Ma). This provides a first-order statistical evaluation of the timing that would most likely resemble the end of the biogenic bloom at ODP Site 1264, before comparison with the nannofossil assemblages.
3.1 Biostratigraphy and main biogenic bloom phases
Defining the beginning and end of distinct paleoceanographic and paleoclimatic time intervals, such as the biogenic bloom, can be challenging. Disagreements between studies are common, mainly because of differences in age model accuracies or sampling resolution and definitions based on visual inspection of the available data. The calculation of median CMAR values at Site 1264 allows for a statistical estimation of the main breakpoint in carbonate burial rates (Fig. 2) and suggests that they significantly dropped after 4.1 Ma (median of ∼ 2 ; Phase II), resembling the accumulation rates before the onset of the biogenic bloom (∼ 1.8 ) rather than during (∼ 2.8 ; LMBB; see Drury et al., 2021). This is in good agreement with the interval of the highest CaCO3 content (96 %–97.5 %) that lasted until ∼ 4 Ma (Drury et al., 2021).
This observation suggests that the CMAR reduction at Site 1264 occurred in two main steps, at 4.1 Ma (end of Phase I) and at 3.3 Ma (end of Phase II), where the latter was denoted as the termination of the biogenic bloom (Drury et al., 2021). These steps may relate to compositional changes in the main carbonate producers. The end of Phase I falls close to the depth in core, where the top of Amaurolithus primus was identified by shipboard biostratigraphy (Zachos et al., 2004; Drury et al., 2021). This bioevent is considered to have low reliability (Raffi et al., 2020; see above), but were it taken at face value, it would suggest that a first step of CMAR reduction at Site 1264 is in good agreement with the proposed termination of the biogenic bloom suggested for low latitudes, at ∼ 4.5 Ma. However, we were not able to identify any A. primus with clear morphological characteristics, and some nannoliths that demonstrated resemblance were instead classified as broken A. delicatus (Eric De Kaenel, personal communication, 2022; top at 3.933 Ma) or A. brevigracilis (Eric De Kaenel, personal communication, 2022). The latter has a top dated at 4.64 Ma in the Atlantic Ocean (Blair et al., 2017a).
When dated on the tuned age model of Drury et al. (2021), the top occurrence of Amaurolithus brevigracilis (this study) has a midpoint-depth age of 4.099 ± 0.060 Ma, which is ∼ 500 kyr younger than the calibrated bioevent age (Data Table 4 in Karatsolis et al., 2026). Other biohorizons identified in this study (Fig. 2), such as the top of Sphenolithus abies (midpoint-depth age 3.622 ± 0.093 Ma), the top of Reticulofenestra pseudoumbilicus (midpoint-depth age 3.793 ± 0.083 Ma), and the first consistent presence (Base common) of Pseudoemiliania spp. (midpoint-depth age of 4.099 ± 0.060 Ma), actually show good correspondence, with published bioevent ages of 3.61 + 0.09 Ma, 3.82 Ma (Raffi et al., 2020), and 3.81 ± 0.11 Ma, respectively (Nannotax3 database; Data Table 4 in Karatsolis et al., 2026). Combined, our biostratigraphic observations do not justify any revisions to the astronomically tuned age model. Instead, the apparent ∼ 500 kyr discrepancy between the shipboard assignment of the top of A. primus (Zachos et al., 2004; Drury et al., 2021) or top of A. brevigracilis (this study) and the astronomically tuned ages for the same stratigraphic level (Drury et al., 2021) could be attributed to a delayed extinction of this taxon in higher latitudes, taxonomic misidentifications, reworking, or significant changes in sedimentation rates, which might have influenced the astronomical tuning of the records. Since an a priori assumption of the synchronicity of the end of the biogenic bloom is not the premise nor aim of this study and most biostratigraphic evidence shows good alignment, we retain the astronomical tuning ages for Site 1264 in order to investigate the nannofossil assemblage patterns across the main steps in CMAR reduction.
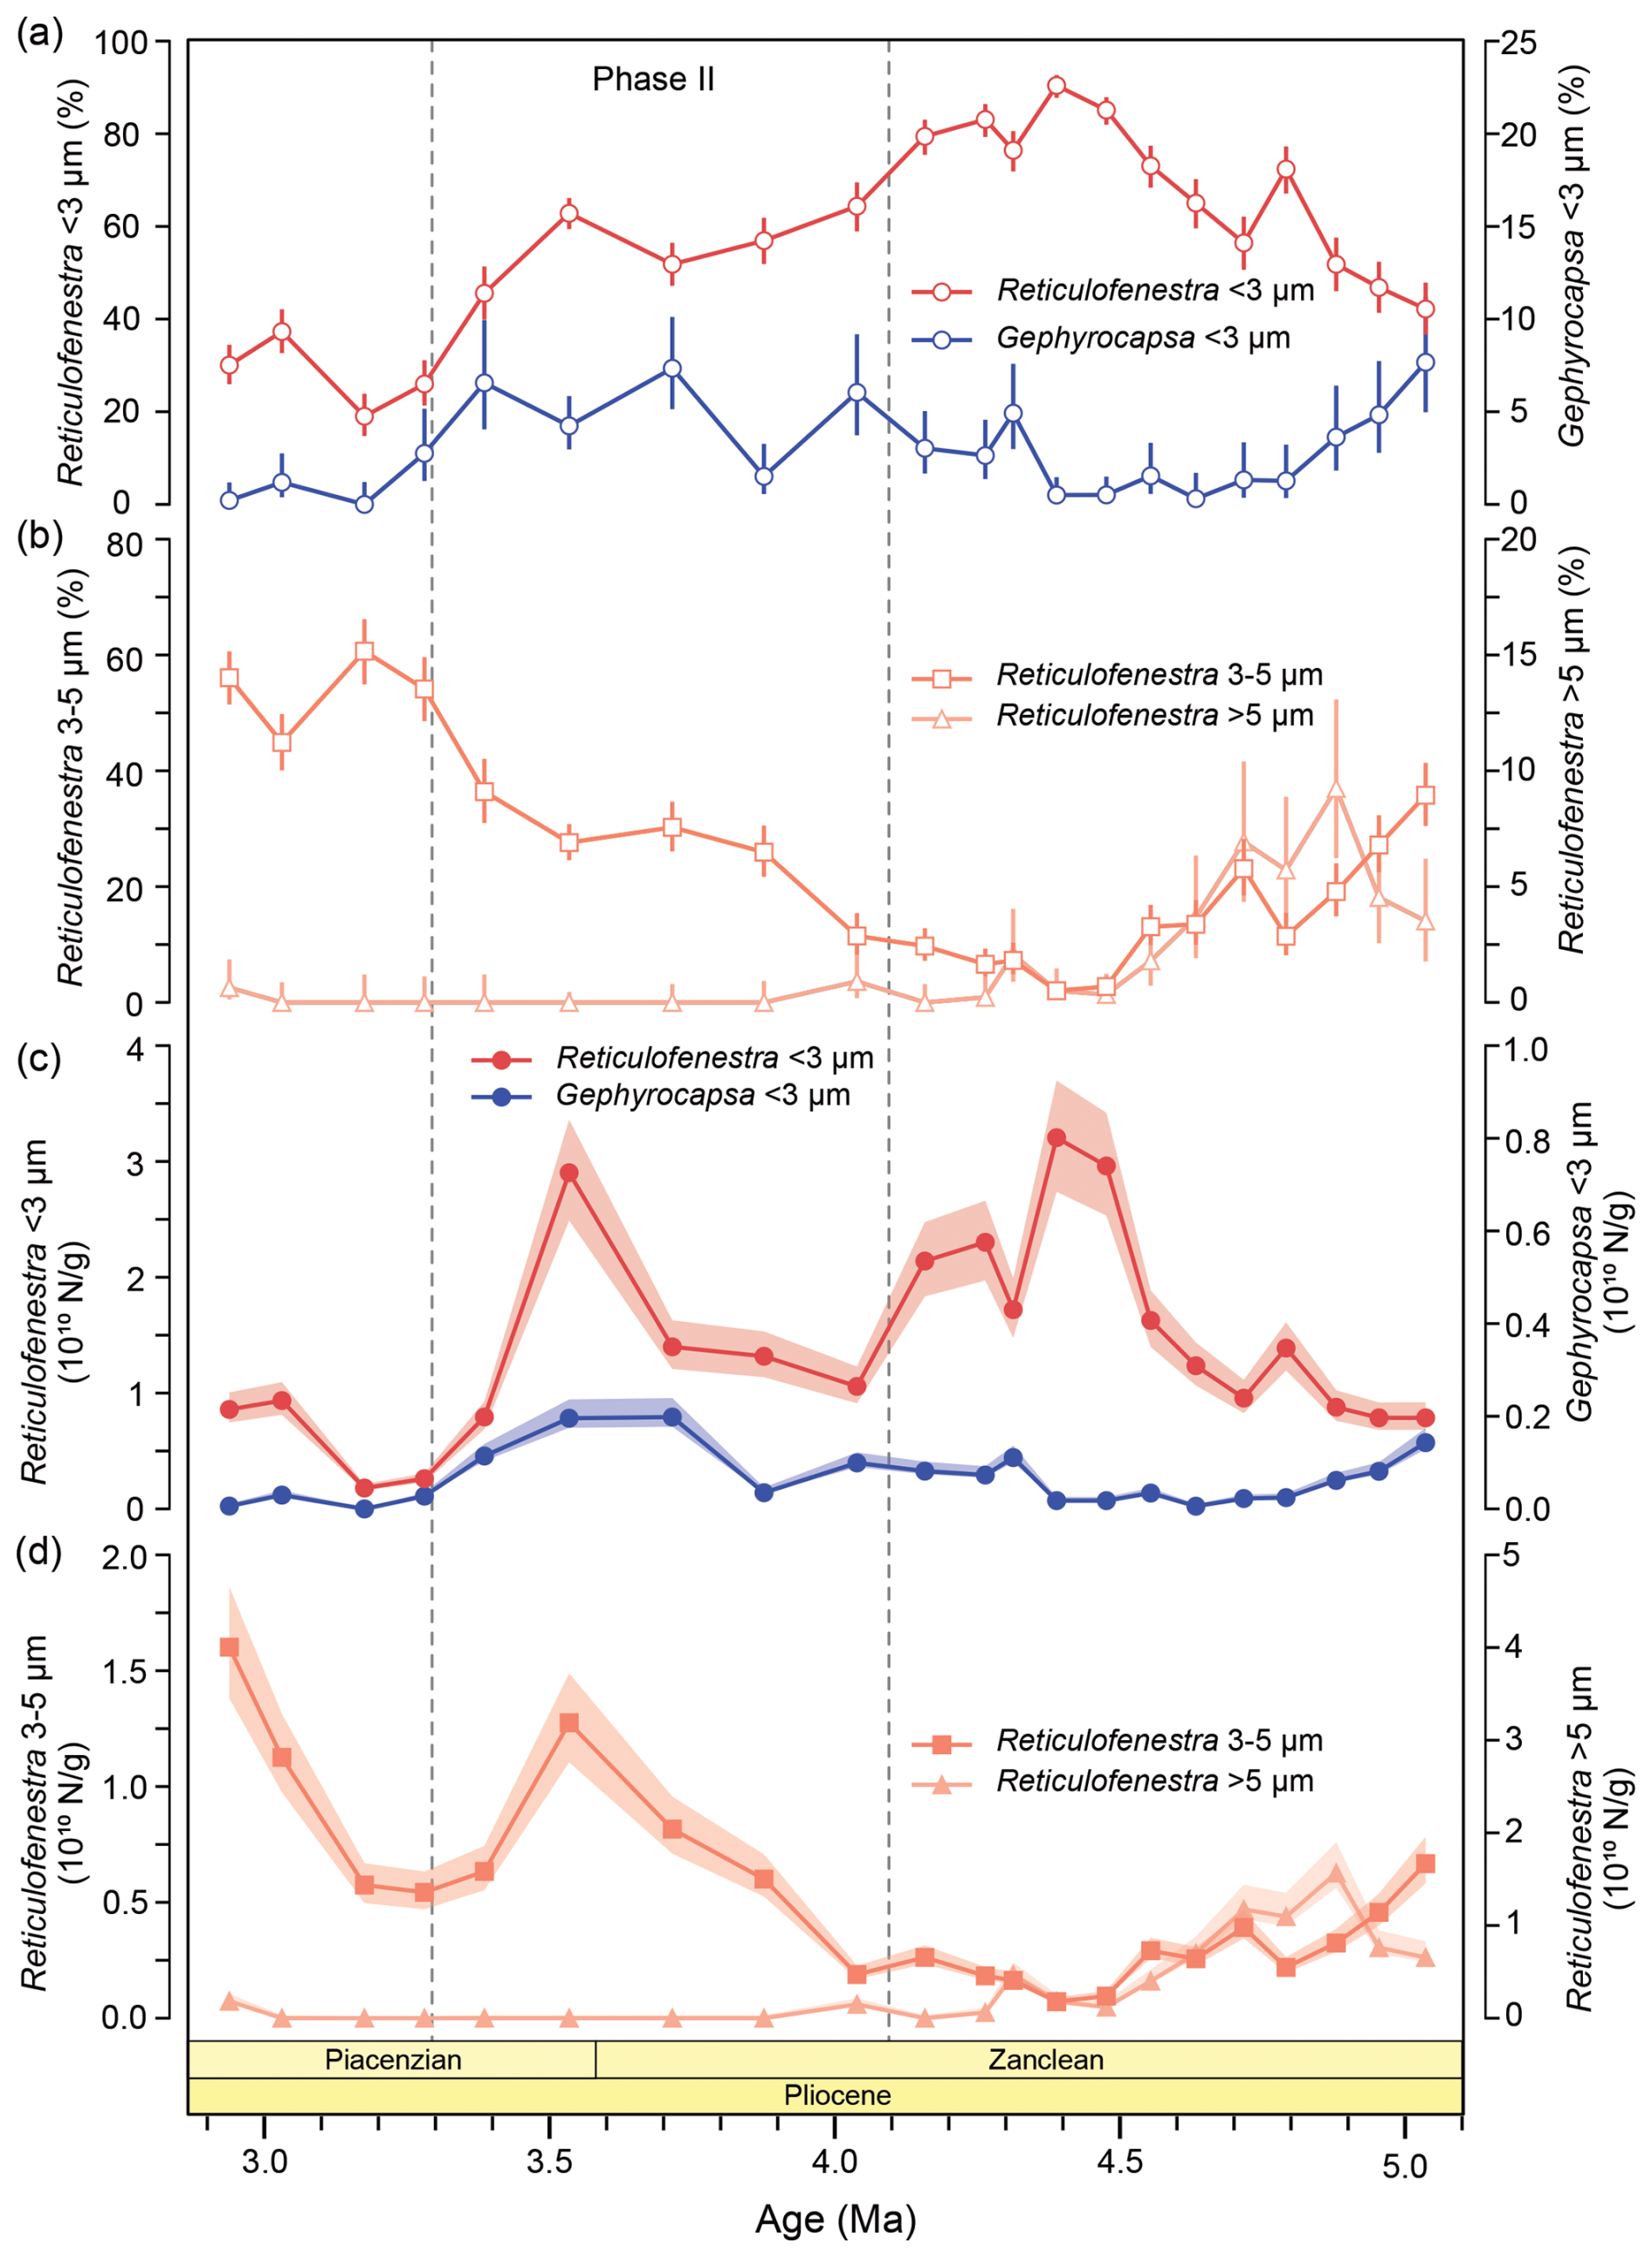
Figure 3Calcareous nannofossil abundances across the biogenic bloom termination at ODP Site 1264. (a, b) Relative (%) and (c, d) absolute abundances (N g−1) of (a, c) small (< 3 µm) Reticulofenestra (red) and Gephyrocapsa (blue) and (b, d) medium-sized Reticulofenestra (3–5 µm; yellow) and large Reticulofenestra (> 5 µm; grey) plotted against age (Ma). Relative abundance errors represent the 95 % confidence interval (CI; Suchéras-Marx et al., 2019), and absolute abundance errors represent a reproducibility of ± 15 % (Bordiga et al., 2015).
3.2 Nannofossil assemblages at ODP Site 1264
We report on the relative and absolute abundances of calcareous nannofossils (Fig. S1), including the most common taxa belonging to the Noelaerhabdaceae family (Fig. 3a–d), namely small Reticulofenestra and Gephyrocapsa species (< 3 µm), as well as medium-sized (3–5 µm) and large (> 5 µm) Reticulofenestra. The relative abundance of small Reticulofenestra increased gradually from ∼ 5 to ∼ 4.2 Ma, reaching very high values of ∼ 90 % at ∼ 4.4 Ma. After that, a progressive long-term decrease began, and relative abundances gradually dropped to ∼ 20 % towards the late Pliocene (Fig. 3a). Although no rapid and sustained decrease in relative abundance was observed across the Pliocene, two step-wise decreases of 20 % and 35 % occurred between ∼ 4.1–3.9 and ∼ 3.5–3.2 Ma, respectively (Fig. 3a). On the other hand, the relative abundance of small Gephyrocapsa – although consistently present for the interval between ∼ 4.2–3.3 Ma – never exceeded ∼ 8 % (Fig. 3a). The presence of small Reticulofenestra and the good preservation of coccoliths reduce the likelihood that the low abundances of small Gephyrocapsa at ODP Site 1264 are the result of dissolution. Among other prominent groups, medium-sized Reticulofenestra (3–5 µm) became progressively less abundant between 5–4.4 Ma, decreasing from ∼ 35 % to ∼ 2 %. Following that, they increased in relative abundance again after ∼ 3.8 Ma, reaching ∼ 60 % at ∼ 3.2 Ma (Fig. 3b). This rise in abundance could be related to the reported first occurrence of R. minutula (3–5 µm) between 3.70–3.92 Ma (Nannotax 3; Young, 1998). Large Reticulofenestra species (> 5 µm) constituted 3 %–10 % of the assemblage from ∼ 5–4.5 Ma and virtually disappeared after this time (Fig. 3a). Among other taxa, Calcidiscus spp. were consistently present in the assemblage, with relative abundances between ∼ 2 %–10 % across the study interval (Fig. S1). Together, the abovementioned taxa comprised > 87 % of the assemblage in all samples. Absolute abundances (N g−1) show similar patterns for the respective taxa (Fig. 3b). Superimposed on their overall dominance (> 50 %), distinct peaks in small Reticulofenestra, with concentrations of > 30 billion coccoliths per gram bulk sediment, are centered around 4.4 Ma and at 3.5 Ma (Figs. 3c and S1). The most pronounced and sustained reduction in absolute abundances of this taxon occurred after 3.5 Ma. Finally, NARs were dominated by small Reticulofenestra and were the highest between ∼ 4.7–4.1 Ma (> 50–80 × 109 ) and ∼ 3.5 Ma (75 × 109 ), with two distinct reductions at ∼ 4.8 and between ∼ 4.1–3.8 Ma. Consistently low NARs (< 30 × 109 ) were established after 3.3 Ma (Fig. S1).
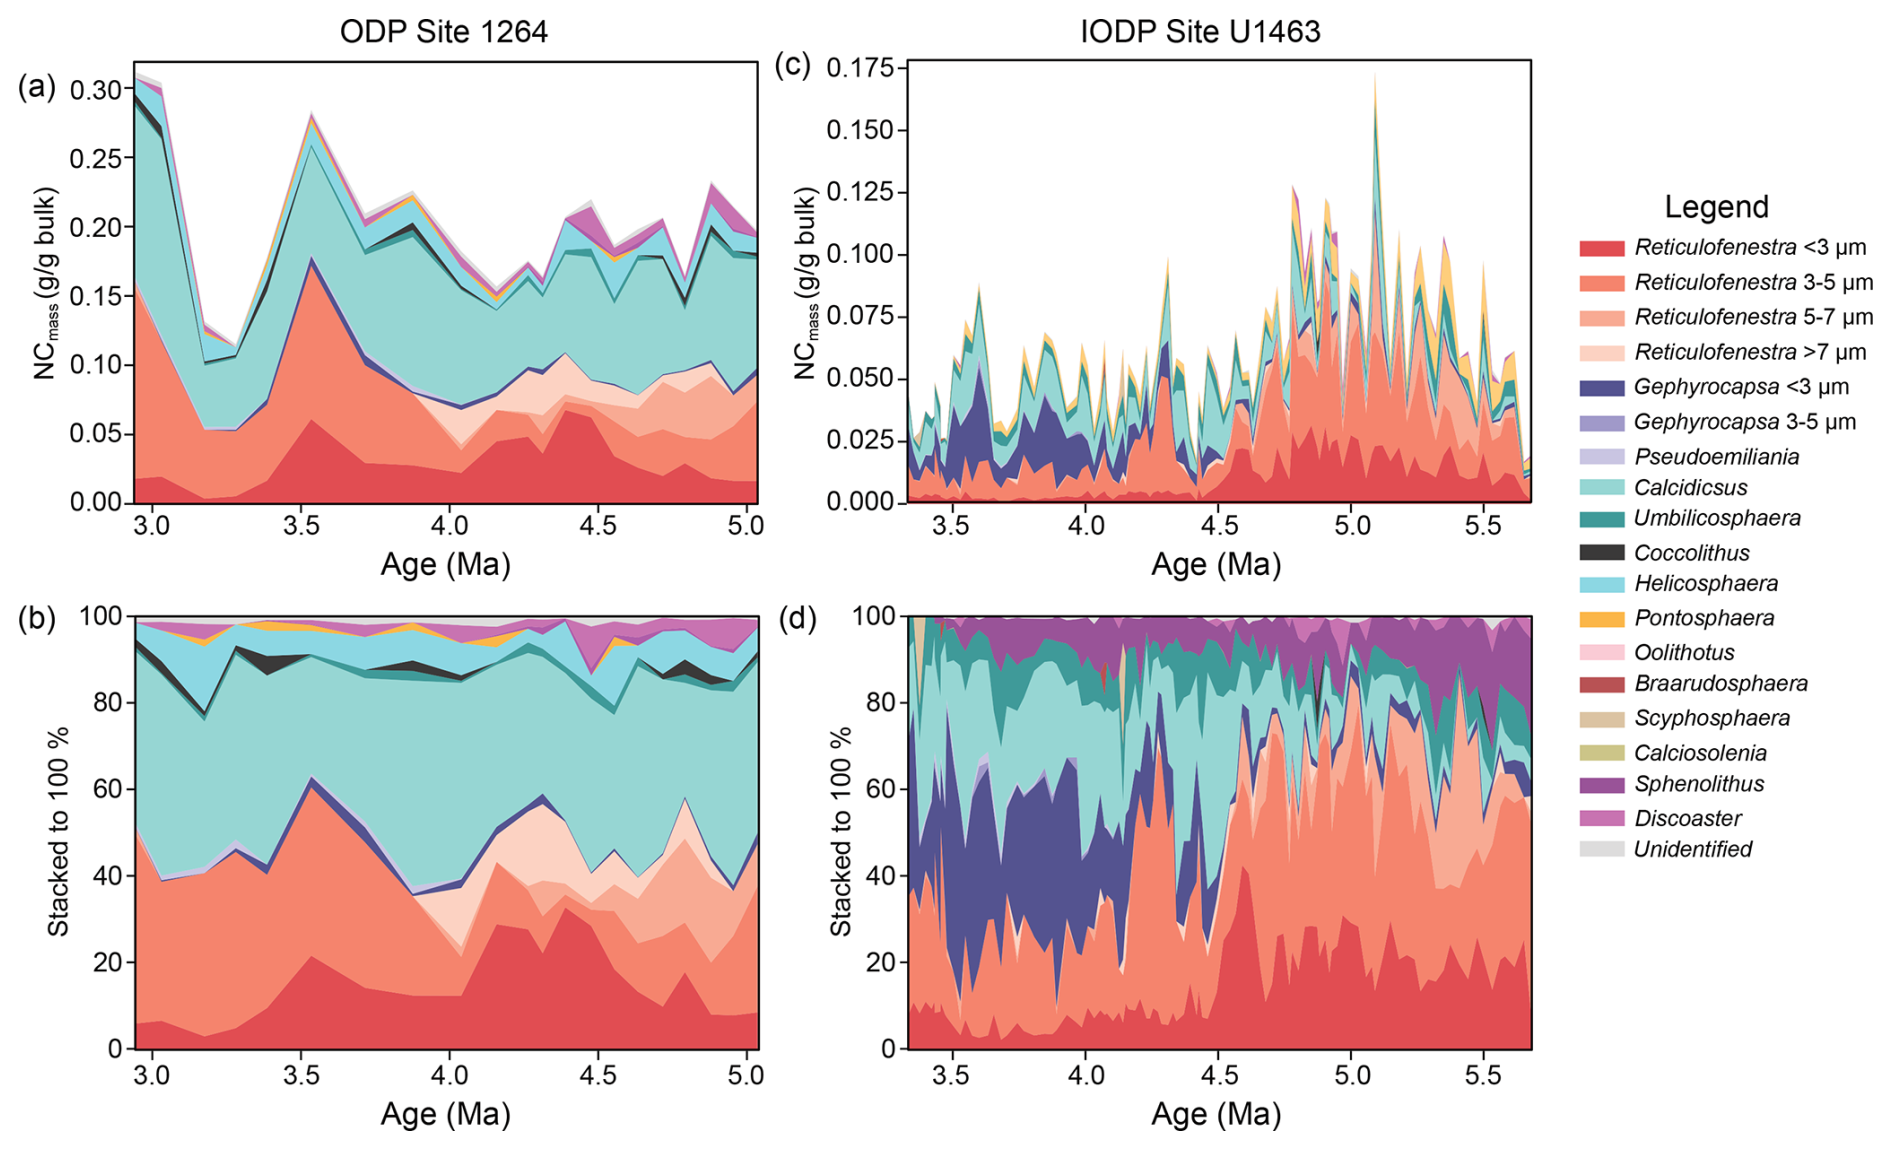
Figure 4Calcareous nannofossil CaCO3 mass (NCmass) contribution at ODP Site 1264. (a, c) Absolute (g g−1 bulk) and (b, d) relative (%) CaCO3 mass contributions from all identified taxa at (a, b) ODP Site 1264 and (c, d) IODP Site U1463, plotted against age (Ma).
The NCmass records for ODP Site 1264 and IODP Site U1463 provide additional information regarding the CaCO3 contribution of different nannofossil taxa relative to their abundance. The stacked plots of mass contributions (Fig. 4a–d) show that Noelaerhabdaceae species and Calcidiscus spp. were the main contributors of carbonate across the late Miocene and Pliocene at both sites. At Site 1264, the carbonate mass contribution from large placoliths such as Calcidiscus spp. is much higher compared to their relative abundance and remained relatively stable (between ∼ 26 %–50 % of total NCmass) across the study interval. In contrast, the relative contributions from Reticulofenestra species changed notably between ∼ 4.1–4 Ma. Before this time, all Reticulofenestra species contributed uniformly, with values ranging between ∼ 10 %–20 % of the total NCmass (Fig. 4c). Small Reticulofenestra dominated between 4.6–4.1 Ma, with values reaching up to ∼ 32 % of the total NCmass (Fig. 4c). After 4 Ma the relative carbonate mass contribution was dominated by medium Reticulofenestra (∼ 10 %–45 %), with small Reticulofenestra at lower contributions of ∼ 10 %–22 % until 3.4 Ma. At the same time, the mass contribution from large Reticulofenestra species plummeted, following their reduction in absolute abundance. After 3.4 Ma, small Reticulofenestra no longer contributed significantly to the total NCmass, with medium Reticulofenestra remaining as the main representative of the genus. All other species had rather stable carbonate mass contributions of 10 %–20 % across the study interval, with half of these contributions most of the time coming from Helicosphaera spp.
A different pattern is observed at the NW Australian shelf Site U1463. The main change here occurred at 4.5 Ma. Before this time, Calcidiscus spp. contributed minimally (rarely exceeding 15 %), and the carbonate mass was mainly derived from small- and medium-sized Reticulofenestra species. After 4.5 Ma, Calcidiscus showed an increased contribution to the total NCmass, with values ranging between ∼ 20 %–40 %. Between 4.4 and 4.2 Ma, medium Reticulofenestra was the main carbonate contributor of the Noelaerhabdaceae (up to ∼ 62 %), with small Reticulofenestra playing a much smaller role (∼ 5 %–12 %). After 4.2 Ma, small Gephyrocapsa started contributing markedly to the total NCmass and became the most effective carbonate mass producer (sometimes reaching > 45 %) within the Noelaerhabdaceae, at least until 3.5 Ma.
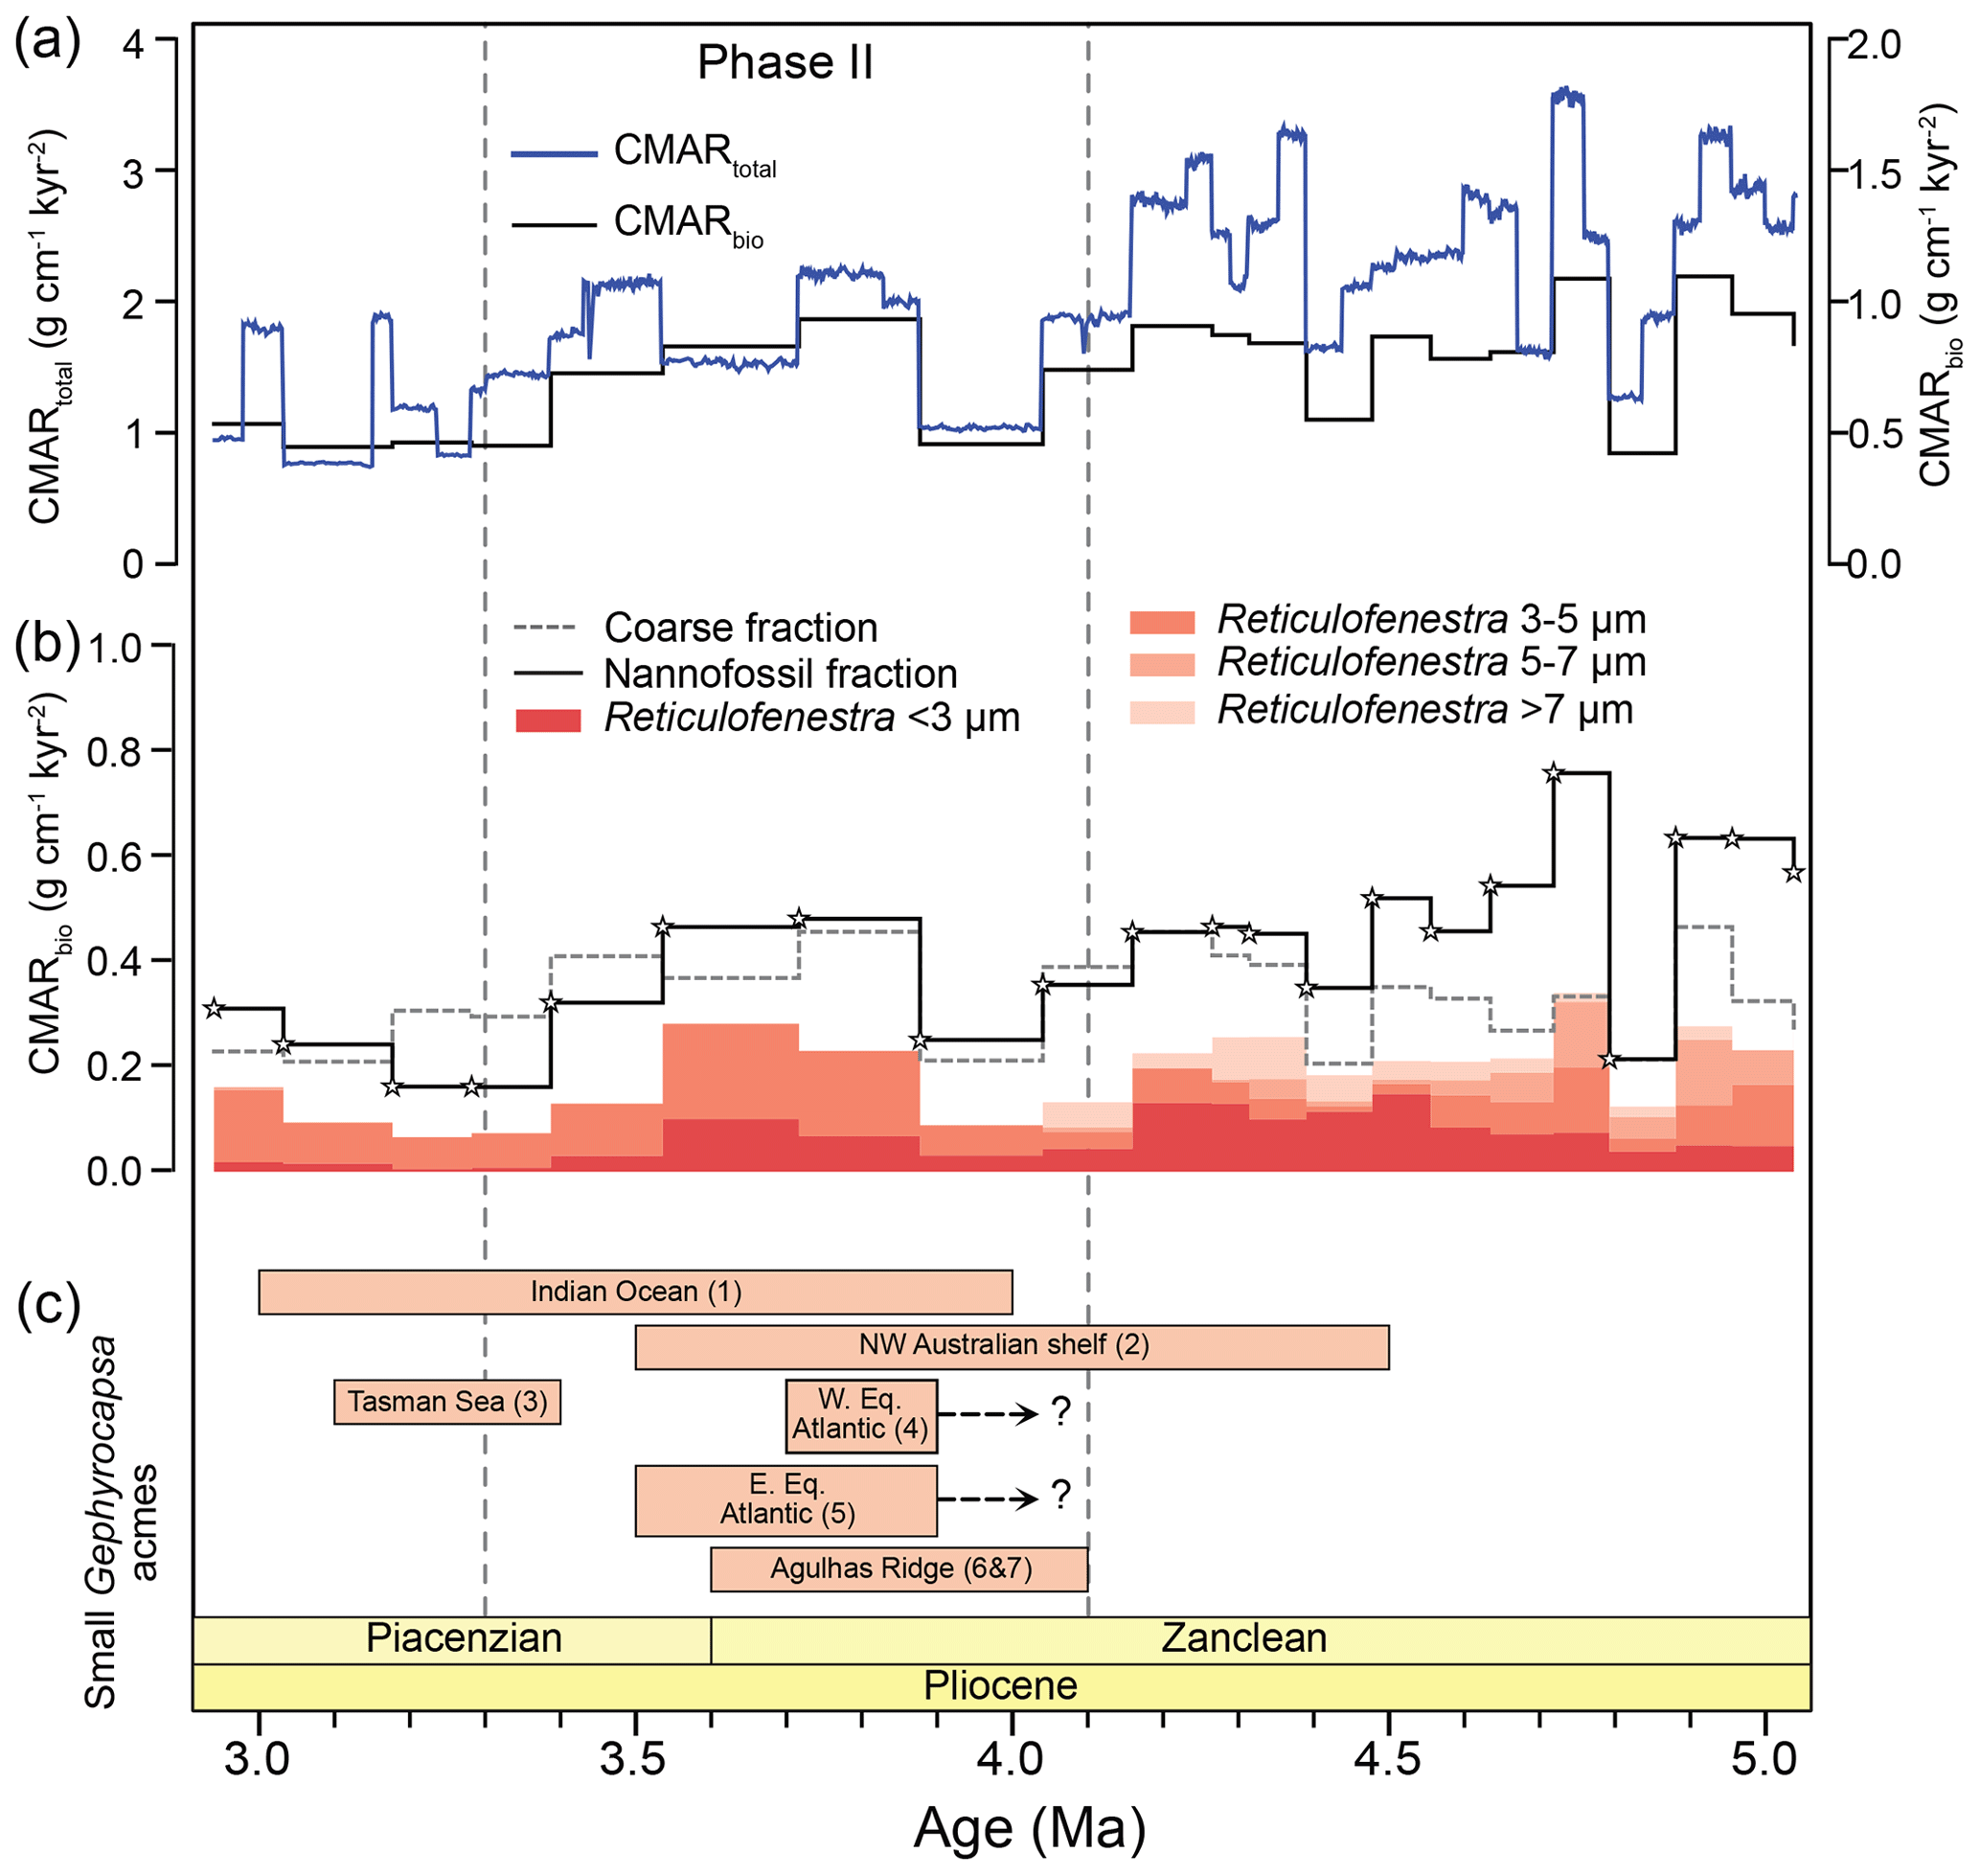
Figure 5Early Pliocene changes in calcareous nannofossil and foraminifera CaCO3 mass accumulation rates at ODP Site 1264. (a) Total (blue line, CMARtotal; Drury et al., 2021) and biogenic (black line, CMARbio; calcareous nannofossil and foraminifera) CaCO3 accumulation rates at ODP Site 1264. Note the different scales on the left and right y axes. (b) Calcareous nannofossil (black line, CMARnannos), foraminifera (dashed line, CMARforams), and Reticulofenestra species' CaCO3 accumulation rates (red color shades). The investigated samples are indicated with stars. (c) Synthesis of small Gephyrocapsa acmes reported in the literature; (1) Indian Ocean DSDP sites (Young, 1990); (2) NW Australian shelf, IODP Sites U1463 and U1464 (Karatsolis et al., 2020, 2022); (3) Tasman Sea, ODP Site 1172 (Ballegeer et al., 2012); (4) western equatorial Atlantic, ODP Site 926 (Gibbs et al., 2005); (5) eastern equatorial Atlantic, ODP Site 662 (Gibbs et al., 2005); (6) Agulhas Ridge, ODP Site 1088 (Marino and Flores, 2002); and (7) Agulhas Plateau, IODP Site U1475 (Tangunan et al., 2024a, b).
The total CMAR, as presented in Drury et al. (2021), reveals reductions in carbonate burial in the South Atlantic, mainly centered at 4.1 and 3.3 Ma (Fig. 5a). The sum of CMARnannos and CMARforams (CMARbio; Fig. 5a) largely follows these CMAR trends because it is mainly driven by the same changes in sedimentation rates. Calcareous nannofossils were greater contributors to the total CMAR than foraminifera before ∼ 3.5 Ma (Fig. 5b). Between 3.5–3.2 Ma, foraminifera contributed more than nannofossils, and < 3.2 Ma the pattern was again reversed, with nannofossils contributing slightly more (Fig. S2 in the Supplement). Overall, the long-term CMAR patterns seem to be better reflected by CMARnannos (Fig. 5b), with a decreasing trend across the study interval (Fig. S3 in the Supplement). On the other hand, CMARforams remained, on average, rather stable. This confirms similar observations in Suchéras-Marx and Henderiks (2014) and supports the hypothesis that the CMAR (and productivity) patterns at Site 1264 were mostly driven by calcareous nannofossils.
In terms of nannoplankton community changes driving the observed changes, the 4.1 Ma stepwise decrease coincided with a reduction in mass contribution and accumulation rates of small and large Reticulofenestra (Fig. 4b), while the decrease at 3.3 Ma matches a distinct decrease in sedimentation rates and nannofossil fluxes that impacted all taxa similarly but was mainly reflected in the near disappearance of small Reticulofenestra (Fig. 5b). The significant difference between CMAR and CMARbio estimates (note the different y-axis scale in Fig. 5a) demonstrates a conspicuous gap in accounting for different sources of (biogenic) carbonate within the sediment. We argue that this “gap carbonate” must reside within the fine fraction (since we assumed all > 63 µm wt % equates to carbonate wt %; see assumption 1 above), most likely representing fragmented coccoliths and foraminifers or amorphous carbonate from partially dissolved coccoliths and shells and, to a lesser extent, juvenile foraminifers and other carbonate fragments within the 20–63 µm fraction. If we quantify this gap as the relative offset from CMAR (%), it shows a decreasing trend across the study interval (Fig. S4 in the Supplement), further supporting that calcareous nannofossils drive the trends.
The most pronounced change in nannofossil communities, which characterized the end of the biogenic bloom over the NW Australian shelf (IODP Sites U1463 and U1464), was the abrupt decrease in absolute and relative abundance of small Reticulofenestra from 4.6–4.4 Ma, followed by a progressive dominance (acme) of small Gephyrocapsa (Karatsolis et al., 2020). The NCmass considerations reveal a more complex pattern. The main carbonate contributors before this turnover were the small- and medium-sized Reticulofenestra, with a distinct decrease in the former at 4.5 Ma and the latter at 4.2 Ma. After this time, small Gephyrocapsa and Calcidiscus spp. became the main carbonate-contributing species (Fig. 4c and d).
The relative and absolute nannofossil abundances, as well as the NCmass data at ODP Site 1264, reveal an important difference between the coccolithophore communities of the NW Australian shelf and the South Atlantic across the termination of the biogenic bloom. Small, bloom-forming species were successful in both regions during the biogenic bloom. Together with the other Reticulofenestra species, they produced the majority of nannoplankton-derived carbonate. The decrease in carbonate burial at Site 1264 (at the end of Phase I and Phase II; Fig. 5a) and the low-latitude PP decline at Site U1463 (Fig. 2) mainly coincided with reductions in the abundance and carbonate mass contributions of small and large Reticulofenestra. However, at Site 1264, this was followed by a rise in dominance of medium Reticulofenestra, while at the NW Australian shelf, small Gephyrocapsa became the dominant nannofossil species and carbonate producer. These regional ecological characteristics broadly correlate with the CMAR at Site 1264 (Drury et al., 2021) and low-latitude PP patterns at Site U1463 (Karatsolis et al., 2022; Fig. 2). Our results therefore support the fact that the ecological dominance and absolute abundances of small, bloom-forming Reticulofenestra closely reflect CaCO3 export production and carbonate burial during the final stages of the biogenic bloom in both the South Atlantic and the NW Australian shelf. In turn, this also suggests that regional conditions determined the ecological success of the coccolithophores that controlled carbonate export production and provides an explanation for a delayed termination of the biogenic bloom at mid-latitude Site 1264 compared to the lower latitudes.
A calcareous nannofossil acme period represents a stratigraphic interval bounded by a sharp increase and decrease in relative abundance of a certain species. These acme periods, which are often short-lived and regionally expressed, mark intervals when a species either starts contributing to the assemblage or exceeds its long-term average abundance. Based on this broad definition, small Gephyrocapsa acmes, lasting between ∼ 4.5–3.5 Ma on the NW Australian shelf (Fig. 4c and d), have been reported from all major ocean basins during the early to middle Pliocene (Auer et al., 2019; Ballegeer et al., 2012; Gibbs et al., 2004; Marino and Flores, 2002; Rio, 1982). Specifically, higher abundances of small Gephyrocapsa have been reported in the gateway between the Pacific and the Indian oceans (ODP Site 1172; Figs. 1 and 4c; Ballegeer et al., 2012), as well as across the Indian Ocean between 4–3 Ma (Young, 1990). An early Pliocene Gephyrocapsa acme was also reported in the western and eastern equatorial Atlantic at ODP Sites 926 and 662 (Gibbs et al., 2005) (Figs. 1 and 4c). However, Gephyrocapsa abundances were low compared to other small Reticulofenestra species (see Figs. 3 and 10 from Gibbs et al., 2005), and therefore their relative abundances were closer to those observed at Site 1264. Nannofossil census counts from Blair et al. (2017b) indicate that this small Gephyrocapsa acme at ODP Site 926 started at ∼ 3.9 and lasted until ∼ 3.6 Ma. Marino and Flores (2002) reported the small Gephyrocapsa acme in the subantarctic sector of the Atlantic Ocean (ODP Site, 1088), a site located relatively close to ODP Site 1264 (Fig. 1). At this site, small Gephyrocapsa exceeded 60 % of the small coccolith assemblage (< 5 µm), and the acme lasted from the base occurrence (base) of Discoaster tamalis (∼ 3.92–4.13 Ma; Young, 1998) until the top of Sphenolithus spp. (3.61 Ma; Raffi et al., 2020; Fig. 3b). Because of the relatively small distance between ODP Site 1264 and ODP Site 1088, we suspect strong regional (paleo)oceanographic controls on the occurrence (and dominance) of small Gephyrocapsa in the South Atlantic, attributed to different ocean circulation patterns. Today, ODP Site 1264 is located within the South Atlantic Gyre, while ODP Site 1088 is influenced by warmer Indian Ocean surface waters transported into the area by the Agulhas Current (Fig. S5). Site U1475, which is also located under the direct path of the Agulhas Current (Fig. 1), showed variable small Gephyrocapsa relative abundances between 5–3.3 Ma, ranging between 1 %–17 % (Tangunan et al., 2024b). At this site, small Gephyrocapsa rose in abundance already at ∼ 4.4 Ma and was more abundant than small Reticulofenestra for a short interval between 4.1–4 Ma, in good accordance with the acme reported at ODP Site 1088. Taking everything into account, it appears that the Gephyrocapsa acmes started earlier and were more pronounced at Indian Ocean sites (Karatsolis et al., 2020; Auer et al., 2019; Young et al., 1990), as well as at sites potentially influenced by Indian Ocean water masses (e.g., Site, 1088; Marino and Flores 2002) (Fig. 5c). At the Atlantic Ocean sites, although small Gephyrocapsa was present, it never dominated the assemblage. This could be attributed to the preference of modern descendant species of this genus for warm, tropical-to-subtropical stratified waters (e.g., Auer et al., 2019, and references therein). Finally, although both small Gephyrocapsa and medium-sized Reticulofenestra are commonly considered ecologically similar to small Reticulofenestra (opportunistic; e.g., Maiorano et al., 2021, and references therein), they represented smaller numbers of cells/lower biomass and export production, only rising in dominance shortly after the termination of the biogenic bloom in their respective environments. This points to important physiological and ecological contrasts, including differences in growth and calcification rates, among the opportunistic species in the Pliocene. These are worth exploring with additional morphometric and geochemical analyses (e.g., Zhang et al., 2025). Such analyses will also help further constrain the ecological affinity of the early small Gephyrocapsa forms and the evolutionary importance of their acmes.
Regarding other common species, the South Atlantic and Indian Ocean records show a clear stepwise decrease (from average ∼ 20 % to 6 %) in the abundance of large Reticulofenestra (> 5 µm), which has previously been documented at IODP Site U1475 (Fig. 1), located at the gateway between the Indian Ocean and the South Atlantic (Tangunan et al., 2024a, b). This sustained reduction started at ∼ 4.6 Ma and was also observed on the NW Australian shelf (Site U1463; Karatsolis and Henderiks, 2023) and in the South Atlantic (Site, 1264; Fig. 3b and d), suggesting that it can be considered biostratigraphically synchronous across ocean basins and depositional environments.
This study demonstrates that coccolithophores belonging to the Noelaerhabdaceae family (Gephyrocapsa and Reticulofenestra) contributed about half of the CaCO3 mass derived from calcareous nannofossils during the Pliocene. Because of their distinct ecological preferences, they may explain the observed diachronous end of the biogenic bloom in the Atlantic and Indian oceans. Specifically, Reticulofenestra species were the most productive, driving the CMAR changes during the main stages of the biogenic bloom in both ocean basins. During the biogenic bloom, small Reticulofenestra played an important role as the most abundant species and a major CaCO3 producer. On the other hand, the ecological dominance of small Gephyrocapsa never led to high CMAR, and their first high occurrences during the Pliocene can be considered an ecological or evolutionary adaptation to specific climatic conditions within the post-biogenic bloom ocean (i.e. warmer and more stratified surface waters). More high-resolution calcareous nannofossil time series are needed to gain additional information on the assemblage signatures across the end of the biogenic bloom, as well as the (paleo)biogeography and mechanisms that led to the small Gephyrocapsa acmes in different oceanic basins during the early Pliocene. Understanding the ecological and evolutionary drivers behind major perturbations in carbonate burial will bridge the gap between changes in (shorter-term) phytoplankton dynamics and their resulting (longer-term) biogeochemical imprints.
The supplementary information and data supporting this study have been deposited in Zenodo and can be accessed at https://doi.org/10.5281/zenodo.19854421 (Karatsolis et al., 2026).
The sediment samples related to this study are archived at the Department of Earth Sciences of Uppsala University (Uppsala, Sweden). The prepared slides containing the calcareous nannofossils presented in the paper are stored at the Department of Earth Sciences of Fribourg University (Fribourg, Switzerland).
The supplement related to this article is available online at https://doi.org/10.5194/jm-45-475-2026-supplement.
BTK and JH conceived the study and designed the research hypothesis. BTK and JA analyzed the samples and generated biostratigraphic and calcareous nannofossil assemblage records. JA, JH, and BTK prepared and revised the figures. BTK and JH drafted the manuscript text. All authors contributed to discussions and the interpretation of the results.
The contact author has declared that none of the authors has any competing interests.
Publisher's note: Copernicus Publications remains neutral with regard to jurisdictional claims made in the text, published maps, institutional affiliations, or any other geographical representation in this paper. The authors bear the ultimate responsibility for providing appropriate place names. Views expressed in the text are those of the authors and do not necessarily reflect the views of the publisher.
This research uses samples that were collected by the Ocean Drilling Program Leg 208. We would therefore like to thank all scientists, technicians, and the JOIDES Resolution staff for their continuous efforts in promoting scientific ocean drilling. We would additionally like to thank the curators at the Bremen Core repository for providing the ODP Site 1264 samples.
This research has been supported by the Swedish Research Council (Vetenskapsrådet; grant no. 2016-04434 to JH) and the European Union’s Horizon 2020 research and innovation program under the Marie Skłodowska-Curie Actions (grant no. 945380 to BTK).
This paper was edited by Emanuela Mattioli and reviewed by Baptiste Suchéras-Marx and one anonymous referee.
Auer, G., De Vleeschouwer, D., Smith, R. A., Bogus, K., Groeneveld, J., Grunert, P., Castañeda, I. S., Petrick, B., Christensen, B., Fulthorpe, C., Gallagher, S. J., and Henderiks, J.: Timing and pacing of Indonesian Throughflow restriction and its connection to late Pliocene climate shifts, Paleoceanogr. Paleoclimatol., 34, 635–657, https://doi.org/10.1029/2018PA003512, 2019.
Ballegeer, A. M., Flores, J. A., Sierro, F. J., and Andersen, N.: Monitoring fluctuations of the Subtropical Front in the Tasman Sea between 3.45 and 2.45 Ma (ODP site 1172), Palaeogeogr. Palaeoclimatol. Palaeoecol., 313–314, 215–224, https://doi.org/10.1016/j.palaeo.2011.11.001, 2012.
Blair, S. A., Bergen, J. A., de Kaenel, E., Browning, E., and Boesiger, T. M.: Upper Miocene–Lower Pliocene taxonomy and stratigraphy in the circum North Atlantic Basin: Radiation and extinction of Amauroliths, Ceratoliths and the D. quinqueramus lineage, J. Nannoplankton Res., 37, 113–144, 2017a.
Blair, S. A., Bergen, J. A., de Kaenel, E. P., Browning, E. L., and Boesiger, T.: Upper Miocene–Lower Pliocene nannofossil taxonomy and stratigraphy of ODP Site 154-926, 3510–5480 ka, PANGAEA [data set], https://doi.org/10.1594/PANGAEA.879333, 2017b.
Bordiga, M., Bartol, M., and Henderiks, J.: Absolute nannofossil abundance estimates: Quantifying the pros and cons of different techniques, Rev. Micropaleontol., 58, 155–165, https://doi.org/10.1016/j.revmic.2015.05.002, 2015.
Dickens, G. R. and Owen, R. M.: The Latest Miocene-Early Pliocene biogenic bloo.: A revised Indian Ocean perspective, Mar. Geol., 161, 75–91, https://doi.org/10.1016/S0025-3227(99)00057-2, 1999.
Diester-Haass, L., Meyers, P. A., and Vidal, L.: The late Miocene onset of high productivity in the Benguela Current upwelling system as part of a global pattern, Mar. Geol., 180, 87–103, https://doi.org/10.1016/S0025-3227(01)00207-9, 2002.
Diester-Haass, L., Billups, K., and Emeis, K. C.: In search of the late Miocene-early Pliocene “biogenic bloom” in the Atlantic Ocean (Ocean Drilling Program Sites 982, 925, and 1088), Paleoceanography, 20, 1–13, https://doi.org/10.1029/2005PA001139, 2005.
Drury, A. J., Liebrand, D., Westerhold, T., Beddow, H. M., Hodell, D. A., Rohlfs, N., Wilkens, R. H., Lyle, M., Bell, D. B., Kroon, D., Pälike, H., and Lourens, L. J.: Table 1-1: Calibrated XRF data and derived measurements from Site 1264 combined with some Site 1265 data, PANGAEA [data set], https://doi.org/10.1594/PANGAEA.936700, 2020.
Drury, A. J., Liebrand, D., Westerhold, T., Beddow, H. M., Hodell, D. A., Rohlfs, N., Wilkens, R. H., Lyle, M., Bell, D. B., Kroon, D., Pälike, H., and Lourens, L. J.: Climate, cryosphere and carbon cycle controls on Southeast Atlantic orbital-scale carbonate deposition since the Oligocene (30–0 Ma), Clim. Past, 17, 2091–2117, https://doi.org/10.5194/cp-17-2091-2021, 2021.
Farrell, J. W., Raffi, I., Janecek, T. C., Murray, D. W., Levitan, M., Dadey, K. A., Emeis, K.-C., Lyle, M., Flores, J.-A., and Hovan, S.: Late Neogene sedimentation patterns in the Eastern Equatorial Pacific, Proc. Ocean Drill. Program, 138 Sci. Results, (August), https://doi.org/10.2973/odp.proc.sr.138.143.1995, 1995.
Gibbs, S., Shackleton, N., and Young, J.: Orbitally forced climate signals in mid-Pliocene nannofossil assemblages, Mar. Micropaleontol., 51, 39–56, https://doi.org/10.1016/j.marmicro.2003.09.002, 2004.
Gibbs, S. J., Young, J. R., Bralower, T. J., and Shackleton, N. J.: Nannofossil evolutionary events in the mid-Pliocene: an assessment of the degree of synchrony in the extinctions of Reticulofenestra pseudoumbilicus and Sphenolithus abies, Palaeogeogr. Palaeoclimatol. Palaeoecol., 217, 155–172, https://doi.org/10.1016/j.palaeo.2004.11.005, 2005.
Hammer, Ø., Harper, D. A. T., and Ryan, P. D.: PAST: Paleontological Statistics Software Package for education and data analysis, Palaeontol. Electron., 4, 1–9, 2001.
Karatsolis, B.-T. and Henderiks, J.: Late Neogene nannofossil assemblages as tracers of ocean circulation and paleoproductivity over the NW Australian shelf, Clim. Past, 19, 765–786, https://doi.org/10.5194/cp-19-765-2023, 2023.
Karatsolis, B. T., De Vleeschouwer, D., Groeneveld, J., Christensen, B., and Henderiks, J.: The Late Miocene to Early Pliocene “Humid Interval” on the NW Australian Shelf: Disentangling climate forcing from regional basin evolution, Paleoceanogr. Paleoclimatol., 35, https://doi.org/10.1029/2019PA003780, 2020.
Karatsolis, B.-T., Lougheed, B. C., De Vleeschouwer, D., and Henderiks, J.: Abrupt conclusion of the late Miocene-early Pliocene biogenic bloom at 4.6–4.4 Ma, Nat. Commun., 13, 1–9, https://doi.org/10.1038/s41467-021-27784-6, 2022.
Karatsolis, B. T., Asanbe, J., and Henderiks, J.: Pliocene calcareous nannofossil biostratigraphy and assemblage records from ODP Site 1264 (Leg 208), Zenodo [data set], https://doi.org/10.5281/zenodo.19854421, 2026.
Keating-Bitonti, C. R. and Peters, S. E.: Influence of increasing carbonate saturation in Atlantic bottom water during the late Miocene, Palaeogeogr. Palaeoclimatol. Palaeoecol., 518, 134–142, https://doi.org/10.1016/j.palaeo.2019.01.006, 2019.
Koch, C. and Young, J. R.: A simple weighing and dilution technique for determining absolute abundances of coccoliths from sediment samples, J. Nannoplankt. Res., 29, 67–69, https://doi.org/10.58998/jnr2150, 2007.
Maiorano, P., Herbert, T. D., Marino, M., Bassinot, F., Bazzicalupo, P., Bertini, A., Girone, A., Nomade, S., and Ciaranfi, N.: Paleoproductivity modes in central Mediterranean during MIS 20–MIS 18: Calcareous plankton and alkenone variability, Paleoceanogr. Paleoclimatol., 36, e2021PA004259, https://doi.org/10.1029/2021PA004259, 2021.
Marino, M. and Flores, J. A.: Miocene to Pliocene calcareous nannofossil biostratigraphy at ODP Leg 177 Sites 1088 and 1090, Mar. Micropaleontol., 45, 291–307, https://doi.org/10.1016/S0377-8398(02)00033-6, 2002.
Mather, B. R., Müller, R. D., Zahirovic, S., Cannon, J., Chin, M., Ilano, L., Wright, N. W., Alfonso, C., Williams, S., Tetley, M., and Merdith, A.: Deep time spatio-temporal data analysis using pyGPlates with Plate Tectonic Tools and GPlately, Geosci. Data J., 11, 3–10, https://doi.org/10.1002/gdj3.185, 2023.
Müller, R. D., Zahirovic, S., Williams, S. E., Cannon, J., Seton, M., Bower, D. J., Tetley, M. J., Heine, C., Le Breton, E., Liu, S., Russell, S. H., Yang, T., Leonard, J., and Gurnis, M.: A global plate model including lithospheric deformation along major rifts and orogens since the Triassic, Tectonics, 38, 1884–1907, https://doi.org/10.1029/2018TC005462, 2019.
Raffi, I., Backman, J., Fornaciari, E., Pälike, H., Rio, D., Lourens, L., and Hilgen, F.: A review of calcareous nannofossil astrobiochronology encompassing the past 25 million years, Quaternary Sci. Rev., 25, 3113–3137, https://doi.org/10.1016/j.quascirev.2006.07.007, 2006.
Raffi, I., Wade, B. S., Pälike, H., Beu, A. G., Cooper, R., Crundwell, M. P., Krijgsman, W., Moore, T., Raine, J. I., Sardella, R., and Vernyhorova, Y. V.: The Neogene Period, in: Geologic Time Scale 2020, edited by: Gradstein, F. M., Ogg, J. G., Schmitz, M. D. and Ogg, G. M., 1141–1215, https://doi.org/10.1016/B978-0-12-824360-2.00029-2, 2020.
Reghellin, D., Coxall, H. K., Dickens, G. R., Galeotti, S., and Backman, J.: The late Miocene-early Pliocene biogenic bloom in the eastern equatorial Pacific: New insights from Integrated Ocean Drilling Program Site U1335, Paleoceanogr. Paleoclimatol., 37, e2021PA004313, https://doi.org/10.1029/2021PA004313, 2022.
Rio, D.: The fossil distribution of coccolithophore genus Gephyrocapsa Kamptner and related Plio-Pleistocene chronostratigraphic problems, Initial Rep. Deep Sea, 68, 325–343, 1982.
Si, W. and Rosenthal, Y.: Reduced continental weathering and marine calcification linked to late Neogene decline in atmospheric CO2, Nat. Geosci., 12, 833–838, https://doi.org//10.1038/s41561-019-0450-3, 2019.
Suchéras-Marx, B. and Henderiks, J.: Downsizing the pelagic carbonate factory: Impacts of calcareous nannoplankton evolution on carbonate burial over the past 17 million years, Glob. Planet. Change 123, 97–109, https://doi.org/10.1016/j.gloplacha.2014.10.015, 2014.
Suchéras-Marx, B., Escarguel, G., Ferreira, J., Hammer, Ø.: Statistical confidence intervals for relative abundances and abundance-based ratios: Simple practical solutions for an old overlooked question, Mar. Micropaleontol., 151, 101751, https://doi.org/10.1016/j.marmicro.2019.101751, 2019.
Tangunan, D. N., Flores, J. A., LeVay, L. J., Jimenez-Espejo, F. J., Coenen, J. J., Berke, M. A., de Azevedo, A. Q., Fuertes, M. A., Gruetzner, J., Starr, A., and Hall, I. R.: Southern Ocean and southern African monsoon forcing of the subtropical Indian Ocean early Pliocene “Biogenic Bloom”, Paleoceanogr. Paleoclimatol., 39, e2024PA004927, https://doi.org/10.1029/2024PA004927, 2024a.
Tangunan, D., Flores, J.-A., and LeVay, L.: Absolute and relative abundances of calcareous nannofossils at IODP Site U1475 during the early Pliocene, Zenodo [data set], https://doi.org/10.5281/zenodo.14291181, 2024b.
Young, J.: Size variation of Neogene Reticulofenestra coccoliths from Indian Ocean DSDP Cores, J. Micropalaeontol., 9, 71–85, https://doi.org/10.1144/jm.9.1.71, 1990.
Young, J. R.: Neogene, in: Calcareous Nannofossil Biostratigraphy, edited by: Bown, P. R., British Micropalaeontological Society Publication Series, 225–265, ISBN 0 412 78970 1, 1998.
Young, J. R. and Ziveri, P.: Calculation of coccolith volume and its use in calibration of carbonate flux estimates, Deep-Sea Res. Pt. II, 47, 1679–1700, https://doi.org/10.1016/S0967-0645(00)00003-5, 2000.
Zachos, J. C., Kroon, D., Blum, P., Bowles, J. A., Gaillot, P., Hasegawa, T., Hathorne, E. C., Hodell, D. A., Kelly, D. C., Jung, J.-H., Keller, S. M., Lee, Y. S., Leuschner, D. C., Liu, Z., Lohmann, K. C., Lourens, L., Monechi, S., Nicolo, M., Raffi, I., Riesselman, C., Röhl, U., Schellenberg, S. A., Schmidt, D. N., Sluijs, A., Thomas, D., Thomas, E., and Vallius, H.: Proceedings of the Ocean Drilling Program, 208 Initial Reports, Proceedings of the Ocean Drilling Program, Ocean Drilling Program, 208, https://doi.org/10.2973/odp.proc.ir.208.2004, 2004.
Zhang, H., Wijker, R., Hernandez-Almeida, I., Ma, X., Wang, X.,Tanner, T., and Stoll, H.: Shallower living depth instead of higher seawater alkalinity enhanced calcification in bloom-forming coccolithophores during their Pleistocene acme event, AGU Advances, 6, e2024AV001609, https://doi.org/10.1029/2024AV001609, 2025.