
the Creative Commons Attribution 4.0 License.
the Creative Commons Attribution 4.0 License.
 | 31 Aug 2026

Temporal and spatial variability in mudflat and mangrove foraminiferal eDNA communities in subtropical environments and their implication for sea-level reconstruction
Zhaojia Liu
Howard K. Y. Yu
Magali Schweizer
Jennifer S. Walker
Celia Schunter
Reconstructing relative sea level (RSL) is essential for understanding coastal evolution and mitigating impacts of climate change. Foraminiferal assemblages are established indicators for past sea levels, requiring modern training sets that link assemblage composition to known tidal elevations. However, seasonal and spatial variability in assemblages can affect reconstruction reliability. Foraminiferal environmental DNA (eDNA) has recently been validated as a robust proxy for reconstructing past sea levels. However, eDNA assemblages may be subject to similar spatiotemporal variability along with additional factors affecting DNA transport and preservation. The spatiotemporal stability of intertidal eDNA assemblages – and their influence on RSL reconstruction – remains uncertain. We conducted a 2-year eDNA monitoring study at three stations of varying tidal elevation, sampling across dry and wet seasons to assess variability in mangrove and mudflat environments of Hong Kong. Mid-mangrove eDNA communities exhibited temporal and spatial stability, whereas mudflat and upper-mangrove assemblages, particularly among monothalamous foraminifera, showed pronounced seasonal shifts. Despite this variability in the upper mangrove, eDNA-based elevation estimates in mangrove environments consistently aligned with observed elevations (within 95 % credible intervals), demonstrating reliable calibration for paleoenvironmental applications. However, mudflat samples exhibited an overprediction bias, especially during the wet season, reflecting their heightened sensitivity to exogenous eDNA inputs. These findings highlight the need to account for seasonal and environmental variability in eDNA-based RSL reconstruction. Stable mangroves are optimal for establishing elevation–assemblage relationships, while transitional or mudflat zones require caution due to higher variability. Our study provides guidance for applying foraminiferal eDNA as a proxy in past sea-level reconstruction in dynamic coastal settings.
- Article
(4620 KB) - Full-text XML
-
Supplement
(512 KB) - BibTeX
- EndNote


Coastal ecosystems face unprecedented pressures from climate change and sea-level rise, requiring robust approaches to monitor environmental change and guide management decisions. Foraminifera are valuable bioindicators in coastal environments because they are sensitive to environmental stressors, including salinity, pollution, temperature, nutrient availability, eutrophication, and climate-driven changes (Scott et al., 2007; Romano et al., 2021; Koukousioura et al., 2011; Youssef et al., 2021; Frontalini et al., 2009; Bouchet et al., 2021). They also contribute to essential ecosystem services through nutrient cycling and sediment processes (Langlet et al., 2020; Piña-Ochoa et al., 2010; Risgaard-Petersen et al., 2006), making their monitoring valuable for integrated coastal management by assessing both current ecosystem health and historical environmental change. Among their various applications, an important use of foraminifera is to reconstruct past relative sea level (RSL) changes, which is essential for understanding coastal evolution and predicting future changes (Khan et al., 2017; Tan et al., 2023; Xiong et al., 2018). Foraminifera are sensitive to the frequency and duration of tidal inundation, forming vertically zoned assemblages along elevation gradients in intertidal habitats (Berkeley et al., 2009; Scott and Medioli, 1978). Traditional RSL reconstructions rely on morphological identification of foraminiferal tests in sediment cores, calibrated with modern training sets that relate community composition to tidal elevation (Barnett et al., 2016; Rush et al., 2021).
A key challenge is the variability in surface foraminiferal assemblages, which fluctuate both temporally (seasonal and interannual variation) and spatially at sub-meter scales (Berkeley et al., 2008; Buragohain and Ghosh, 2021; Horton and Edwards, 2003; Buzas, 1970; Buzas et al., 2015; Kemp et al., 2011; Richirt et al., 2020). This variability can bias RSL reconstructions, especially because modern training sets are often based on single samples collected at one time point per site (Edwards and Horton, 2000; Kemp et al., 2013; Scott and Medioli, 1978; Yu et al., 2025; Horton and Edwards, 2006; Horton and Culver, 2008). To minimize this effect, RSL studies typically use dead foraminifera assemblages for calibration (Horton, 1999; Yu et al., 2025; Hawkes et al., 2010) because they are more stable over time and space (Hayward et al., 1996; Kemp et al., 2011; Murray and Alve, 2000; Scott et al., 2007; Walker et al., 2020). In contrast, live foraminiferal assemblages are more responsive to short-term environmental variability. Nevertheless, recent work shows that accounting for the temporal and spatial variability in dead assemblages can further improve RSL reconstruction accuracy (Walker et al., 2020).
Environmental DNA (eDNA) analysis has recently emerged as a promising alternative to conventional morphological approaches for studying foraminifera (Pawlowski et al., 2014). The application of eDNA techniques to foraminiferal community analysis enhances the ability to detect subtle ecological shifts in transitional ecosystems before visible habitat alterations occur (Singer et al., 2023). Furthermore, foraminiferal eDNA shows distinct vertical zonation correlated with tidal elevation, enabling the use of transfer functions for late Holocene RSL reconstruction (Liu et al., 2025). eDNA can detect taxa that do not readily fossilize and are often missed in traditional studies, providing a more comprehensive and high-resolution view of foraminiferal diversity (Lejzerowicz et al., 2013; Pawłowska et al., 2014; Singer et al., 2023) and potentially improving the predictive power of RSL reconstructions (Liu et al., 2025).
Despite these advantages, eDNA-derived assemblages may be subject to similar challenges to morphologically based approaches, as they can be influenced by spatial and temporal variability. eDNA comprises genetic material from multiple sources, including DNA originating locally from deceased populations (autochthonous) or transported from external sources (allochthonous) (Ellegaard et al., 2020; Nagler et al., 2022), as well as propagules (Singer et al., 2023; Brinkmann et al., 2023; Fouet et al., 2024) and living individuals (Angeles et al., 2020), all of which may vary seasonally. Furthermore, eDNA is especially sensitive to temporal or small-scale spatial variations (Matsuoka et al., 2021; Bista et al., 2017; Urabe et al., 2025; Singer et al., 2023), making it a powerful tool for biomonitoring (Brinkmann et al., 2023; He et al., 2019; Pawlowski et al., 2016) and biodiversity assessment (Bakker et al., 2019; Gu et al., 2023; Lejzerowicz et al., 2014). However, this sensitivity to temporal and small-scale spatial variations may also pose challenges for paleoenvironmental applications. The extent and implications of this variability for sea-level reconstructions remain poorly understood and have not been systematically assessed.
To address this knowledge gap, we investigated the temporal and spatial variability in foraminiferal eDNA assemblages and their effects on transfer-function-based RSL reconstructions in mangrove and mudflat environments in Hong Kong. Over 2 years, we conducted semi-annual monitoring to (1) assess seasonal dynamics and spatial variation in eDNA assemblages across tidal elevations, (2) identify environmental drivers of temporal variation, and (3) determine how seasonality influences the accuracy of eDNA-based RSL reconstructions. Our findings reveal clear seasonality in foraminiferal eDNA assemblages in a subtropical coastal wetland and provide recommendations for improving eDNA sampling strategies for RSL reconstruction.
2.1 Study area
Our study was conducted in the Mai Po Nature Reserve, situated on the eastern fringe of the Pearl River Delta (PRD), South China (Fig. 1b). The PRD is one of the world's largest and most dynamic river deltas, supporting high biodiversity within its extensive networks of rivers, estuaries, and intertidal wetlands (WWF, 2020). Rapid urbanization and industrial development, particularly in neighboring cities Shenzhen and Hong Kong, have influenced regional hydrology, sediment dynamics, and water quality throughout the Deep Bay and the Mai Po wetlands (Sun et al., 2017). The region experiences semidiurnal tides with a great diurnal amplitude of 1.96 m (from mean lower low water [MLLW] to mean higher high water [MHHW]), recorded by the nearest tide gauge station at Tsim Bei Tsui.
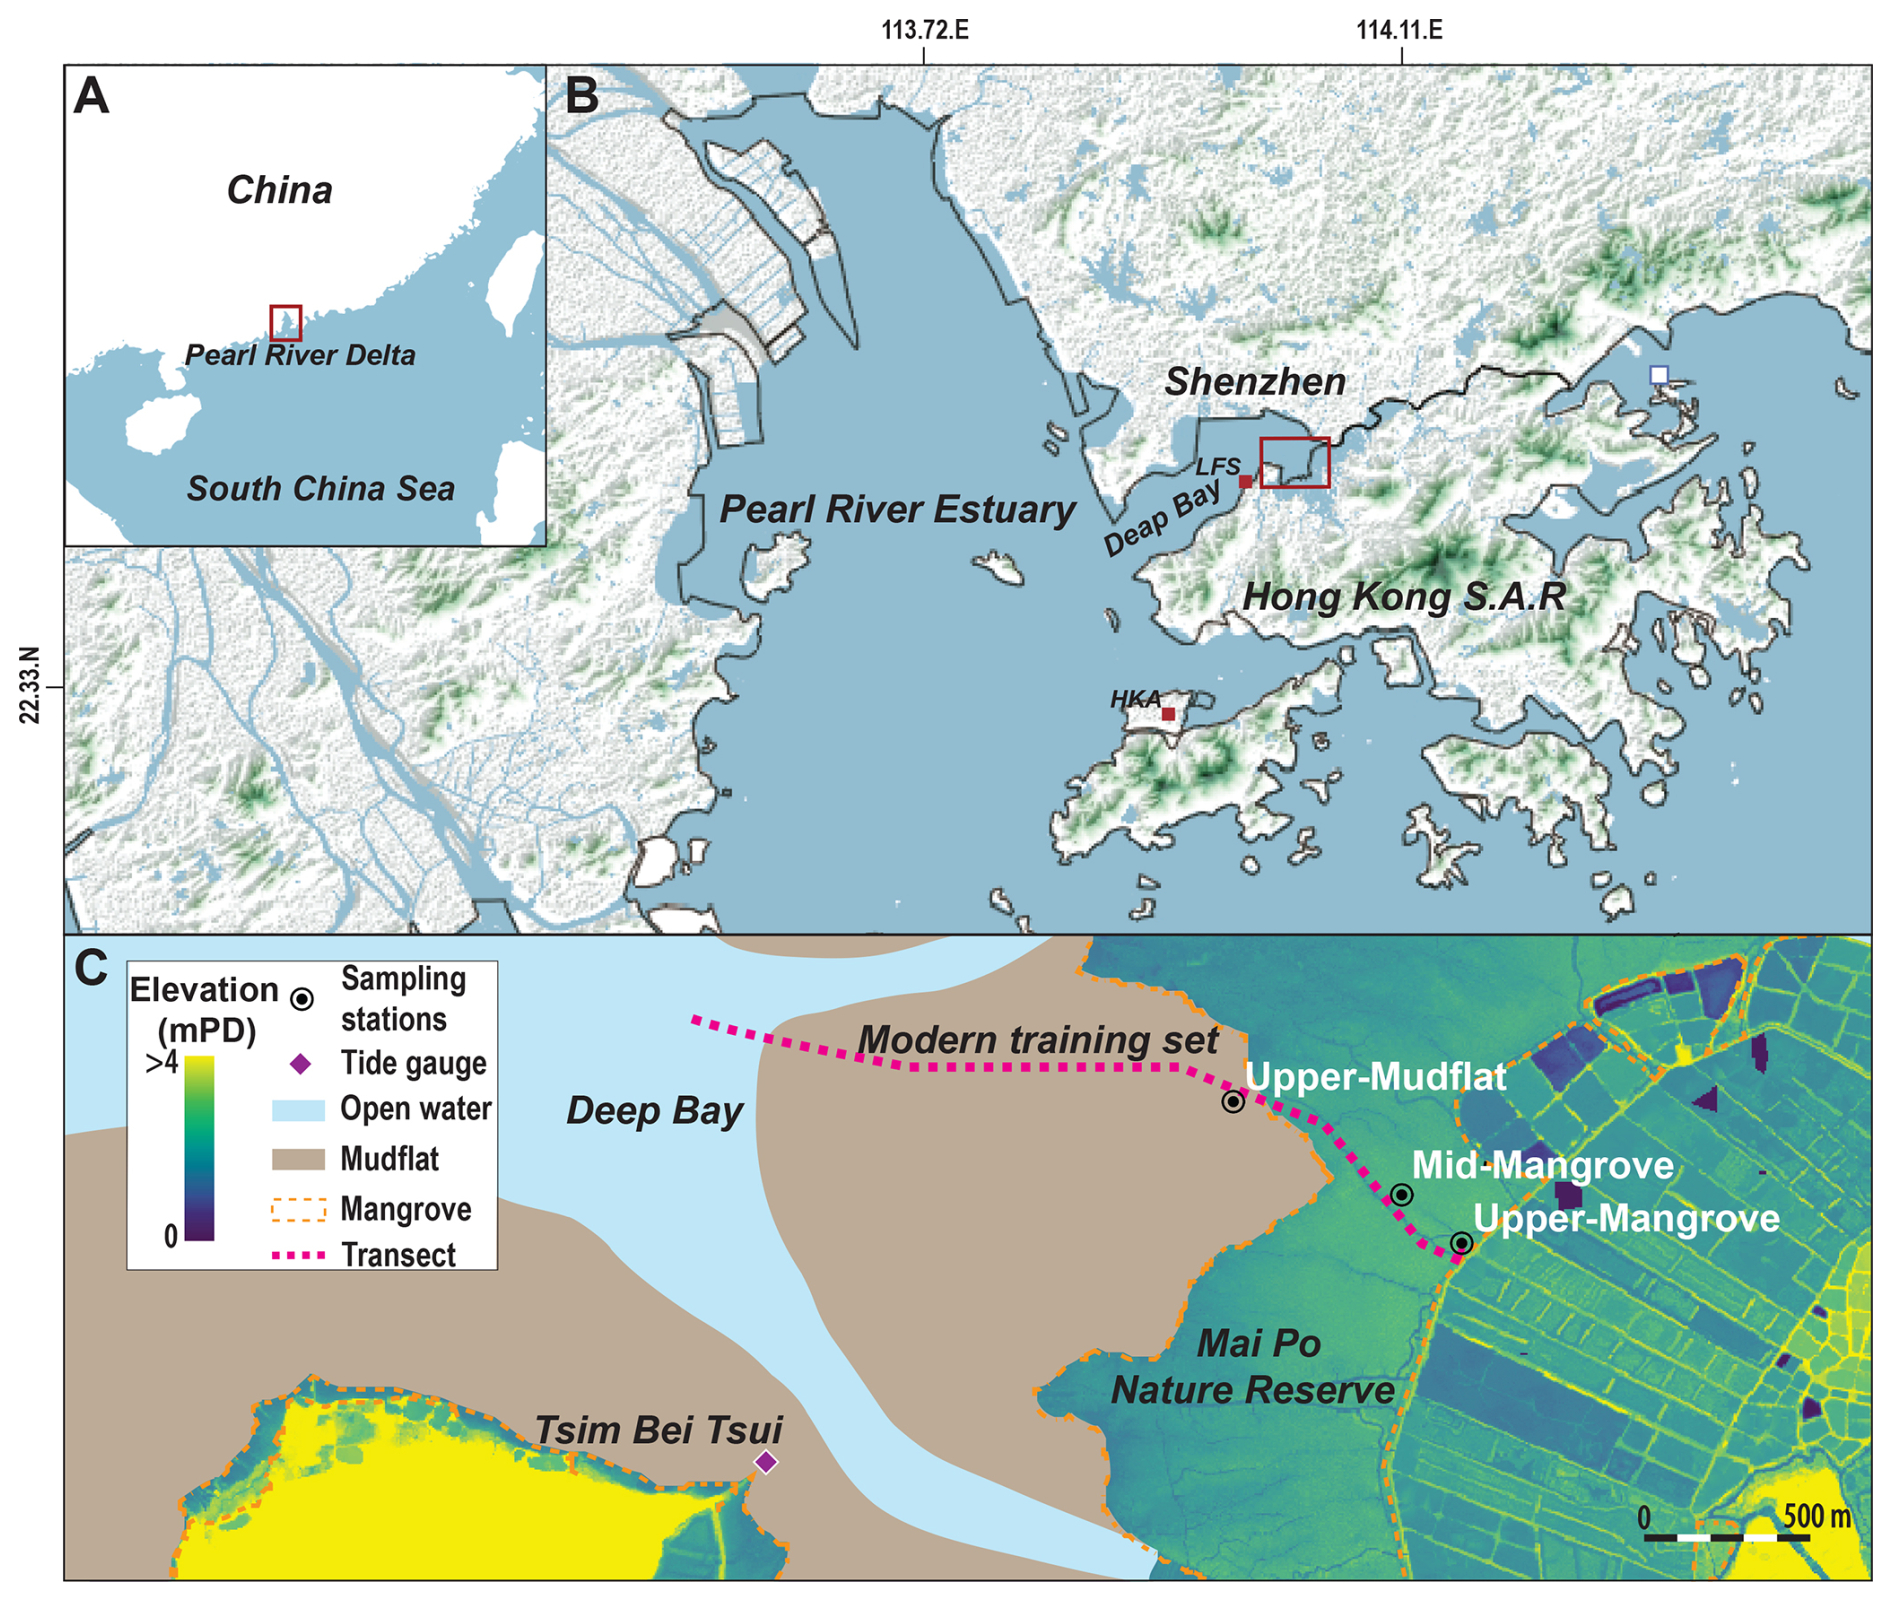
Figure 1Study area and sampling locations. (a) Location of the study area in the Pearl River Delta. (b) The location of Deep Bay within the Pearl River Delta, showing climatic monitoring stations at Lau Fau Shan (LFS) and Hong Kong International Airport (HKA) (red squares). (c) Monitoring stations set up at interior mangrove forest (upper-mangrove station), mangrove forest (mid-mangrove station), and mudflat–mangrove transitional zone (upper-mudflat station) are shown, along with the nearest tide gauge at Tsim Bei Tsui. The position of the surface transect of the established modern training set in Liu et al. (2025) is also shown. Land surface elevation was derived from the lidar digital elevation model supplied by the Hong Kong SAR government for the Mai Po areas.
The climate is humid subtropical, characterized by distinct wet and dry seasons driven by seasonal monsoons (Yu et al., 2023; Ding and Chan, 2005). The southwest monsoon brings the wet season (April–September), which accounts for 77 % of annual precipitation, with maximum monthly totals exceeding 1000 mm. The northeast monsoon corresponds with the dry season (October–March), when the lowest monthly total precipitation drops below 1 mm (Hong Kong Observatory, 2024) (Fig. 2, Table S1 in the Supplement). The precipitation shift between dry and wet seasons typically lags about 1 month behind monsoon onset, with heavy rainfall beginning in late April to early May and ending from late October to early November (Hong Kong Observatory, 2024). The average monthly air temperature during the study period (from November 2022 to May 2024) ranged from 15–30 °C and was lowest in February (15 °C) and highest in July (30 °C). The seasonal contrast between wet and dry conditions affects porewater pH, salinity, and other environmental factors (Li et al., 2011; Wang et al., 2013; Chen et al., 2022), likely influencing foraminiferal community composition and eDNA detection.
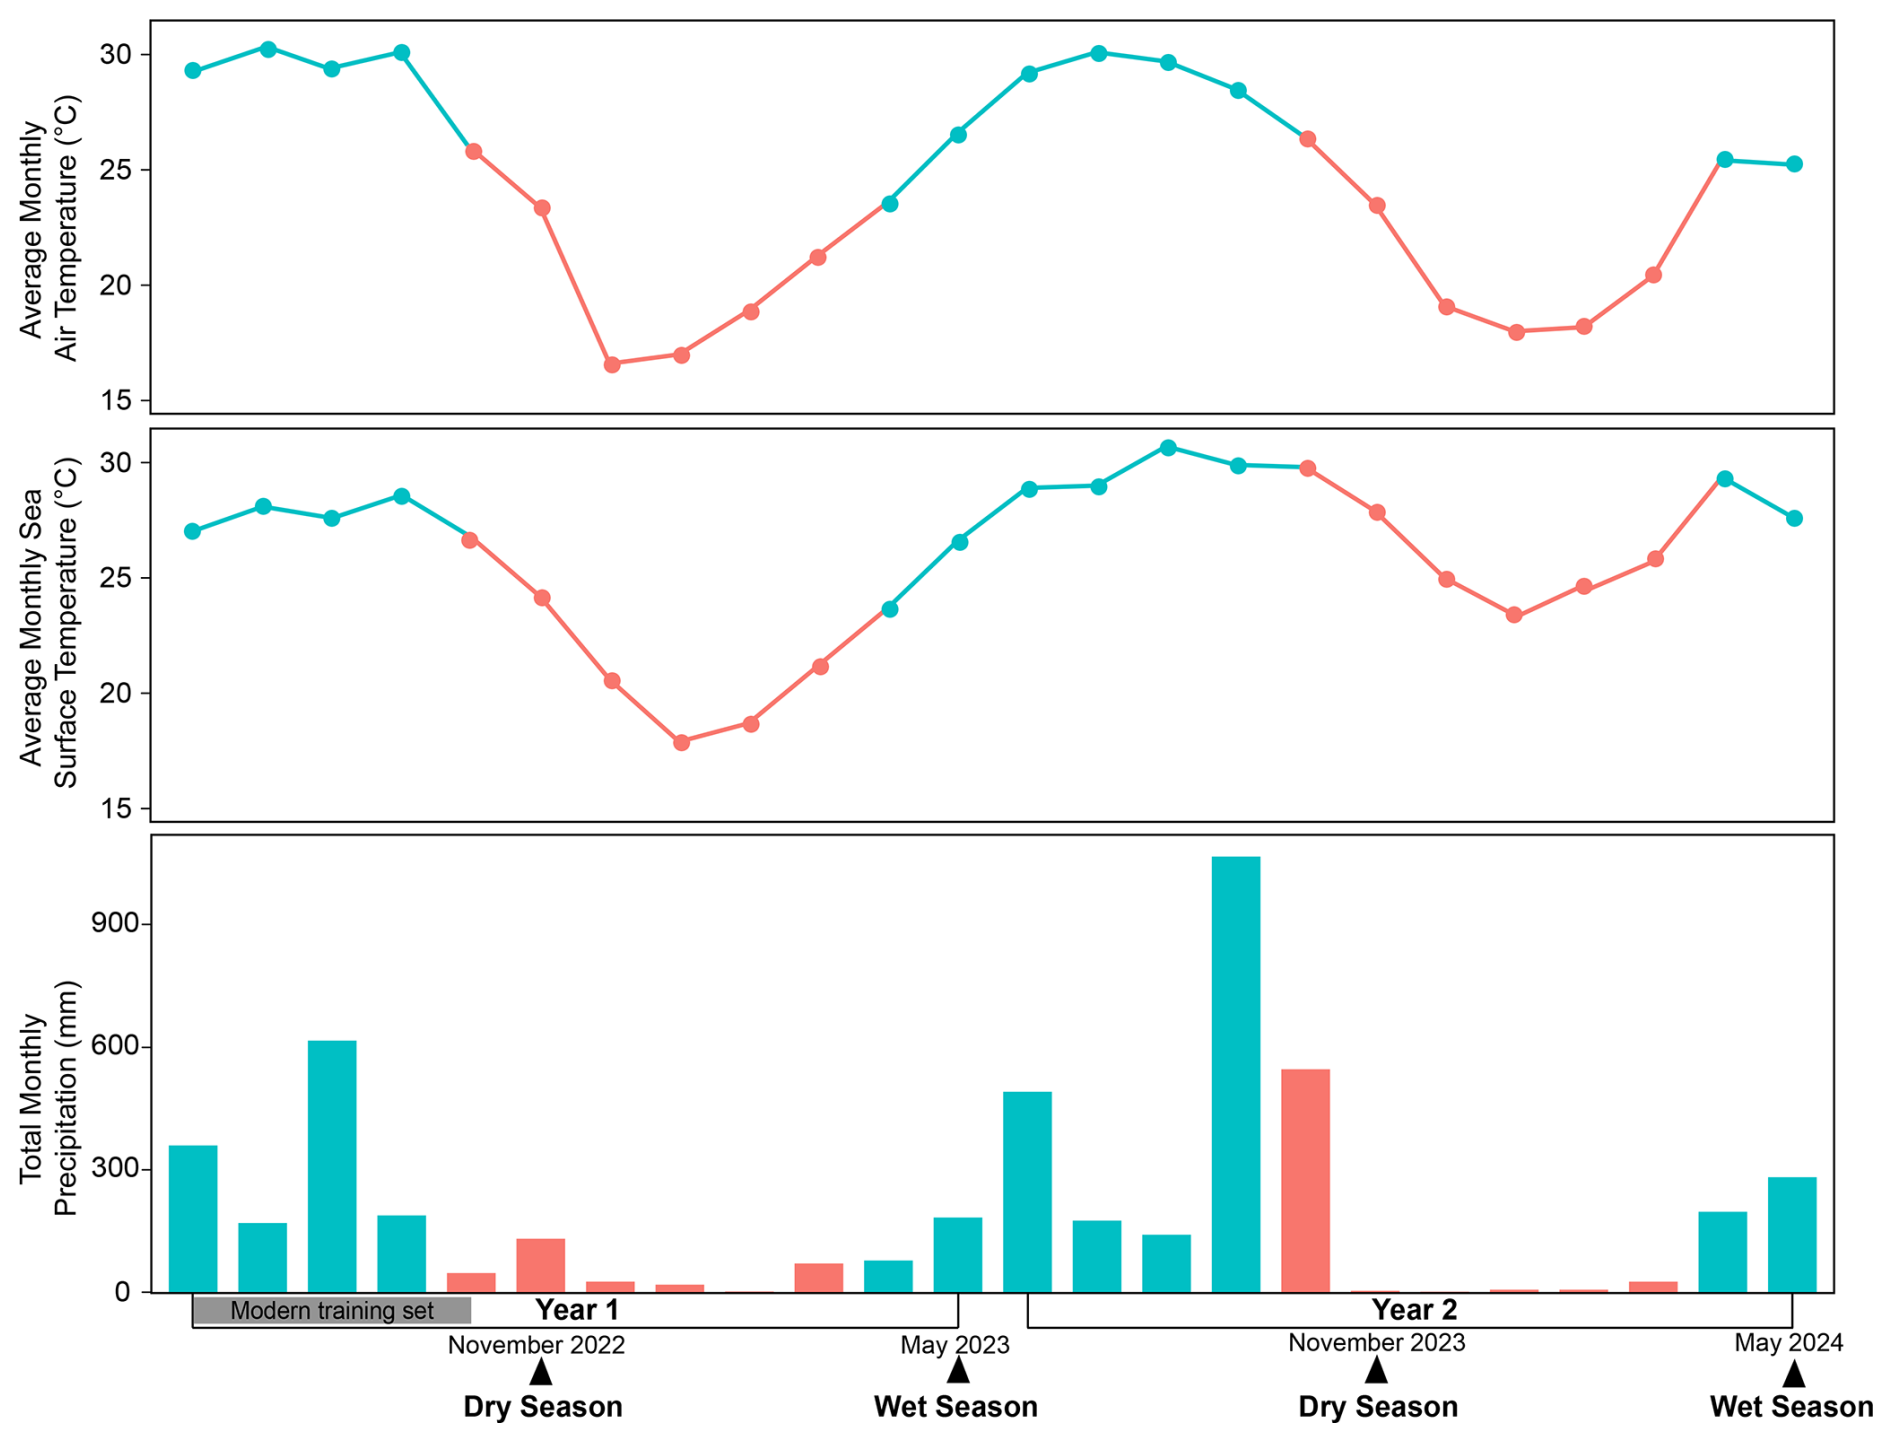
Figure 2Climatic conditions at the study area during the monitoring period (November 2022–May 2024), with the sampling period for modern training set samples from Liu et al. (2025) also indicated. Time series of monthly averaged air temperature (top panel), sea surface temperature (middle panel), and total precipitation (bottom panel) show characteristic dry (red) and wet (blue) seasonal climate patterns of the region. Monthly averaged air temperature and total precipitation data were obtained from the monitoring station at Lau Fau Shan (the nearest station to our study area), while sea surface temperature data were sourced from the monitoring station at Hong Kong International Airport, both maintained by the Hong Kong Observatory (Hong Kong Observatory, 2024).
Within Mai Po, a shore-normal transect was established spanning the mudflat–mangrove transitional zone to the interior mangrove forest, coinciding with a previous foraminiferal eDNA modern training set (Fig. 1c) (Liu et al., 2025). This transect captures the ecological gradient from barren mudflat to mature mangrove forest, enabling assessment of how environmental factors shape foraminiferal eDNA assemblages. Three monitoring stations were positioned along this transect in different environmental zones – (1) mudflat–mangrove transitional zone (upper-mudflat station), (2) mangrove forest (mid-mangrove station), and (3) interior mangrove forest (upper-mangrove station) (Fig. 1c) – to capture the temporal and small-scale variation in eDNA assemblages along the seaward–landward gradient. The flora in the mudflat–mangrove transitional zone is dominated by Sporobolus alterniflorus, with occasional non-native Sonneratia apetala (Yu et al., 2025), while the mangrove stands are primarily occupied by Kandelia candel, Aegiceras corniculatum, and Avicennia marina (Li et al., 2019; Lee, 2000).
2.2 Sampling strategy
Given the study area's distinct dry and wet seasonal pattern, we conducted semi-annual sampling during both seasons. Samples were collected at each monitoring station in late November (dry season) and late May (wet season), after seasonal climatic factors had stabilized for at least 2 weeks. For example, the dry-season sampling in November 2022 occurred during a period of consistently low precipitation (daily total precipitation 0–9.6 mm), while wet-season sampling in May 2023 followed the onset of increased rainfall that characterized the transition from the dry winter months (Hong Kong Observatory, 2024). This timing ensured that the foraminiferal eDNA assemblages captured reflected true seasonal variation related to the respective collection periods. Within a 1 × 1 m plot at each monitoring station, three replicate sediment samples (approximately 20 cm3 each) for eDNA analysis were collected randomly from the top 1 cm of the surface (Liu et al., 2025). This replication was designed to assess microscale spatial variability (patchiness) in foraminiferal eDNA assemblage composition within each monitoring station (Lejzerowicz et al., 2014; Walker et al., 2020). The position of each collected sample was recorded within 10 × 10 cm cells using a quadrat (Smith et al., 2021) to avoid repeatedly sampling from the same location across seasons. The sampling procedure followed Liu et al. (2025). Briefly, all sampling equipment was sanitized with 10 % bleach between each collection to prevent cross-contamination. All eDNA samples were kept on ice during field collection and promptly transferred to a −20 °C freezer upon return to the laboratory on the sampling day.
To examine the potential environmental drivers of temporal variation in foraminiferal eDNA, an additional 20 cm3 of sediment was sampled simultaneously at each station to measure environmental variables, including porewater salinity and pH, and stable carbon isotope geochemistry (total organic carbon (TOC), total nitrogen (TN) and δ13C). These samples were also kept on ice once collected and stored in a 4 °C refrigerator in the lab.
The elevation of each monitoring station was measured following the procedure introduced in Liu et al. (2025), relative to the Hong Kong Principal Datum (PD). Specifically, we took three elevation measurements at each monitoring station due to the slightly uneven surface topography. Because of the flat topography of the mangrove forest in the study area, the elevations of the upper- and mid-mangrove stations fell within similar ranges (2.17–2.22 mPD). We converted the elevation to standardized water level index (SWLI) units (Kemp and Telford, 2015), where a value of 100 corresponds to mean tide level (MTL) and 200 to mean higher high water (MHHW), based on tidal data obtained from the Tsim Bei Tsui tide gauge (Fig. 1c).
2.3 eDNA analysis
2.3.1 eDNA extraction, amplification, and sequencing
We extracted eDNA from sediment samples using the 0.5 g PowerSoil® DNA isolation kit (QIAGEN) according to manufacturer instructions. A two-step polymerase chain reaction (PCR) amplification protocol was conducted to prepare sequencing libraries. To minimize PCR bias and to cover total genetic and taxonomic diversity (Nichols et al., 2018; Singer et al., 2023), DNA extraction was performed in two replicates for each sample, followed by duplicate PCR amplifications of each extraction replicate. The PCR amplification procedure follows Liu et al. (2025). Briefly, the first PCR was conducted with primers s14F1–s15 to amplify the 135–190 bp fragment within the hypervariable region 37f of the foraminiferal SSU rDNA gene (Lejzerowicz et al., 2014). Both primers included overhang adapter sequences compatible with Illumina indices following the Illumina MiSeq system sequencing protocol. Replicate PCR products from each sample were pooled and purified using AMPpure XP beads (Beckman Coulter, Singapore) following the Illumina MiSeq system sequencing protocol. Subsequently, an indexing PCR was performed using the Nextera XT Index Kit (Illumina) to append dual indices to the purified amplicons. Indexed PCR products were purified again using AMPpure XP beads. Purified samples were pooled to a final concentration of 20 µM in 10 mM Tris (pH 8.5) and sent to Novogene Co., Ltd for sequencing on the NovaSeq platform using paired-end 150 bp reads (PE 150).
2.3.2 Bioinformatics
Bioinformatics processing followed the pipeline introduced in Liu et al. (2025). Briefly, raw sequence data were demultiplexed and primers removed by Cutadapt v2.8 (Martin, 2011); the produced pair-end reads were further merged and trimmed by PEAR v0.9.11 with a quality threshold of 26 (Zhang et al., 2014). Concatenated sequences were denoised and chimeras removed using VSEARCH (Rognes et al., 2016). Sequences were clustered into operational taxonomic units (OTUs) at 97 % similarity using VSEARCH. Quality control was applied to discard OTUs that were (1) either shorter than 90 bp or longer than 230 bp, (3) had fewer than 10 reads, or (3) appeared in negative controls with read counts equal to or exceeding those in any sample. Taxonomy was assigned using BLASTn v2.12.0 (Altschul et al., 1990) with an e value of 0.001 at species, family, and phylum levels based on identity thresholds of 98 %, 90 %, and 80 %, respectively, referring to the GenBank nucleotide database and an in-house foraminiferal DNA database (Table S2). OTUs with identities between 80 % and 90 % (assigned to phylum level) and OTUs with unknown taxonomy were classified as “undetermined OTUs” and treated individually as taxa in subsequent analyses. OTUs with identity thresholds below 80 % were not considered foraminifera and were removed.
2.4 Environmental variables
To assess the influence of environmental variables on foraminiferal eDNA assemblage composition over time, porewater salinity, pH, sediment total organic carbon (TOC), total nitrogen (TN), and δ13C were measured following the procedures introduced in Yu et al. (2025) and Liu et al. (2025). Briefly, salinity and pH were measured using a Thermo Scientific™ A3255 pH/conductivity multimeter from porewater obtained by centrifuging sediment samples (Sawai et al., 2016). Sediment samples for δ13C, TOC, and analyses were pretreated with 5 % hydrochloric acid (HCl) prior to analysis on a EuroVector EA3028 Nu Horizon isotope-ratio mass spectrometer (IRMS) and an EA Isolink elemental analyzer. Additionally, climate data (air temperature, sea surface temperature, and precipitation) during our study period (November 2022–May 2024) were obtained from the monitoring station at Lau Fau Shan (nearest to our study area), with additional sea surface temperature measurements obtained from the Hong Kong International Airport station maintained by the Hong Kong Observatory (Hong Kong Observatory, 2024) to evaluate seasonal climatic influences on environmental variables and foraminiferal eDNA assemblages (Table S1).
2.5 Statistical analysis
To assess seasonal variation in the abundance of dominant foraminiferal taxa at each sampling station, we performed a one-way analysis of variance (ANOVA) with 1000 permutations (p-value threshold = 0.05) (Troth et al., 2021; Chung et al., 2024) (Table S3). Identical seasons from years 1 and 2 were merged as a single factor in this analysis. Dominant taxa were defined as those with > 5 % relative abundance in at least one sample. Prior to ANOVA, we assessed homogeneity of variances for each taxon's abundance at each station and applied log transformation as needed to meet ANOVA assumptions. The relative abundances of dominant taxa were plotted, and a heatmap was generated using merged replicate samples for each station and season to visualize patterns in taxonomic composition and diversity across environments and seasons. The heatmap was produced using the ggheatmap function from the heatmaply package (Galili et al., 2018) in R (v4.4.2).
To examine overall patterns of temporal (seasonal) and spatial variation in foraminiferal eDNA assemblages, we conducted non-metric multidimensional scaling (NMDS) based on Bray–Curtis dissimilarity of taxa relative abundance data, using the vegan package (v2.6-4) in R (Oksanen et al., 2007). The NMDS ordination was constructed using dominant taxa (> 5 % relative abundance in at least one sample), and the first two NMDS dimensions were used to visualize compositional dissimilarities among stations and seasons. To test the significance of observed patterns, we used permutational multivariate analysis of variance (PERMANOVA) with 999 permutations (Anderson, 2014), also based on Bray–Curtis distances (Table S4). PERMANOVA was used to evaluate whether eDNA assemblages differed significantly between seasons (with identical seasons from years 1 and 2 merged as a single factor) and among stations (p-value threshold = 0.05).
To evaluate microscale spatial variability (patchiness) within each monitoring station, we calculated pairwise Bray–Curtis dissimilarity among the three replicate samples collected within each 1 × 1 m plot at every station and sampling event. The magnitude of within-station dissimilarity (differences between replicate samples collected simultaneously from the same monitoring station representing microscale spatial variability) was then compared to among-station dissimilarity (differences among samples collected during the same season from different monitoring stations) using a permutation test (10 000 permutations, p-value threshold = 0.05) (Welch, 1990). This analysis tested whether microscale patchiness within stations was significant relative to broader environmental differences. Additionally, ANOVA (1000 permutations, p-value threshold = 0.05) was used to assess whether the dispersion (i.e., within-station variability) of eDNA assemblages differed significantly among the three monitoring stations during the same sampling period.
To determine the influence of environmental variables on the composition of foraminiferal eDNA assemblages, we performed redundancy analysis (RDA) and partial RDA (pRDA) using Hellinger-transformed relative abundance data (Table S5), implemented in the vegan package (v2.6-4) (Legendre and Gallagher, 2001) in R. Only dominant taxa (> 5 % relative abundance in at least one sample) were included in the RDA. The environmental variables considered included salinity, pH, TOC, carbon–nitrogen ratio (), and δ13C. The significance (p<0.05) of environmental variables and the first two ordination axes was determined using ANOVA with 1000 permutations. To examine whether the control of environmental variables differs between seasons, separate RDA analyses were also performed for the wet- and dry-season samples. pRDA was conducted with tidal elevation (SWLI) of each monitoring station included to further assess the relative contributions of tidal elevation and the tested environmental variables to variance in the foraminiferal eDNA assemblage. Pairwise associations between foraminiferal taxa and environmental variables (salinity, pH, TOC, TN, ratio) were further evaluated using Spearman's rank correlation coefficient implemented in R (Spearman, 2010). Additionally, linear mixed-effects models (LMMs) were run to examine the significance of variation (p-value threshold = 0.05) in the environmental variables across seasons at each monitoring station (Luke, 2017). To further quantify the proportion of variance in assemblage composition explained by physicochemical (tidal elevation and environmental variables) and climatic (temperature, sea surface temperature, and precipitation) variables, we conducted variance partitioning using the varpart function in vegan (Peres-Neto et al., 2006).
To investigate how seasonal variations in eDNA assemblages at each monitoring station potentially influenced sea-level reconstruction, we applied a Bayesian transfer function (BTF) to estimate the elevation for each season at each station (Cahill et al., 2016; Liu et al., 2025; Yu et al., 2025). The BTF was constructed using a modern training set from the same study site (Liu et al., 2025), comprising 59 surface samples and spanning the elevation range from the lowest to the highest astronomical tide. The BTF was constructed following the same procedures described in Liu et al. (2025). Briefly, eDNA sequence counts were rarefied to the lowest sequencing depth in the dataset – after excluding one modern sample with low read numbers – to account for differences in sequencing depth among samples. To minimize bias from low-abundance taxa, only those exceeding 5 % abundance in at least one sample were included (Patterson and Fishbein, 1989; Fatela and Taborda, 2002; Liu et al., 2025), consistent with the criteria for taxa applied in RDA. Although OTUs assigned to the planktonic family Globigerinitidae exceeded this threshold, they were excluded from the BTF to reduce uncertainty, as they are not considered in situ taxa. The distribution of estimated elevations (SWLI) for each station and season was compared to observed elevations, and uncertainties were reported as the maximum value of the 2σ interval across replicates.
3.1 Seasonal variation in dominant taxa
Several dominant foraminiferal taxa (> 5 % relative abundance in at least one sample) exhibited clear and, in some cases, statistically significant seasonal patterns in abundance across the three sampling stations (Figs. 3 and 4, Table S2). For example, Saccamminidae were significantly more abundant during the dry season at the upper-mangrove and upper-mudflat stations (ANOVA, p<0.05), while Ammoniidae showed significantly higher abundance in the wet season at the mid-mangrove station. Detailed relative abundances for all taxa at each station are provided in Table S6.
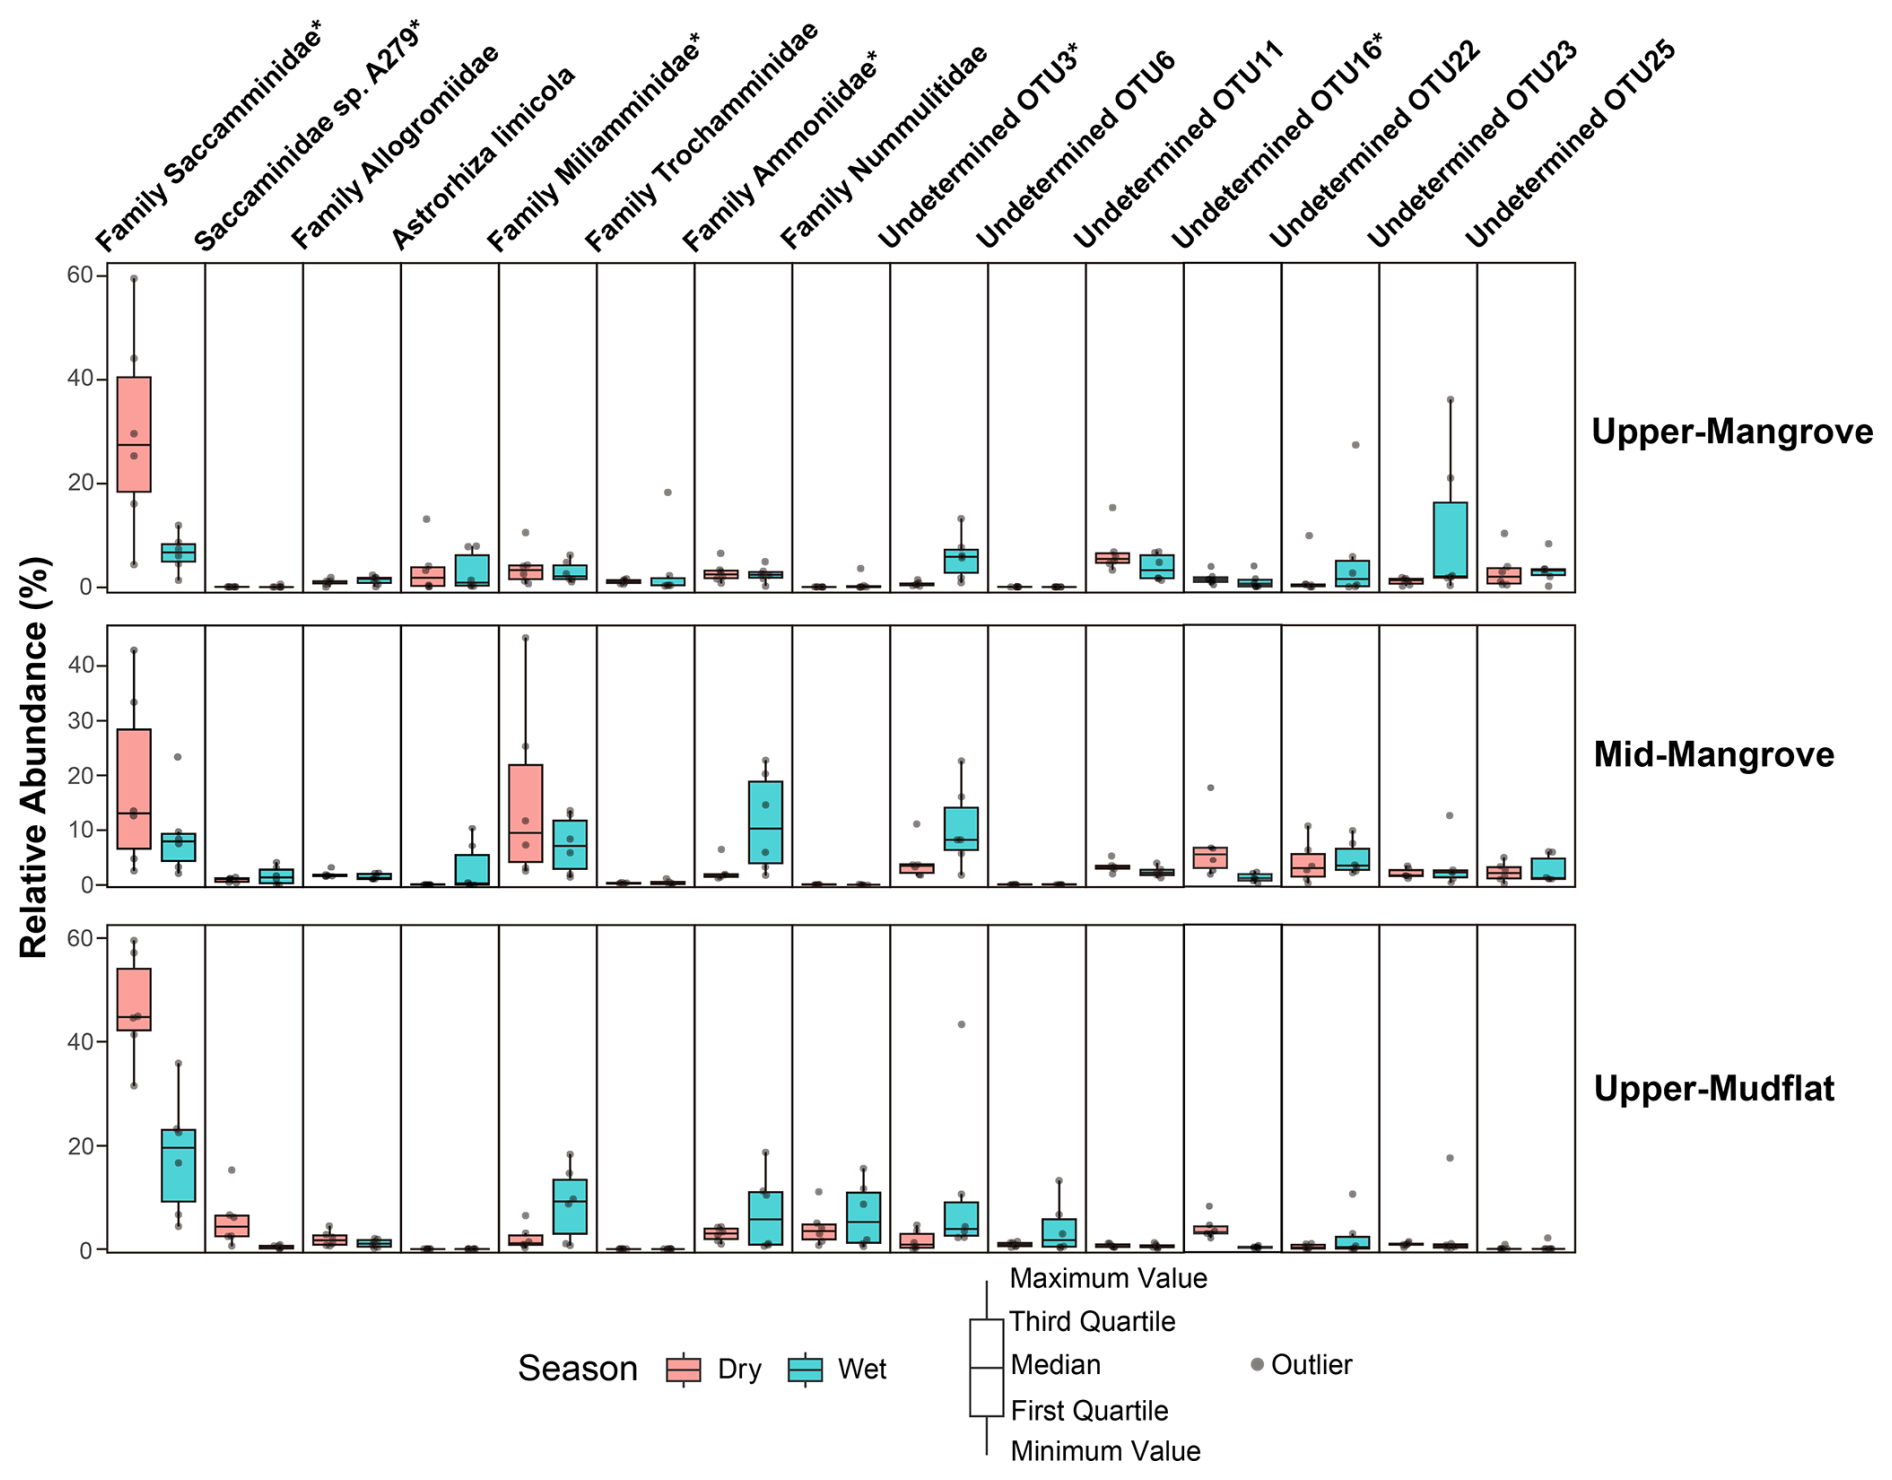
Figure 3Relative abundance (%) of dominant foraminiferal taxa (> 5 % relative abundance in at least one sample) at three sampling stations during the wet (blue) and dry (red) seasons. Taxa that exhibited a statistically significant seasonal pattern at least at one of the monitoring stations determined by one-way ANOVA (Table S3) are marked with an asterisk.
3.2 Community structure across stations and seasons
The seasonal patterns in dominant taxa corresponded to distinct shifts in overall community composition across monitoring stations. During the dry season, the upper-mangrove, mid-mangrove, and upper-mudflat stations were all dominated by Saccamminidae, while Miliamminidae were also abundant in the mid-mangrove (Fig. 4). In the wet season, the upper mangrove was dominated by OTU23 and OTU59, while the mid-mangrove was characterized by high abundances of Ammoniidae and OTU3. During the wet season, the upper mudflat exhibited decreased abundance of Saccamminidae but increased abundances of Miliamminidae, Ammoniidae, and OTU3 compared to the dry season (Fig. 4).
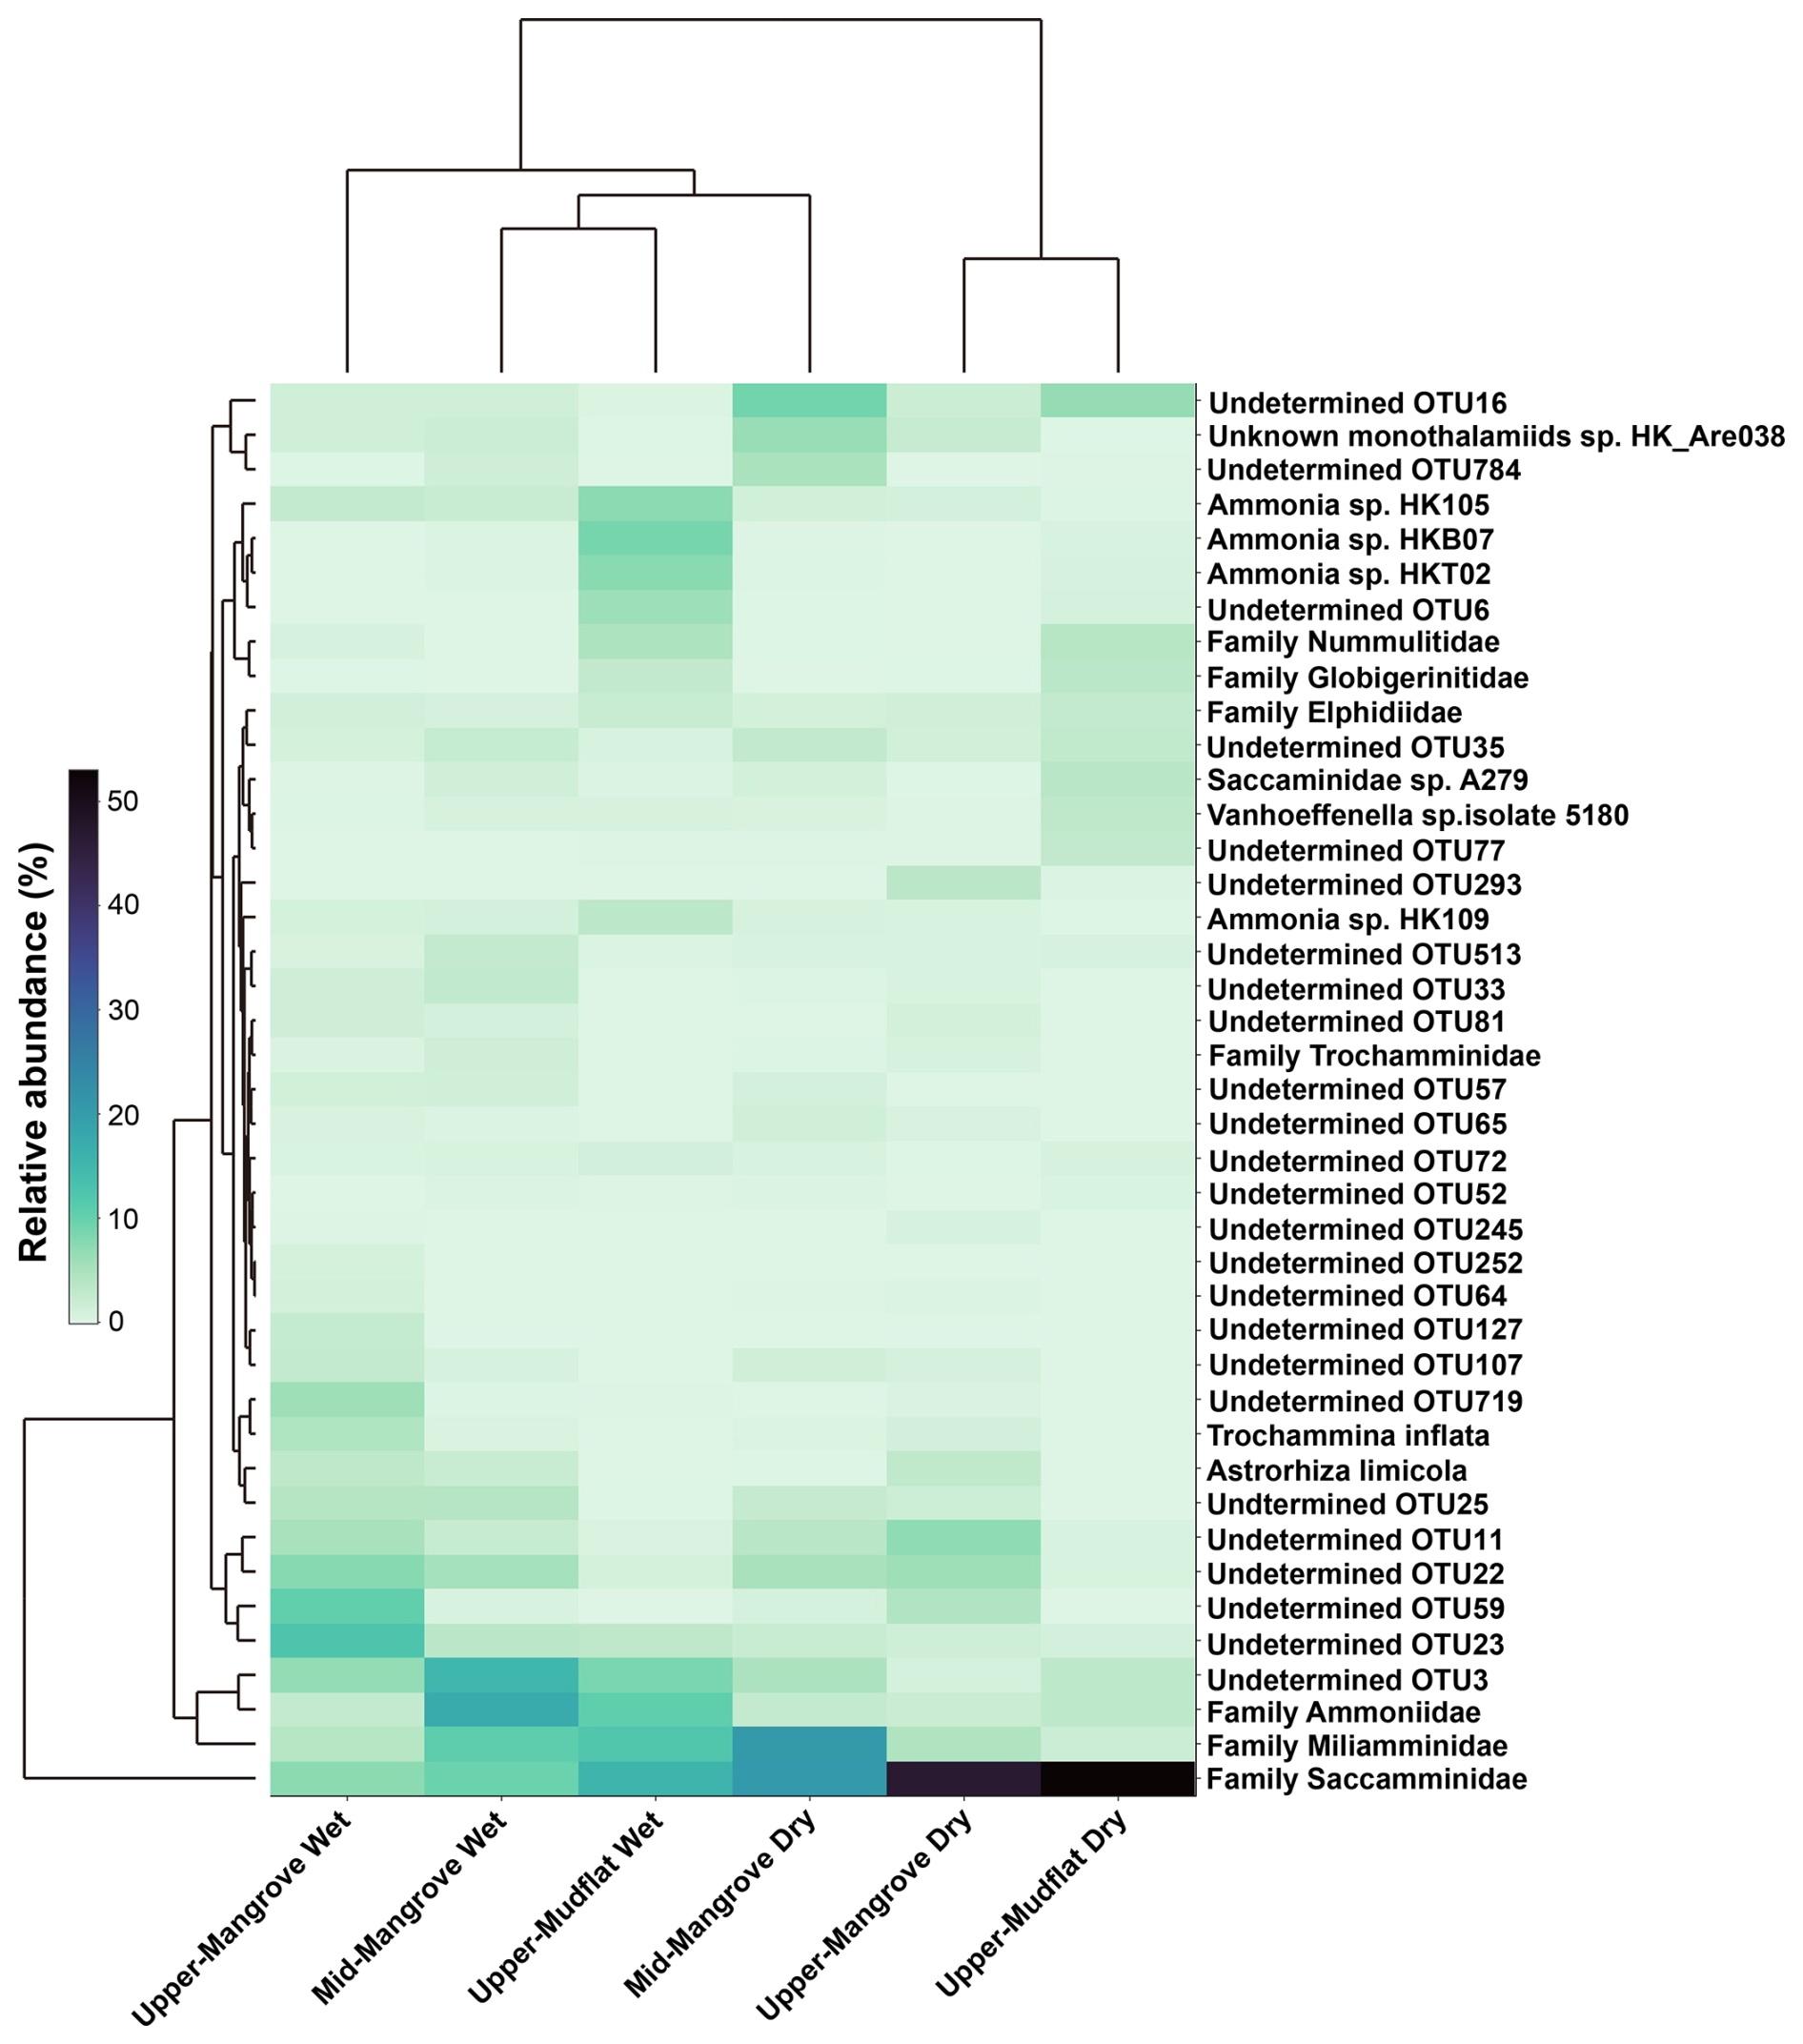
Figure 4Heatmap of foraminiferal eDNA assemblages showing the relative abundance (%) of dominant foraminiferal taxa at each sampling station across wet and dry seasons. Replicate samples from each station were pooled by season to represent seasonal shifts in overall community structure.
Both environment and season influenced community composition (Fig. 5a). Samples from the upper mangrove and mid-mangrove clustered together, indicating that their foraminiferal community compositions were more similar to each other than to the upper-mudflat samples, although there was still a significant difference between these two stations (PERMANOVA; F= 2.21, R2= 0.09, p= 0.014). In contrast, samples from the upper mudflat formed a more significantly separated cluster from the upper mangrove (PERMANOVA; F= 5.18, R2= 0.19, p= 0.001) and mid-mangrove (PERMANOVA; F= 5.65, R2= 0.20, p= 0.001), reflecting a distinct community composition (Fig. 5a). In the upper mudflat, dry- and wet-season samples were clearly separated in ordination space, also showing a significant difference between seasons (PERMANOVA; F= 4.42, R2= 0.31, p= 0.005; Table S4). Within the upper mangrove, dry- and wet-season samples largely overlapped in ordination space, yet PERMANOVA indicated a significant seasonal difference in community composition (F= 2.34, R2= 0.19, p= 0.01). In contrast, no significant seasonal difference was detected in the mid-mangrove samples (PERMANOVA; F= 1.93, R2= 0.16, p = 0.079). In addition, most taxa were centrally located in the NMDS ordination, suggesting they were common to both the upper-mangrove and mid-mangrove environments. However, monothalamids such as Saccamminidae, Vanhoeffenella sp., and calcareous-walled Nummulitidae were more closely associated with the upper-mudflat environment in the NMDS analysis (Fig. 5a).
3.3 Microscale (within-station) spatial variability
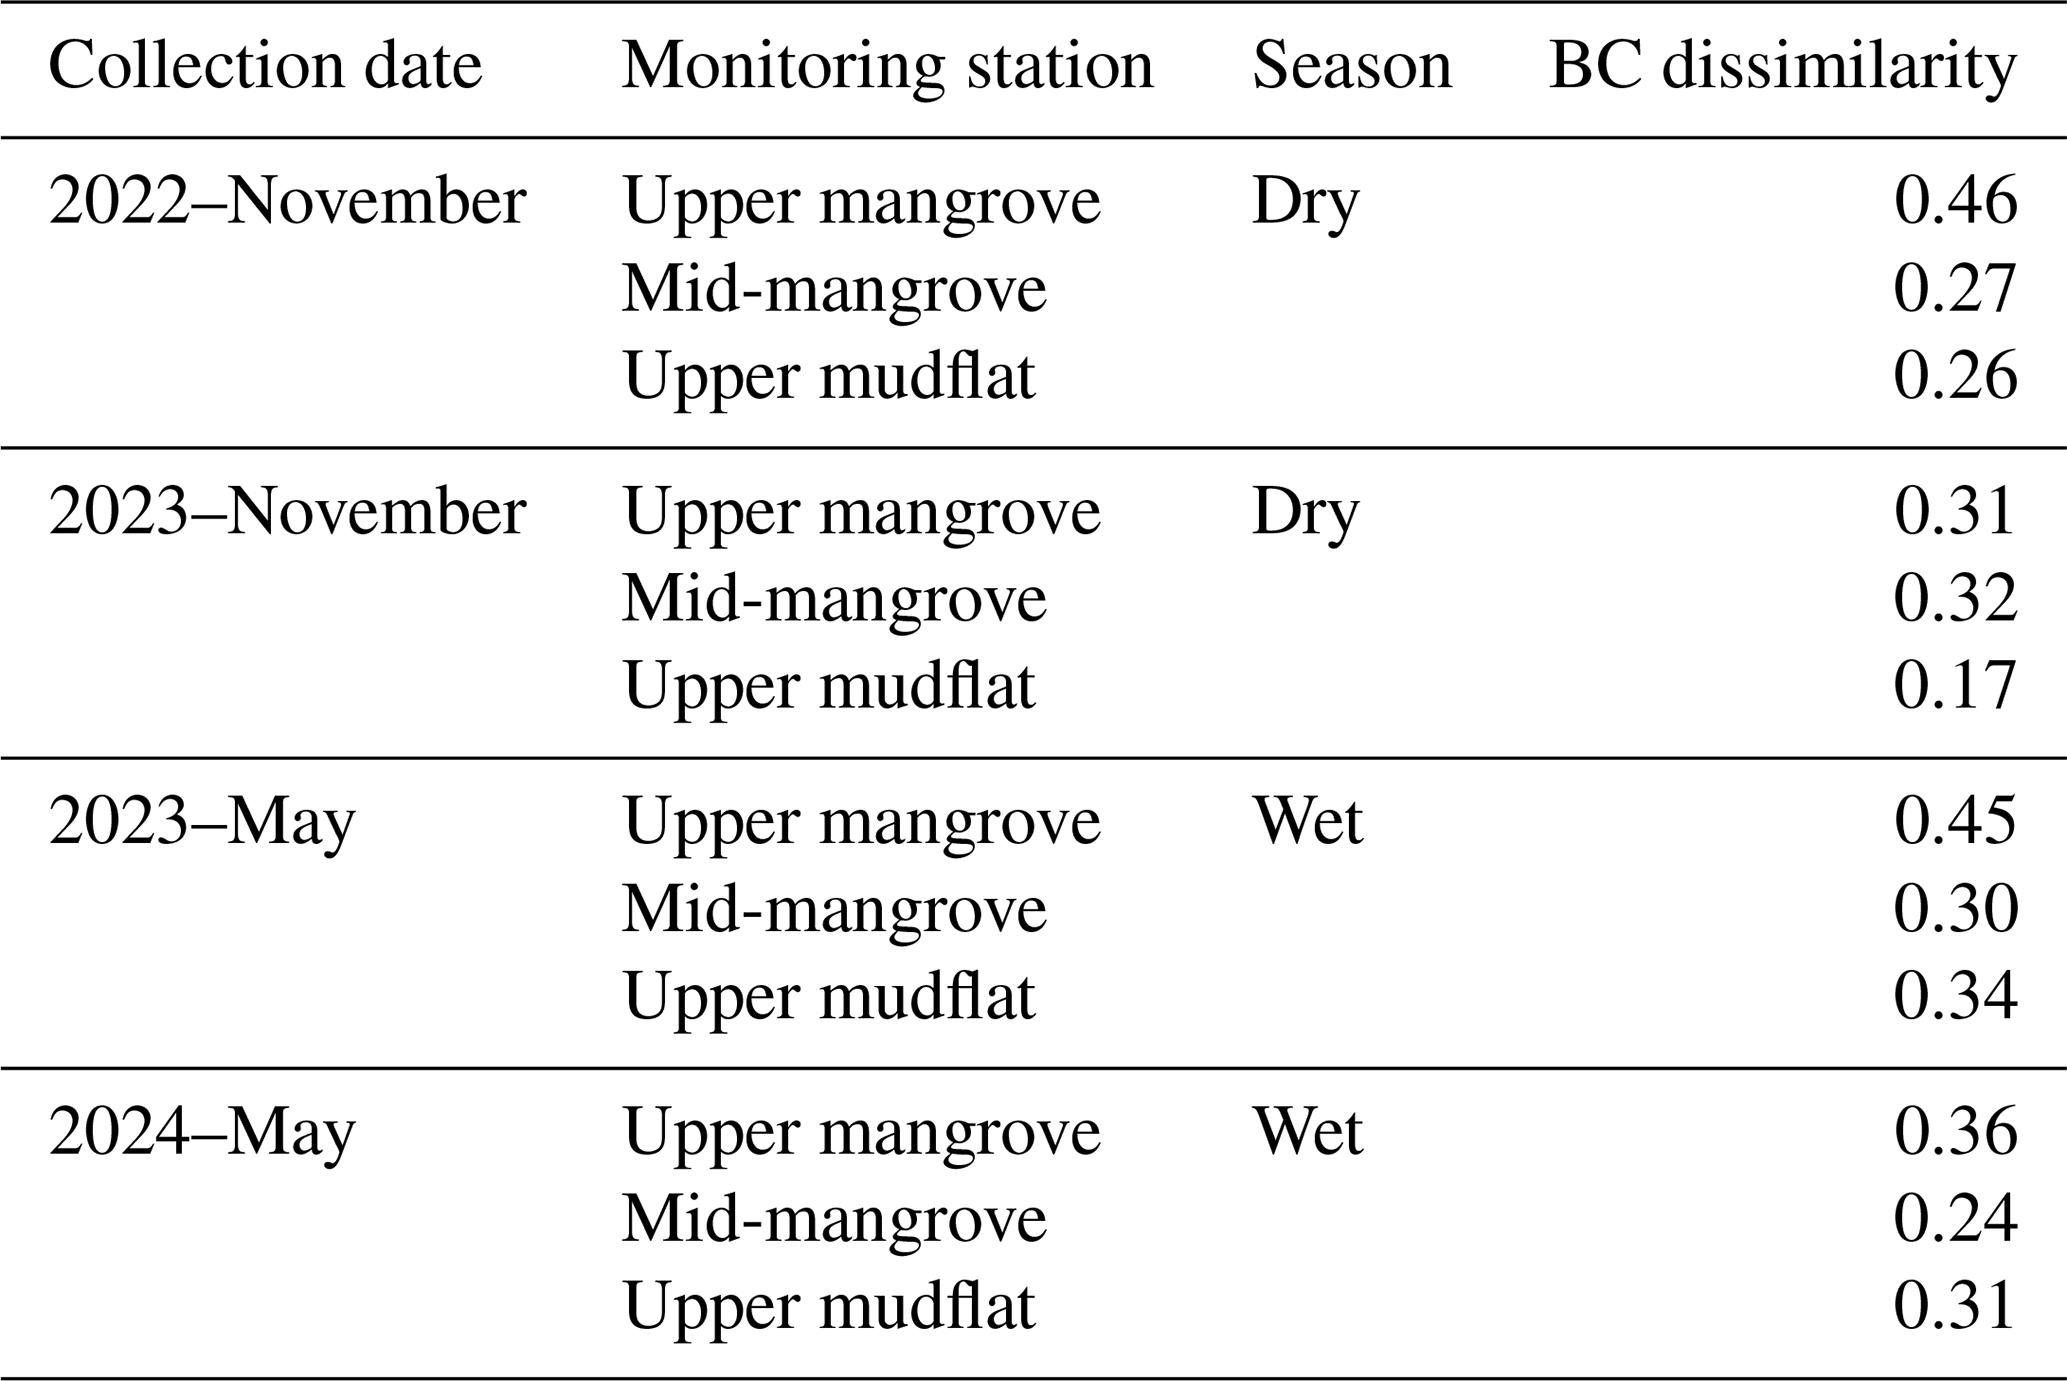
Samples showed significantly higher among-station heterogeneity than within-station (microscale) variability (Fig. 5b). Although the upper-mangrove station sampled in November 2022 exhibited the highest within-station dissimilarity (Table 1), within-station variability was significantly lower than among-station differences (permutation test, p<0.01). Furthermore, overall variation in within-station dispersion across all monitoring stations was not statistically significant (ANOVA, p>0.05), indicating limited patchiness at the scale sampled.
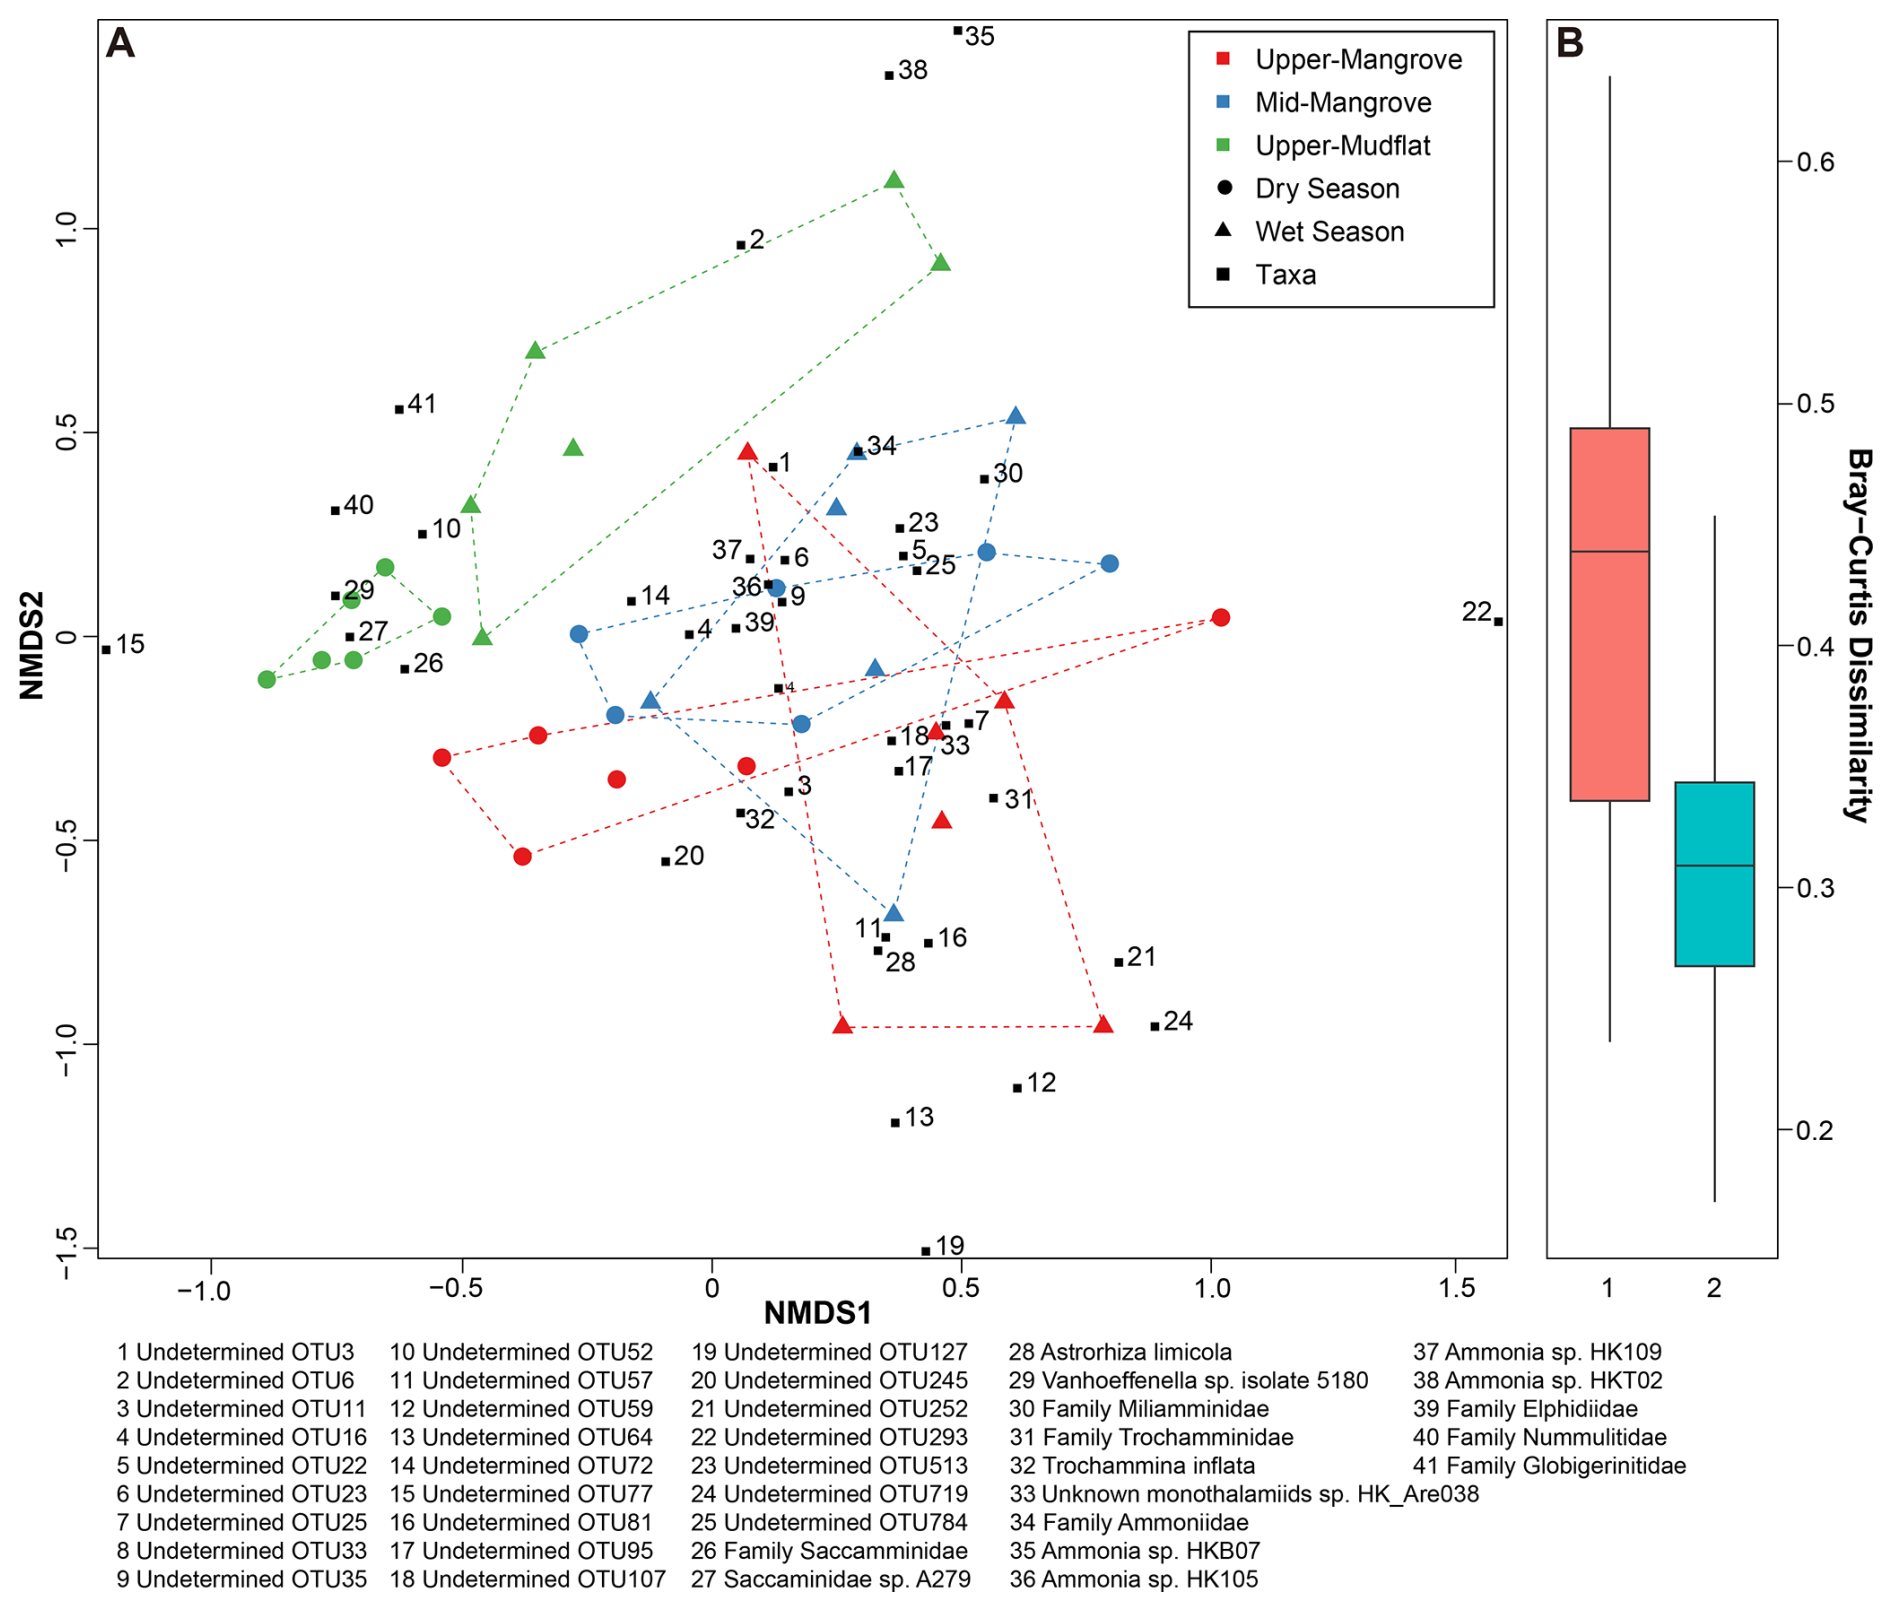
Figure 5Dissimilarity of foraminiferal eDNA assemblages in each sample. (a) Non-metric multi-dimensional scaling (NMDS) ordination of foraminiferal eDNA assemblages. NMDS ordination based on Bray–Curtis dissimilarities of foraminiferal eDNA assemblages at each sampling station during dry and wet seasons (stress value = 0.17). The NMDS was constructed using dominant taxa with > 5 % relative abundance in at least one sample. Samples from different environments and seasons are indicated by distinct colors and shapes. (b) Box plot comparing average Bray–Curtis dissimilarity values among stations (1: among-station variation) and within stations (2: within-station variation).
Table 1The average within-station Bray–Curtis (BC) dissimilarity of each monitoring station per collection.
3.4 Influence of environmental variables
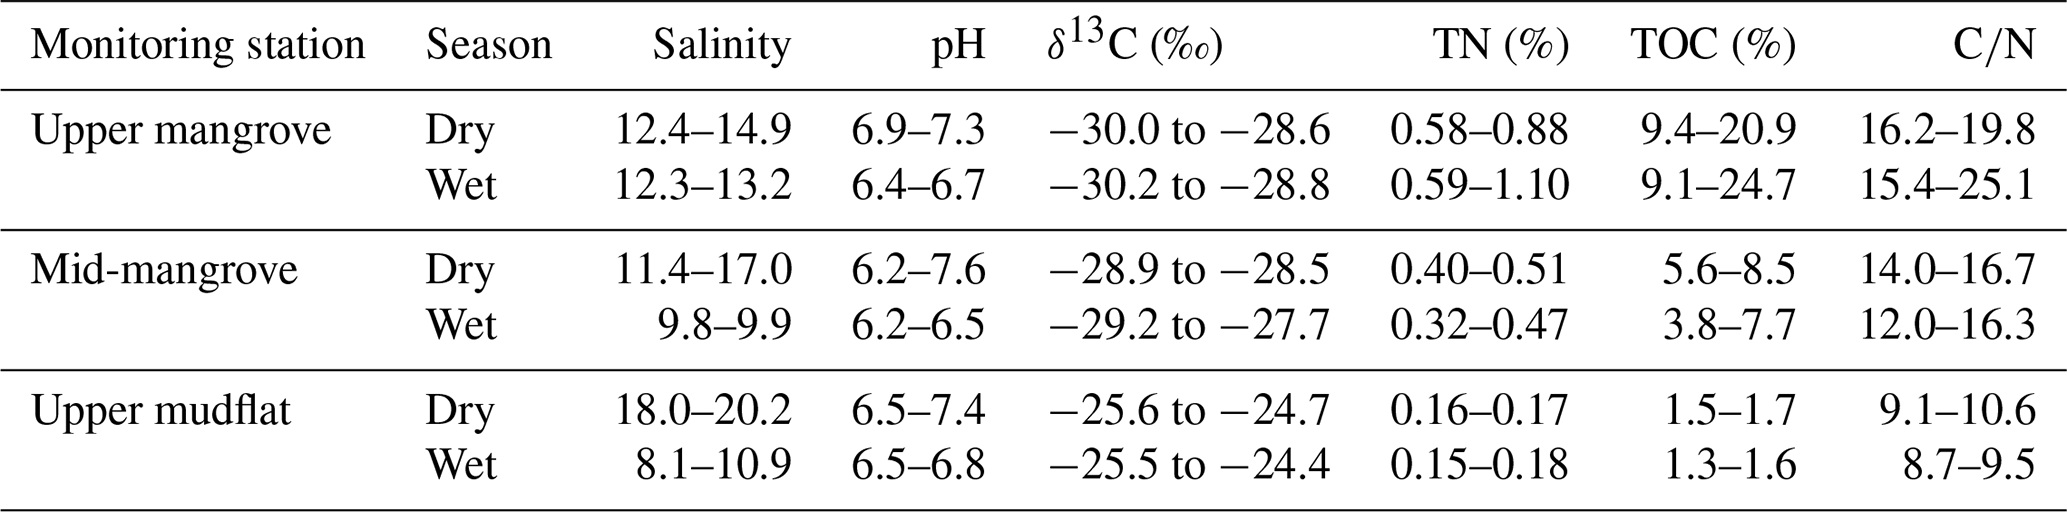
Both static (elevation) and seasonally variable environmental factors (salinity, pH, TOC, TN, and δ13C) were measured to assess their influence on foraminiferal eDNA assemblages. The upper- (2.17–2.18 m PD, 189–190 SWLI) and mid-mangrove (2.17–2.22 m PD, 190–195 SWLI) monitoring stations shared similar elevations due to the flat topography of the mangrove forest compared to the upper-mudflat station (1.27–1.31 m PD, 93–99 SWLI). The upper-mangrove and mid-mangrove environments are characterized by lower salinity and higher pH, while the upper mudflat exhibits lower total organic carbon (TOC) and higher δ13C values (Fig. 6c, Table 2).
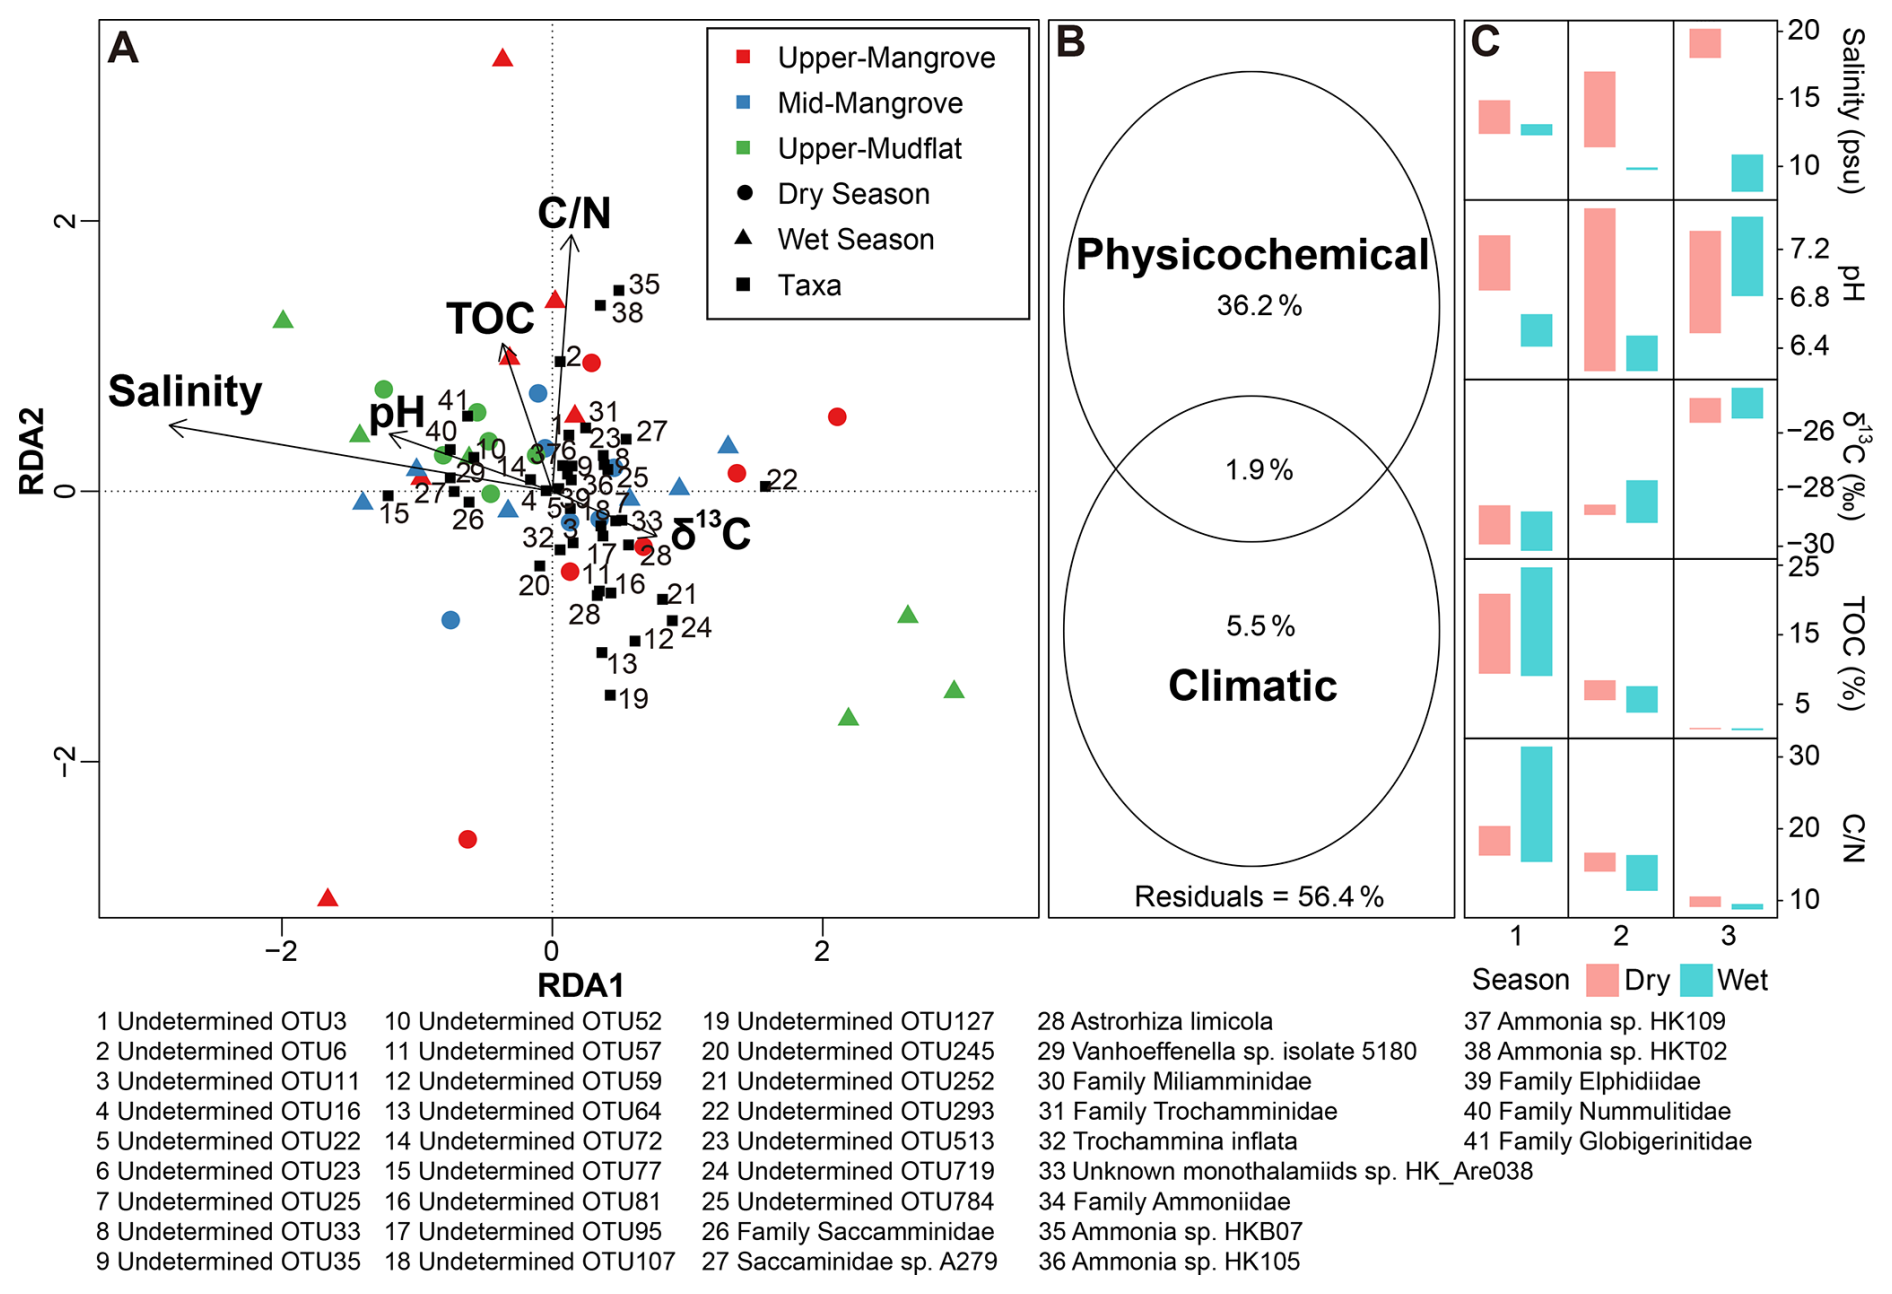
Figure 6Environmental drivers of foraminiferal community structure. (a) Redundancy analysis (RDA) bioplot of dominant foraminiferal taxa (> 5 % relative abundance in at least one sample) and examined environmental variables. (b) Variance partitioning of community composition among physicochemical environmental variables and climatic data. Residual values are also shown. (c) Vertical bars represent the observed minimum–maximum range of environmental variables measured at three monitoring stations during dry and wet seasons. (1: upper-mangrove station; 2: mid-mangrove station; 3: upper-mudflat station).
Several measured environmental variables exhibited seasonal variation across the three environments (Fig. 6c, Table 2). Nevertheless, results from the LMMs indicated that only salinity at the upper-mudflat station exhibited a significant difference, being much higher in the dry season (18.0–20.2) than in the wet season (8.1–10.9, LMMs, p<0.05). Taxa distribution was influenced by examined environmental conditions and climatic factors (temperature, precipitation, sea surface temperature) (Fig. 6). Salinity, pH, and TOC (ANOVA, p<0.01) significantly influenced foraminiferal eDNA composition across environments and seasons. Nevertheless, tidal elevation of each monitoring station remained the dominant driver shown by pRDA, explaining 13 % of the variance in eDNA assemblages, followed by salinity (11 %) and pH (7 %). Most taxa clustered near the center of the RDA bioplot, suggesting broad environmental tolerance, but some (e.g., Nummulitidae; Spearman's ρ with salinity = 0.20, ρ with pH = 0.19) exhibited positive correlations with salinity and pH (Fig. 6a). Many undetermined OTUs (e.g., OTU59; Spearman's ρ with TOC = −0.61) showed negative correlations with TOC (Fig. 6a). RDA analyses performed separately for the dry and wet seasons indicated that salinity and pH were the only significant drivers of community variation in both seasons (ANOVA, p<0.01). However, their relationship shifted seasonally, showing a positive association in the wet season but an inverse relationship in the dry season (Fig. S1). Variance partitioning analysis revealed that physicochemical environmental properties explained 36.2 % of the variance in eDNA assemblages, while climatic variables (including temperature, sea surface temperature, and precipitation) accounted for 5.5 % (Fig. 6b).
Table 2Environmental variables measured at each monitoring station per season.
3.5 Relative sea level (RSL) estimation of each monitoring station
A foraminiferal eDNA BTF developed from a previously established modern training set (Liu et al., 2025) was used with the present eDNA dataset to estimate elevation for all replicate samples collected from each monitoring station across seasons and years. For the mangrove stations, the estimated elevations fell within the observed elevation range (within the 95 % uncertainty interval) for both dry and wet seasons (Fig. 7). In contrast, the BTF consistently overpredicted elevations in both seasons at the upper-mudflat station. The dry-season samples from the upper-mudflat station exhibited the narrowest prediction range (121–132 SWLI; Table S7), while the wet-season samples from the upper-mudflat station had the lowest average 1σ uncertainty (7.5 SWLI, 0.38 m) (Table S7).
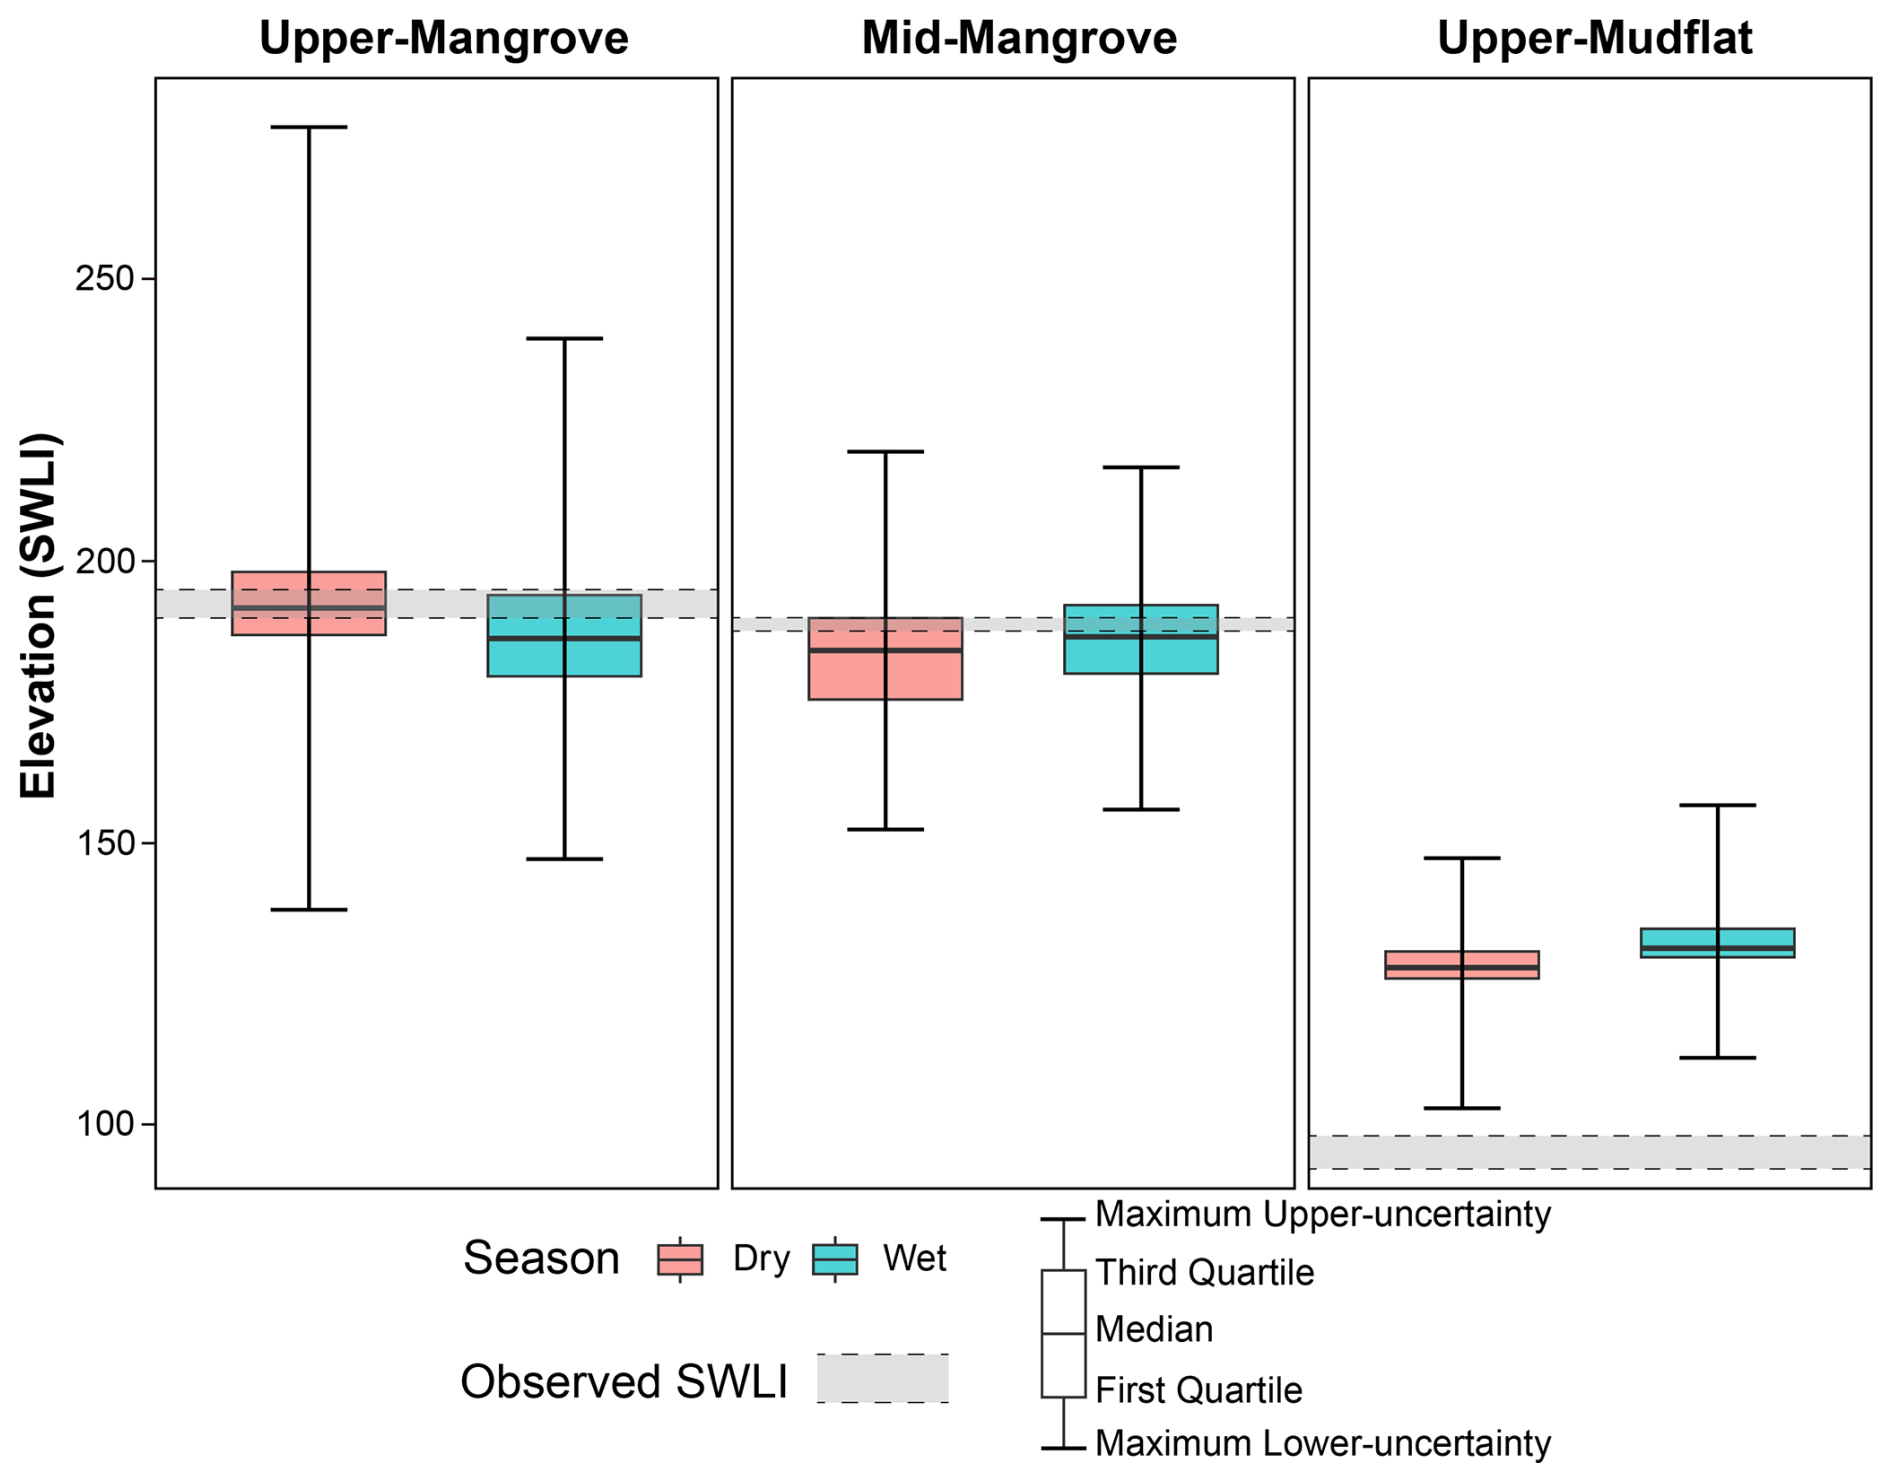
Figure 7Elevation estimates (standardized water level index unit, SWLI) for each monitoring station during dry and wet seasons based on foraminiferal eDNA assemblage. Distributions represent six replicate samples per station and season. Error bars indicate the maximum 2σ uncertainty across replicates. The range of observed elevation at each station is shown by the dashed gray bar.
4.1 Temporal and spatial variation in foraminiferal eDNA assemblage
Foraminiferal eDNA assemblages varied temporally across seasons within specific habitats but were spatially stable at small scales (i.e., low patchiness) across our three intertidal monitoring stations. Temporal variation patterns likely reflected fundamental differences in the composition and sources of eDNA across environments. At the mid-mangrove station, community composition remained relatively stable throughout the year (Figs. 4, 5a). This stability suggests an environment which may buffer short-term seasonal changes due to reduced variability in environmental conditions, as observed in previous mangrove studies (Camp et al., 2016; Alongi, 2022). Consequently, the eDNA assemblage tends to reflect long-term environmental gradients, such as tidal elevation, which are shaped by persistent factors like the duration and frequency of inundation or subaerial exposure (Horton and Culver, 2008; Woodroffe et al., 2005). Additionally, the eDNA pool could be dominated by accumulated extracellular DNA from local populations across multiple generations, which can contribute > 40 % of total sediment eDNA (Caro et al., 2023; Carini et al., 2016; Ascher et al., 2009). This interpretation – that extracellular DNA may potentially dominate the assemblage – is consistent with traditional morphological studies, where dead foraminiferal tests also show limited seasonal variability compared to living (rose Bengal-stained) assemblages (Buzas et al., 2015; Hippensteel et al., 2002; Horton and Edwards, 2003; Horton and Murray, 2006; Walker et al., 2020). However, validating this hypothesis will require further research employing methods such as environmental RNA (eRNA) (Pearman et al., 2022; Pochon et al., 2017) or eDNA fractionation (Nagler et al., 2018, 2021).
In contrast to the mid-mangrove station stability, the upper-mangrove and upper-mudflat stations exhibited marked seasonal changes in the relative abundance of dominant taxa such as Saccamminidae and OTU3 (Figs. 3, 4). This indicates a greater response of the foraminiferal community to seasonal drivers in these environments, suggesting that the eDNA assemblages there could be more reflective of short-term environmental fluctuations (Goldberg et al., 2011; Ellegaard et al., 2020; Singer et al., 2023; Torti et al., 2018). Ecologically, the observed seasonal variation in eDNA assemblages among stations appears to be driven by the life histories and environmental sensitivities of key foraminiferal taxa. Hard-shelled foraminifera, such as those in the family Ammoniidae, exhibited significant seasonal variation (Table S3), with higher abundance in the wet season at the mid-mangrove station (Fig. 3). This is consistent with morphological surveys, which report that calcareous taxa typically reach peak densities during spring and summer, coinciding with warmer temperatures and increased phytoplankton and zooplankton productivity (Alve and Murray, 1999; Horton and Edwards, 2003; Berkeley et al., 2008; Murray and Alve, 2000; Richirt et al., 2020). These seasonal population cycles likely lead to increased eDNA production rates during reproductive periods (Buxton et al., 2017; Spear et al., 2015; Fukumoto et al., 2015), resulting in changes in eDNA assemblages that respond more rapidly than morphological methods and influence the taxonomic composition detected in our samples.
Conversely, monothalamous taxa – particularly Saccamminidae – were especially abundant during the dry season and contributed disproportionately to the observed seasonality. These taxa are known to be more sensitive to environmental change (He et al., 2019), and their seasonal dynamics are not captured in traditional morphological surveys using routine methodology due to poor preservation of their delicate tests (Schönfeld et al., 2012). Recent studies suggest that Saccamminidae may decline during summer, possibly due to colonization of their preferred substrate by algal blooms (Henderson, 2023), while eDNA surveys in French estuarine mudflats have reported their highest abundances in the fall (Singer et al., 2023). This pronounced seasonality in Saccamminidae abundance helps explain our earlier RSL reconstruction efforts at this site (Liu et al., 2025), where the modern training set – based on wet-season samples (primarily collected between June and August 2022) – showed comparatively lower Saccamminidae representation. In that study, Saccamminidae abundances reached up to 23 % (from MTL to MHHW), similar to the 9 %–36 % observed in the wet-season samples of the present study (Fig. 3), but much lower than the abundances observed during the dry season (4 %–60 %; Fig. 3). Although including monothalamids improves BTF performance (Liu et al., 2025), our results suggest that the timing of the collection of training set samples is an important consideration. In our study area, sample collection during the wet season – when Saccamminidae are less dominant – yields more balanced representation of indicator taxa and prevents compositional bias in eDNA data (Gloor et al., 2017). This approach is preferable for new studies aiming to explore the relationship between eDNA assemblages and tidal elevation, as it reduces the risk of dominant taxa masking underlying ecological patterns.
Our study also provides insights into the spatial variability in eDNA assemblages. In RSL reconstruction, small-scale spatial variability in foraminiferal assemblages may introduce bias into modern training sets, reducing their accuracy in capturing tidal elevation signals (Kemp et al., 2011; Yu et al., 2025). The upper-mangrove station exhibited the greatest heterogeneity among replicate samples (Table 1), but overall community structure and composition of dominant taxa remained consistent across all monitoring stations, indicating strong spatial stability at microscales (within 1 × 1 m). Although small-scale spatial variability in intertidal foraminiferal communities can be driven by the adaptation of living populations to local microhabitats and biotic factors such as predation pressure (Buzas, 1970, 1982) or food resource availability (Alve and Murray, 2001; Fontanier et al., 2003), the environments and conditions at our study site seemed to be relatively homogeneous. Consequently, the overall eDNA assemblages were primarily shaped by larger-scale environmental differences among the different stations (Fig. 6c), including salinity, δ13C, TOC, and ratio, rather than by fine-scale spatial heterogeneity. Accordingly, they did not display the pronounced spatial patchiness observed in deep-sea (Lejzerowicz et al., 2014) or temperate mudflat environments (Singer et al., 2023). This spatial stability has important implications for both paleoenvironmental reconstruction and contemporary monitoring. It supports the sampling design used in modern training sets for tidal elevation reconstruction, where single samples from narrow elevation intervals (typically < 10 cm) are assumed to be representative of community structure at that elevation. It also suggests that eDNA-based monitoring in mangrove and mudflat systems can reliably capture the dominant community structure without intensive spatial replication under relatively uniform environmental conditions. This supports the use of single or pooled samples to represent local assemblages in coastal monitoring programs.
4.2 Factors influencing seasonality in foraminiferal eDNA assemblages
A range of abiotic and biotic environmental factors have long been recognized as important drivers of foraminiferal community composition in intertidal settings (Debenay et al., 2006; Armynot Du Châtelet et al., 2009b; Lei et al., 2017; Murray, 2006; Armynot Du Châtelet et al., 2009a). Our results further demonstrate that temporal fluctuations in environmental variables, shaped by seasonal and tidal cycles, are closely linked to the observed seasonality in foraminiferal eDNA assemblages. Salinity, pH, and total organic carbon (TOC) are significantly correlated with seasonal variation in foraminiferal eDNA community structure shown by RDA. These variables, in turn, are influenced by broader climatic drivers such as temperature, precipitation, and river discharge. Understanding these relationships is critical for the development and application of foraminiferal eDNA as an ecological indicator, as it highlights which environmental variables must be monitored or controlled to ensure reliable interpretation.
Among the short-term environmental variables examined here (Table 2), salinity was the primary driver of seasonal changes in foraminiferal eDNA assemblages (Fig. 6a). During the wet season, increased precipitation and river discharge lowered salinity, favoring taxa adapted to reduced salinity (e.g., Trochammina inflata (Montagu, 1808), which increased from 1 %–2 % to 1 %–18 % at the upper-mangrove station; Fig. 4) while constraining more stenohaline taxa (e.g., Saccaminidae sp. A279, which decreased from 1 %–17 % to < 2 % at the upper-mudflat station; Figs. 3, 4) that are intolerant of broader salinity ranges (Singer et al., 2023; Jorissen et al., 2022; Li et al., 2023). In parallel, lower pH during the wet season likely influenced the abundance of calcareous foraminifera by affecting calcification and metabolic processes (Dong et al., 2020; Le Cadre et al., 2003). Likewise, fluctuations in TOC content indicated changes in food availability important for juvenile recruitment (Murray, 2006), while fluctuation in ratio and δ13C is an indication of potential changes in the food resource composition (Bouillon et al., 2002). Collectively, these examined physicochemical environmental variables shaped the distinct seasonal community patterns observed across the intertidal zone (Figs. 3, 4). Although grain size variation was relatively minor within our study area (Liu et al., 2025; Yu et al., 2025) and was therefore not examined, sediment texture and local hydrodynamics may also influence foraminiferal eDNA distributions and should be considered in future studies spanning broader spatial scales.
In addition to environmental factors like salinity and pH, climatic variables such as temperature also influence foraminiferal assemblages in intertidal zones, as shown by both morphological (Kaminski et al., 2021; Lei et al., 2017; Murray and Alve, 2000) and eDNA-based studies (Singer et al., 2023). However, variance partitioning in our study revealed that physicochemical environmental variables collectively explained 36.2 % of variation in eDNA assemblages, while climatic factors collectively explained only 5.5 % of the variation in eDNA assemblages (Fig. 6b). Although increasing temperature can enhance organisms' metabolism and, consequently, foraminiferal growth (Dong et al., 2019; Prazeres and Pandolfi, 2016; Lombard et al., 2009), the seasonal temperature variation in our study area per sampling was relatively small (up to 4.6 °C; Fig. 2, Table S1). Therefore, it is likely that climatic factors primarily exert indirect effects on foraminiferal communities by modulating local short-term environmental conditions. The seasonal shift in the relationship between salinity and pH provides an example of this interaction (Fig. S1). During the wet season, salinity and pH showed a positive relationship, likely driven by freshwater input that simultaneously reduced both variables across the intertidal gradient. In contrast, during the dry season, salinity and pH were negatively correlated, indicating that site-specific processes may exert stronger control over climatic influences.
Environmental variables not only affect living foraminiferal communities but may also influence the properties and preservation of eDNA itself. Higher temperatures during the wet season may accelerate extracellular and dead organisms' eDNA degradation via increased physical stress and bacterial nuclease activity (Eichmiller et al., 2016; Lance et al., 2017; Strickler et al., 2015; Wood et al., 2020), potentially increasing the proportion of eDNA derived from living populations. On the other hand, increased river discharge and stronger hydrodynamics during the wet season may elevate transportation of exogenous eDNA (e.g., propagules) into the intertidal zone (Harrison et al., 2019; Ji et al., 2020; Nevers et al., 2020), potentially introducing uncertainty when correlating tidal elevation with vertical zonation of foraminiferal eDNA assemblages.
Meanwhile, the taphonomy of eDNA itself may partly shape the seasonal patterns observed in the foraminiferal eDNA assemblages. Although the upper-mangrove and upper-mudflat stations were enriched in Saccamminidae signals, these signals declined during the wet season (Figs. 3, 4). Because DNA can degrade rapidly in intertidal sediments (Schweizer, 2015), eDNA amplified from surface sediment is likely to be biased toward fresh intracellular DNA from living or recently active individuals (Angeles et al., 2020). When Saccamminidae no longer thrive during the wet season, their relative contribution to the total eDNA pool at the monitoring stations consequently decreases. Over longer timescales, however, eDNA preserved in the sediment archive is likely to represent a more integrated signal, derived mainly from extracellular or relict DNA and reflecting cumulative population flux rather than short-term living assemblages alone (Liu et al., 2025; Angeles et al., 2020).
Despite these seasonal effects, tidal elevation explained the largest proportion of variation in foraminiferal eDNA assemblages, highlighting its overriding and persistent influence that is consistent with previous morphological studies (Armynot Du Châtelet et al., 2018; Lei et al., 2017). Tidal elevation shapes distinct physicochemical gradients across the study area, as reflected in δ13C values and TOC content (Table 2), which both directly influence foraminiferal communities and mediate the effects of seasonal environmental changes at different elevations. While seasonal variations in salinity, pH, and TOC shape temporal patterns in foraminiferal assemblages, tidal elevation remains the dominant factor, emphasizing the key role of local environmental context in structuring intertidal communities.
4.3 Implications of temporal variation in foraminiferal eDNA for sea-level reconstruction
Our results demonstrate that foraminiferal eDNA assemblages serve as reliable proxies for tidal elevation in mangrove environments, with elevation estimates derived from eDNA BTFs for both dry and wet seasons generally falling within the observed elevation ranges of the sampled mangrove stations (Fig. 7). This reliability supports the use of mangrove-derived eDNA samples for constructing modern training sets throughout the year, although broader seasonal and interannual replication is required to confirm the stability of this relationship. In contrast, the accuracy of eDNA-based reconstructions was reduced at the upper-mudflat station situated at a transitional zone, where elevation estimates were consistently overpredicted (Fig. 7). This limitation is potentially driven by increased contributions of allochthonous and propagule-derived eDNA in these dynamic environments (Angeles et al., 2020; Goldstein and Alve, 2011; Singer et al., 2023), especially during the wet season. The potential influx of allochthonous eDNA, particularly from higher-elevation mangrove environments, expands the apparent environmental tolerances of some taxa (e.g., Vanhoeffenella sp. isolate 5180) and increases uncertainty in elevation estimates of the transitional zone. Additionally, anthropogenic disturbance in the transitional zone (Yu et al., 2025) may exacerbate habitat instability and further confound the eDNA signal. These findings mirror morphological studies, which report greater community turnover and weaker tidal elevation gradients at lower-elevation mudflats (Lei et al., 2017), resulting in larger offsets in RSL estimates.
Our findings support several recommendations for optimizing foraminiferal eDNA as a sea-level indicator for reconstructing RSL change: (1) prioritizing stable mangrove environments for constructing modern training sets, as these yield signals most closely linked to local tidal elevation; (2) avoiding environmental transitional zones, such as the upper mudflat, where possible to minimize allochthonous influences; and (3) utilizing single samples per homogeneous environment, as this is sufficient to capture local foraminiferal eDNA diversity in line with patterns observed in morphological studies (Horton and Edwards, 2006; Kemp et al., 2009; Kemp et al., 2012), which our results show are sufficient for spatial representation. By refining both sampling strategies and analytical approaches, foraminiferal eDNA has considerable potential to contribute to more accurate and robust reconstructions of past RSL change in coastal wetlands.
Our study provides new insights into the temporal and spatial variation in foraminiferal eDNA assemblages and their implications for RSL reconstruction. Foraminiferal eDNA assemblages at the mid-mangrove monitoring station remained relatively stable across seasons, demonstrating a possible buffering of seasonal variations by the environment or a potential extracellular eDNA dominance, whereas the upper-mangrove station showed significant seasonal variation. The mudflat environment displayed distinctly different foraminiferal eDNA assemblages between the dry and wet seasons, showing a potentially greater contribution from propagules and exogenous eDNA than in mangrove sites that are further from the open sea. Despite the influence of seasonally variable environmental and climatic factors, tidal elevation remained the dominant factor shaping eDNA assemblages. Elevation estimates produced by the eDNA BTF for the mangrove monitoring stations are accurate for both dry and wet seasons, while predictions for the upper-mudflat station during the wet season failed to be accurate. Our results reveal that foraminiferal eDNA assemblages display environment-specific seasonal variability, necessitating cautious interpretation of mudflat samples given their pronounced sensitivity to seasonal changes. Nevertheless, we demonstrate that eDNA remains a robust and broadly applicable proxy for RSL reconstruction, ensuring its utility for future studies.
Raw sequence data are deposited in the Sequence Read Archive (SRA) at NCBI (PRJNA1306768; https://submit.ncbi.nlm.nih.gov/subs/sra/SUB15541718/overview, last access: 30 October 2025).
All supplementary tables are provided in the Excel file entitled “Supplementary Tables of: Temporal and spatial variability of mudflat and mangrove foraminiferal eDNA assemblages and its implication for sea-level reconstruction” deposited on Figshare (https://doi.org/10.6084/m9.figshare.31829704). Supplementary figures have been provided in the Supplement. The supplement related to this article is available online at https://doi.org/10.5194/jm-45-679-2026-supplement.
ZJL: conceptualization, data curation, formal analysis, methodology, software, visualization, writing (original draft). NSK: conceptualization, funding acquisition, project administration, resources, supervision, methodology, writing (review and editing). HKYY: investigation, writing (review and editing). MS: methodology, writing (review and editing). JSW: methodology, writing (review and editing). CS: conceptualization, resources, supervision, methodology, writing (review and editing).
The contact author has declared that none of the authors has any competing interests.
Publisher's note: Copernicus Publications remains neutral with regard to jurisdictional claims made in the text, published maps, institutional affiliations, or any other geographical representation in this paper. The authors bear the ultimate responsibility for providing appropriate place names. Views expressed in the text are those of the authors and do not necessarily reflect the views of the publisher.
We gratefully acknowledge the World Wide Fund for Nature for permitting this research in the Mai Po Nature Reserve and for their continuous conservation efforts in Hong Kong. We also extend our sincere appreciation to Gao Chengcheng and Qin Yonghui (listed alphabetically) for their invaluable assistance during challenging fieldwork conditions.
This research has been supported by the Research Grants Council of Hong Kong (grant nos. 27300221 and 17303925).
This paper was edited by Luke Mander and reviewed by Robin Edwards and one anonymous referee.
Alongi, D. M.: Climate change and mangroves, in: Mangroves: biodiversity, livelihoods and conservation, Springer, 175–198, https://doi.org/10.1007/978-981-19-0519-3_8, 2022.
Altschul, S. F., Gish, W., Miller, W., Myers, E. W., and Lipman, D. J.: Basic local alignment search tool, J. Mol. Biol., 215, 403–410, https://doi.org/10.1016/S0022-2836(05)80360-2, 1990.
Alve, E. and Murray, J. W.: Marginal marine environments of the Skagerrak and Kattegat: a baseline study of living (stained) benthic foraminiferal ecology, Palaeogeogr. Palaeocl., 146, 171–193, https://doi.org/10.1016/S0031-0182(98)00131-X, 1999.
Alve, E. and Murray, J. W.: Temporal variability in vertical distributions of live (stained) intertidal foraminifera, southern England, J. Foramin. Res., 31, 12–24, https://doi.org/10.2113/0310012, 2001.
Anderson, M. J.: Permutational multivariate analysis of variance (PERMANOVA), Wiley Statsref: statistics reference online, 15 pp., https://doi.org/10.1002/9781118445112.stat07841, 2014.
Angeles, I. B., Lejzerowicz, F., Cordier, T., Scheplitz, J., Kucera, M., Ariztegui, D., Pawlowski, J., and Morard, R.: Planktonic foraminifera eDNA signature deposited on the seafloor remains preserved after burial in marine sediments, Sci. Rep.-UK, 10, 20351, https://doi.org/10.1038/s41598-020-77179-8, 2020.
Armynot Du Châtelet, É., Bout-Roumazeilles, V., Riboulleau, A., and Trentesaux, A.: Sediment (grain size and clay mineralogy) and organic matter quality control on living benthic foraminifera, Revue de Micropaléontologie, 52, 75–84, https://doi.org/10.1016/j.revmic.2008.10.002, 2009a.
Armynot Du Châtelet, É., Degre, D., Sauriau, P.-G., and Debenay, J.-P.: Distribution of living benthic foraminifera in relation with environmental variables within the Aiguillon cove (Atlantic coast, France): improving knowledge for paleoecological interpretation, B. Soc. Bot. Fr., 180, 131–144, https://doi.org/10.2113/gssgfbull.180.2.131, 2009b.
Armynot Du Châtelet, É., Francescangeli, F., Bouchet, V., and Frontalini, F.: Benthic foraminifera in transitional environments in the English Channel and the southern North Sea: A proxy for regional-scale environmental and paleo-environmental characterisations, Mar. Environ. Res., 137, 37–48, https://doi.org/10.1016/j.marenvres.2018.02.021, 2018.
Ascher, J., Ceccherini, M. T., Pantani, O.-L., Agnelli, A., Borgogni, F., Guerri, G., Nannipieri, P., and Pietramellara, G.: Sequential extraction and genetic fingerprinting of a forest soil metagenome, Appl. Soil. Ecol., 42, 176–181, https://doi.org/10.1016/j.apsoil.2009.03.005, 2009.
Bakker, J., Wangensteen, O. S., Baillie, C., Buddo, D., Chapman, D. D., Gallagher, A. J., Guttridge, T. L., Hertler, H., and Mariani, S.: Biodiversity assessment of tropical shelf eukaryotic communities via pelagic eDNA metabarcoding, Ecol. Evol., 9, 14341–14355, https://doi.org/10.1002/ece3.5871, 2019.
Barnett, R. L., Garneau, M., and Bernatchez, P.: Salt-marsh sea-level indicators and transfer function development for the Magdalen Islands in the Gulf of St. Lawrence, Canada, Mar. Micropaleontol., 122, 13–26, https://doi.org/10.1016/j.marmicro.2015.11.003, 2016.
Berkeley, A., Perry, C., Smithers, S., and Horton, B.: The spatial and vertical distribution of living (stained) benthic foraminifera from a tropical, intertidal environment, north Queensland, Australia, Mar. Micropaleontol., 69, 240–261, https://doi.org/10.1016/j.marmicro.2008.08.002, 2008.
Berkeley, A., Perry, C. T., and Smithers, S. G.: Taphonomic signatures and patterns of test degradation on tropical, intertidal benthic foraminifera, Mar. Micropaleontol., 73, 148–163, https://doi.org/10.1016/j.marmicro.2009.08.002, 2009.
Bista, I., Carvalho, G. R., Walsh, K., Seymour, M., Hajibabaei, M., Lallias, D., Christmas, M., and Creer, S.: Annual time-series analysis of aqueous eDNA reveals ecologically relevant dynamics of lake ecosystem biodiversity, Nat. Commun., 8, 14087, https://doi.org/10.1038/ncomms14087, 2017.
Bouchet, V. M., Frontalini, F., Francescangeli, F., Sauriau, P.-G., Geslin, E., Martins, M. V. A., Almogi-Labin, A., Avnaim-Katav, S., Di Bella, L., and Cearreta, A.: Indicative value of benthic foraminifera for biomonitoring: Assignment to ecological groups of sensitivity to total organic carbon of species from European intertidal areas and transitional waters, Mar. Pollut. Bull., 164, 112071, https://doi.org/10.1016/j.marpolbul.2021.112071, 2021.
Bouillon, S., Koedam, N., Raman, A., and Dehairs, F.: Primary producers sustaining macro-invertebrate communities in intertidal mangrove forests, Oecologia, 130, 441–448, https://doi.org/10.1007/s004420100814, 2002.
Brinkmann, I., Schweizer, M., Singer, D., Quinchard, S., Barras, C., Bernhard, J. M., and Filipsson, H. L.: Through the eDNA looking glass: Responses of fjord benthic foraminiferal communities to contrasting environmental conditions, J. Eukaryot. Microbiol., 70, e12975, https://doi.org/10.1111/jeu.12975, 2023.
Buragohain, D. and Ghosh, A.: Seasonal Distribution Trends of Benthic Foraminiferal Assemblages from the Saurashtra Coast, Western India, J. Geol. Soc. India, 97, 61–69, https://doi.org/10.1007/s12594-021-1626-1, 2021.
Buxton, A. S., Groombridge, J. J., Zakaria, N. B., and Griffiths, R. A.: Seasonal variation in environmental DNA in relation to population size and environmental factors, Sci. Rep.-UK, 7, 46294, https://doi.org/10.1038/srep46294, 2017.
Buzas, M. A.: Spatial homogeneity: statistical analyses of unispecies and multispecies populations of foraminifera, Ecology, 51, 874–879, https://doi.org/10.2307/1933980, 1970.
Buzas, M. A.: Regulation of foraminiferal densities by predation in the Indian River, Florida, J. Foramin. Res., 12, 66–71, https://doi.org/10.2113/gsjfr.12.1.66, 1982.
Buzas, M. A., C Hayek, L.-A., Jett, J. A., and Reed, S. A.: Pulsating patches: History and Analyses of spatial, seasonal, and yearly distribution of living benthic foraminifera, Smithsonian Contributions to Paleobiology, Smithsonian Institution Scholarly Press, https://doi.org/10.5479/si.19436688.97, 2015.
Cahill, N., Kemp, A. C., Horton, B. P., and Parnell, A. C.: A Bayesian hierarchical model for reconstructing relative sea level: from raw data to rates of change, Clim. Past, 12, 525–542, https://doi.org/10.5194/cp-12-525-2016, 2016.
Camp, E. F., Suggett, D. J., Gendron, G., Jompa, J., Manfrino, C., and Smith, D. J.: Mangrove and seagrass beds provide different biogeochemical services for corals threatened by climate change, Frontiers in Marine Science, 3, 52, https://doi.org/10.3389/fmars.2016.00052, 2016.
Carini, P., Marsden, P. J., Leff, J. W., Morgan, E. E., Strickland, M. S., and Fierer, N.: Relic DNA is abundant in soil and obscures estimates of soil microbial diversity, Nat. Microbiol., 2, 1–6, https://doi.org/10.1038/nmicrobiol.2016.242, 2016.
Caro, D. M., Horstmann, L., Ganzert, L., Oses, R., Friedl, T., and Wagner, D.: An improved method for intracellular DNA (iDNA) recovery from terrestrial environments, MicrobiologyOpen, 12, e1369, https://doi.org/10.1002/mbo3.1369, 2023.
Chen, J., Zhou, Z., and Gu, J.-D.: Seasonal variations of n-damo bacterial community in the subtropical Mai Po mangrove wetland of Hong Kong, Int. Biodeter. Biodegr., 175, 105503, https://doi.org/10.1016/j.ibiod.2022.105503, 2022.
Chung, A., Kam, Y., Shea, S. K., and Schunter, C.: Detecting Fish Diversity in Urban-Impacted Ecosystems: A Comparative Approach of eDNA Metabarcoding and UVC, Environmental DNA, 6, e70048, https://doi.org/10.1002/edn3.70048, 2024.
Debenay, J.-P., Bicchi, E., Goubert, E., and Du Châtelet, E. A.: Spatio-temporal distribution of benthic foraminifera in relation to estuarine dynamics (Vie estuary, Vendée, W France), Estuar. Coast. Shelf S., 67, 181–197, https://doi.org/10.1016/j.ecss.2005.11.014, 2006.
Ding, Y. and Chan, J. C.: The East Asian summer monsoon: an overview, Meteorol. Atmos. Phys., 89, 117–142, https://doi.org/10.1007/s00703-005-0125-z, 2005.
Dong, S., Lei, Y., Li, T., and Jian, Z.: Responses of benthic foraminifera to changes of temperature and salinity: Results from a laboratory culture experiment, Science China Earth Sciences, 62, 459–472, https://doi.org/10.1007/s11430-017-9269-3, 2019.
Dong, S., Lei, Y., Li, T., and Jian, Z.: Response of benthic foraminifera to pH changes: Community structure and morphological transformation studies from a microcosm experiment, Mar. Micropaleontol., 156, 101819, https://doi.org/10.1016/j.marmicro.2019.101819, 2020.
Edwards, R. and Horton, B.: Reconstructing relative sea-level change using UK salt-marsh foraminifera, Mar. Geol., 169, 41–56, https://doi.org/10.1016/S0025-3227(00)00078-5, 2000.
Eichmiller, J. J., Best, S. E., and Sorensen, P. W.: Effects of temperature and trophic state on degradation of environmental DNA in lake water, Environ. Sci. Technol., 50, 1859–1867, https://doi.org/10.1021/acs.est.5b05672, 2016.
Ellegaard, M., Clokie, M. R., Czypionka, T., Frisch, D., Godhe, A., Kremp, A., Letarov, A., McGenity, T. J., Ribeiro, S., and John Anderson, N.: Dead or alive: sediment DNA archives as tools for tracking aquatic evolution and adaptation, Communications Biology, 3, 169, https://doi.org/10.1038/s42003-020-0899-z, 2020.
Fatela, F. and Taborda, R.: Confidence limits of species proportions in microfossil assemblages, Mar. Micropaleontol., 45, 169–174, https://doi.org/10.1016/S0377-8398(02)00021-X, 2002.
Fontanier, C., Jorissen, F., Chaillou, G., David, C., Anschutz, P., and Lafon, V.: Seasonal and interannual variability of benthic foraminiferal faunas at 550 m depth in the Bay of Biscay, Deep-Sea Res. Pt. I, 50, 457–494, https://doi.org/10.1016/S0967-0637(02)00167-X, 2003.
Fouet, M. P., Schweizer, M., Singer, D., Richirt, J., Quinchard, S., and Jorissen, F. J.: Unravelling the distribution of three Ammonia species (Foraminifera, Rhizaria) in French Atlantic Coast estuaries using morphological and metabarcoding approaches, Mar. Micropaleontol., 188, 102353, https://doi.org/10.1016/j.marmicro.2024.102353, 2024.
Frontalini, F., Buosi, C., Da Pelo, S., Coccioni, R., Cherchi, A., and Bucci, C.: Benthic foraminifera as bio-indicators of trace element pollution in the heavily contaminated Santa Gilla lagoon (Cagliari, Italy), Mar. Pollut. Bull., 58, 858–877, https://doi.org/10.1016/j.marpolbul.2009.01.015, 2009.
Fukumoto, S., Ushimaru, A., and Minamoto, T.: A basin-scale application of environmental DNA assessment for rare endemic species and closely related exotic species in rivers: A case study of giant salamanders in Japan, J. Appl. Ecol., 52, 358–365, https://doi.org/10.1111/1365-2664.12392, 2015.
Galili, T., O'Callaghan, A., Sidi, J., and Sievert, C.: heatmaply: an R package for creating interactive cluster heatmaps for online publishing, Bioinformatics, 34, 1600–1602, https://doi.org/10.1093/bioinformatics/btx657, 2018.
Gloor, G. B., Macklaim, J. M., Pawlowsky-Glahn, V., and Egozcue, J. J.: Microbiome datasets are compositional: and this is not optional, Front. Microbiol., 8, 2224, https://doi.org/10.3389/fmicb.2017.02224, 2017.
Goldberg, C. S., Pilliod, D. S., Arkle, R. S., and Waits, L. P.: Molecular detection of vertebrates in stream water: a demonstration using Rocky Mountain tailed frogs and Idaho giant salamanders, PLOS One, 6, e22746, https://doi.org/10.1371/journal.pone.0022746, 2011.
Goldstein, S. T. and Alve, E.: Experimental assembly of foraminiferal communities from coastal propagule banks, Mar. Ecol. Prog. Ser., 437, 1–11, https://doi.org/10.3354/meps09296, 2011.
Gu, S., Deng, Y., Wang, P., Li, C., Shi, D., and Wang, S.: Assessing riverine fish community diversity and stability by eDNA metabarcoding, Ecol. Indic., 157, 111222, https://doi.org/10.1016/j.ecolind.2023.111222, 2023.
Harrison, J. B., Sunday, J. M., and Rogers, S. M.: Predicting the fate of eDNA in the environment and implications for studying biodiversity, P. Roy. Soc. B-Biol. Sci., 286, 20191409, https://doi.org/10.1098/rspb.2019.1409, 2019.
Hawkes, A. D., Horton, B., Nelson, A., and Hill, D.: The application of intertidal foraminifera to reconstruct coastal subsidence during the giant Cascadia earthquake of AD 1700 in Oregon, USA, Quatern. Int., 221, 116–140, https://doi.org/10.1016/j.quaint.2009.09.019, 2010.
Hayward, B. W., Grenfell, H., Cairns, G., and Smith, A.: Environmental controls on benthic foraminiferal and thecamoebian associations in a New Zealand tidal inlet, J. Foramin. Res., 26, 150–171, https://doi.org/10.2113/gsjfr.26.2.150, 1996.
He, X., Sutherland, T. F., Pawlowski, J., and Abbott, C. L.: Responses of foraminifera communities to aquaculture-derived organic enrichment as revealed by environmental DNA metabarcoding, Mol. Ecol., 28, 1138–1153, https://doi.org/10.1111/mec.15007, 2019.
Henderson, Z.: Soft-walled monothalamid foraminifera from the intertidal zones of the Lorn area, north-west Scotland, J. Mar. Biol. Assoc. UK, 103, e18, https://doi.org/10.1017/S0025315423000061, 2023.
Hippensteel, S. P., Martin, R. E., Nikitina, D., and Pizzuto, J. E.: Interannual variation of marsh foraminiferal assemblages (Bombay Hook National Wildlife Refuge, Smyrna, DE): Do foraminiferal assemblages have a memory?, J. Foramin. Res., 32, 97–109, https://doi.org/10.2113/0320097, 2002.
Hong Kong Observatory: Summary of Meteorological and Tidal Observations on Hong Kong, https://www.hko.gov.hk/en/publica/pubsmo.htm (last access: 30 September 2025), 2025.
Horton, B.: The distribution of contemporary intertidal foraminifera at Cowpen Marsh, Tees Estuary, UK: implications for studies of Holocene sea-level changes, Palaeogeogr. Palaeocl., 149, 127–149, https://doi.org/10.1016/S0031-0182(98)00197-7, 1999.
Horton, B. P. and Culver, S. J.: Modern intertidal foraminifera of the Outer Banks, North Carolina, USA, and their applicability for sea-level studies, J. Coastal Res., 24, 1110–1125, https://doi.org/10.2112/08A-0004.1, 2008.
Horton, B. P. and Edwards, R. J.: Seasonal distributions of foraminifera and their implications for sea-level studies, Cowpen Marsh, UK, https://doi.org/10.2110/pec.03.75.0021, 2003.
Horton, B. P. and Edwards, R. J.: Quantifying Holocene sea level change using intertidal foraminifera: lessons from the British Isles, Departmental Papers (EES), Cushman Foundation for foraminiferal research, 50 pp., https://repository.upenn.edu/ees_papers/50 (last access: 8 July 2026), 2006.
Horton, B. P. and Murray, J. W.: Patterns in cumulative increase in live and dead species from foraminiferal time series of Cowpen Marsh, Tees Estuary, UK: Implications for sea-level studies, Mar. Micropaleontol., 58, 287–315, https://doi.org/10.1016/j.marmicro.2005.10.006, 2006.
Ji, H., Pan, S., and Chen, S.: Impact of river discharge on hydrodynamics and sedimentary processes at Yellow River Delta, Mar. Geol., 425, 106210, https://doi.org/10.1016/j.margeo.2020.106210, 2020.
Jorissen, F. J., Fouet, M. P., Singer, D., and Howa, H.: The marine influence index (MII): a tool to assess estuarine intertidal mudflat environments for the purpose of foraminiferal biomonitoring, Water, 14, 676, https://doi.org/10.3390/w14040676, 2022.
Kaminski, M. A., Amao, A., Babalola, L., Khamsin, A. B., Fiorini, F., Garrison, A. M., Gull, H. M., Johnson, R. L., Tawabini, B., and Frontalini, F.: Substrate temperature as a primary control on meiofaunal populations in the intertidal zone: A dead zone attributed to elevated summer temperatures in eastern Bahrain, Regional Studies in Marine Science, 42, 101611, https://doi.org/10.1016/j.rsma.2021.101611, 2021.
Kemp, A. C. and Telford, R. J.: Transfer functions, in: Handbook of sea-level research, Transfer functions, Wiley, 470–499, https://doi.org/10.1002/9781118452547, 2015.
Kemp, A. C., Horton, B. P., and Culver, S. J.: Distribution of modern salt-marsh foraminifera in the Albemarle–Pamlico estuarine system of North Carolina, USA: Implications for sea-level research, Mar. Micropaleontol., 72, 222–238, https://doi.org/10.1016/j.marmicro.2009.06.002, 2009.
Kemp, A. C., Buzas, M. A., Horton, B. P., and Culver, S. J.: Influence of patchiness on modern salt-marsh foraminifera used in sea-level studies (North Carolina, USA), J. Foramin. Res., 41, 114–123, https://doi.org/10.2113/gsjfr.41.2.114, 2011.
Kemp, A. C., Horton, B. P., Vann, D. R., Engelhart, S. E., Pre, C. A. G., Vane, C. H., Nikitina, D., and Anisfeld, S. C.: Quantitative vertical zonation of salt-marsh foraminifera for reconstructing former sea level; an example from New Jersey, USA, Quaternary Sci. Rev., 54, 26–39, https://doi.org/10.1016/j.quascirev.2011.09.014, 2012.
Kemp, A. C., Telford, R. J., Horton, B. P., Anisfeld, S. C., and Sommerfield, C. K.: Reconstructing Holocene sea level using salt-marsh foraminifera and transfer functions: lessons from New Jersey, USA, J. Quaternary Sci., 28, 617–629, https://doi.org/10.1002/jqs.2657, 2013.
Khan, N. S., Ashe, E., Horton, B. P., Dutton, A., Kopp, R. E., Brocard, G., Engelhart, S. E., Hill, D. F., Peltier, W., and Vane, C. H.: Drivers of Holocene sea-level change in the Caribbean, Quaternary Sci. Rev., 155, 13–36, https://doi.org/10.1016/j.quascirev.2016.08.032, 2017.
Koukousioura, O., Dimiza, M. D., Triantaphyllou, M. V., and Hallock, P.: Living benthic foraminifera as an environmental proxy in coastal ecosystems: A case study from the Aegean Sea (Greece, NE Mediterranean), J. Marine Syst., 88, 489–501, https://doi.org/10.1016/j.jmarsys.2011.06.004, 2011.
Lance, R. F., Klymus, K. E., Richter, C. A., Farrington, H. L., Carr, M. R., Thompson, N., Chapman, D. C., and Baerwaldt, K. L.: Experimental observations on the decay of environmental DNA from bighead and silver carps, Management of Biological Invasions, 8, https://doi.org/10.3391/mbi.2017.8.3.08, 2017.
Langlet, D., Bouchet, V. M., Riso, R., Matsui, Y., Suga, H., Fujiwara, Y., and Nomaki, H.: Foraminiferal ecology and role in nitrogen benthic cycle in the hypoxic southeastern Bering Sea, Frontiers in Marine Science, 7, 582818, https://doi.org/10.3389/fmars.2020.582818, 2020.
Le Cadre, V. R., Debenay, J.-P., and Lesourd, M.: Low pH effects on Ammonia beccarii test deformation: implications for using test deformations as a pollution indicator, J. Foramin. Res., 33, 1–9, https://doi.org/10.2113/0330001, 2003.
Lee, S.: Carbon dynamics of Deep Bay, eastern Pearl River estuary, China. II: Trophic relationship based on carbon-and nitrogen-stable isotopes, Mar. Ecol. Prog. Ser., 205, 1–10, https://doi.org/10.3354/meps205001, 2000.
Legendre, P. and Gallagher, E. D.: Ecologically meaningful transformations for ordination of species data, Oecologia, 129, 271–280, https://doi.org/10.1007/S004420100716, 2001.
Lei, Y., Li, T., Jian, Z., and Nigam, R.: Taxonomy and distribution of benthic foraminifera in an intertidal zone of the Yellow Sea, PR China: Correlations with sediment temperature and salinity, Mar. Micropaleontol., 133, 1–20, https://doi.org/10.1016/j.marmicro.2017.04.005, 2017.
Lejzerowicz, F., Esling, P., Majewski, W., Szczuciński, W., Decelle, J., Obadia, C., Arbizu, P. M., and Pawlowski, J.: Ancient DNA complements microfossil record in deep-sea subsurface sediments, Biology Lett., 9, 20130283, https://doi.org/10.1098/rsbl.2013.0283, 2013.
Lejzerowicz, F., Esling, P., and Pawlowski, J.: Patchiness of deep-sea benthic Foraminifera across the Southern Ocean: Insights from high-throughput DNA sequencing, Deep-Sea Res Pt. II, 108, 17–26, https://doi.org/10.1016/j.dsr2.2014.07.018, 2014.
Li, M., Cao, H., Hong, Y.-G., and Gu, J.-D.: Seasonal Dynamics of Anammox Bacteria in Estuarial Sediment of the Mai Po Nature Reserve Revealed by Analyzing the 16S rRNA and Hydrazine Oxidoreductase (hzo) Genes, Microbes Environ., 26, 15–22, https://doi.org/10.1264/jsme2.ME10131, 2011.
Li, Q., Wong, F. K. K., and Fung, T.: Classification of mangrove species using combined WordView-3 and LiDAR data in Mai Po nature reserve, Hong Kong, Remote Sensing, 11, 2114, https://doi.org/10.3390/rs11182114, 2019.
Li, Q., Lei, Y., Li, H., and Li, T.: Distinct responses of abundant and rare foraminifera to environmental variables in the Antarctic region revealed by DNA metabarcoding, Frontiers in Marine Science, 10, 1089482, https://doi.org/10.3389/fmars.2023.1089482, 2023.
Liu, Z., Khan, N. S., Yu, H. K., Chung, A., Schweizer, M., and Schunter, C.: Foraminiferal environmental DNA reveals late Holocene sea-level changes, Commun. Earth Environ., 6, 1029, https://doi.org/10.1038/s43247-025-03001-w, 2025.
Lombard, F., Labeyrie, L., Michel, E., Spero, H. J., and Lea, D. W.: Modelling the temperature dependent growth rates of planktic foraminifera, Mar. Micropaleontol., 70, 1–7, https://doi.org/10.1016/j.marmicro.2008.09.004, 2009.
Luke, S. G.: Evaluating significance in linear mixed-effects models in R, Behav. Res. Methods, 49, 1494–1502, https://doi.org/10.3758/s13428-016-0809-y, 2017.
Martin, M.: Cutadapt removes adapter sequences from high-throughput sequencing reads, EMBnet. Journal, 17, 10–12, https://doi.org/10.14806/ej.17.1.200, 2011.
Matsuoka, S., Sugiyama, Y., Shimono, Y., Ushio, M., and Doi, H.: Evaluation of seasonal dynamics of fungal DNA assemblages in a flow-regulated stream in a restored forest using eDNA metabarcoding, Environ. Microbiol., 23, 4797–4806, https://doi.org/10.1111/1462-2920.15669, 2021.
Montagu, G.: Supplement to Testacea Britannica with Additional Plates, Woolmer, Exeter, 183 pp., pl. 17–30, https://www.worldcat.org/oclc/230717662 (last access: 8 July 2026), 1808.
Murray, J. W.: Ecology and applications of benthic foraminifera, Cambridge university press, https://doi.org/10.1017/CBO9780511535529, 2006.
Murray, J. W. and Alve, E.: Major aspects of foraminiferal variability (standing crop and biomass) on a monthly scale in an intertidal zone, J. Foramin. Res., 30, 177–191, https://doi.org/10.2113/0300177, 2000.
Nagler, M., Podmirseg, S. M., Ascher-Jenull, J., Sint, D., and Traugott, M.: Why eDNA fractions need consideration in biomonitoring, Mol. Ecol. Resour., 22, 2458–2470, https://doi.org/10.1111/1755-0998.13658, 2022.
Nagler, M., Podmirseg, S. M., Griffith, G. W., Insam, H., and Ascher-Jenull, J.: The use of extracellular DNA as a proxy for specific microbial activity, Appl. Microbiol. Biot., 102, 2885–2898, 2018.
Nagler, M., Podmirseg, S. M., Mayr, M., Ascher-Jenull, J., and Insam, H.: The masking effect of extracellular DNA and robustness of intracellular DNA in anaerobic digester NGS studies: A discriminatory study of the total DNA pool, Mol. Ecol., 30, 438–450, https://doi.org/10.1111/mec.15740, 2021.
Nevers, M. B., Przybyla-Kelly, K., Shively, D., Morris, C. C., Dickey, J., and Byappanahalli, M. N.: Influence of sediment and stream transport on detecting a source of environmental DNA, PLOS One, 15, e0244086, https://doi.org/10.1371/journal.pone.0244086, 2020.
Nichols, R. V., Vollmers, C., Newsom, L. A., Wang, Y., Heintzman, P. D., Leighton, M., Green, R. E., and Shapiro, B.: Minimizing polymerase biases in metabarcoding, Mol. Ecol. Resour., 18, 927–939, https://doi.org/10.1111/1755-0998.12895, 2018.
Oksanen, J., Kindt, R., Legendre, P., O'Hara, B., Stevens, M. H. H., Oksanen, M. J., and Suggests, M.: The vegan package, Community Ecology Package, 10, 719, https://doi.org/10.1007/s10531-005-0311-9, 2007.
Patterson, R. T. and Fishbein, E.: Re-examination of the statistical methods used to determine the number of point counts needed for micropaleontological quantitative research, J. Paleontol., 63, 245–248, https://doi.org/10.1017/S0022336000019272, 1989.
Pawłowska, J., Lejzerowicz, F., Esling, P., Szczuciński, W., Zajączkowski, M., and Pawlowski, J.: Ancient DNA sheds new light on the Svalbard foraminiferal fossil record of the last millennium, Geobiology, 12, 277–288, https://doi.org/10.1111/gbi.12087, 2014.
Pawlowski, J., Esling, P., Lejzerowicz, F., Cedhagen, T., and Wilding, T. A.: Environmental monitoring through protist next-generation sequencing metabarcoding: assessing the impact of fish farming on benthic foraminifera communities, Mol. Ecol. Resour., 14, 1129–1140, https://doi.org/10.1111/1755-0998.12261, 2014.
Pawlowski, J., Esling, P., Lejzerowicz, F., Cordier, T., Visco, J. A., Martins, C. I., Kvalvik, A., Staven, K., and Cedhagen, T.: Benthic monitoring of salmon farms in Norway using foraminiferal metabarcoding, Aquacult. Env. Interac., 8, 371–386, https://doi.org/10.3354/aei00182, 2016.
Pearman, J. K., Biessy, L., Howarth, J. D., Vandergoes, M. J., Rees, A., and Wood, S. A.: Deciphering the molecular signal from past and alive bacterial communities in aquatic sedimentary archives, Mol. Ecol. Resour., 22, 877–890, https://doi.org/10.1111/1755-0998.13515, 2022.
Peres-Neto, P. R., Legendre, P., Dray, S., and Borcard, D.: Variation partitioning of species data matrices: estimation and comparison of fractions, Ecology, 87, 2614–2625, https://doi.org/10.1890/0012-9658(2006)87[2614:VPOSDM]2.0.CO;2, 2006.
Piña-Ochoa, E., Høgslund, S., Geslin, E., Cedhagen, T., Revsbech, N. P., Nielsen, L. P., Schweizer, M., Jorissen, F., Rysgaard, S., and Risgaard-Petersen, N.: Widespread occurrence of nitrate storage and denitrification among Foraminifera and Gromiida, P. Natl. Acad. Sci. USA, 107, 1148–1153, https://doi.org/10.1073/pnas.0908440107, 2010.
Pochon, X., Zaiko, A., Fletcher, L. M., Laroche, O., and Wood, S. A.: Wanted dead or alive? Using metabarcoding of environmental DNA and RNA to distinguish living assemblages for biosecurity applications, PLOS One, 12, e0187636, https://doi.org/10.1371/journal.pone.0187636, 2017.
Prazeres, M. and Pandolfi, J. M.: Effects of elevated temperature on the shell density of the large benthic Foraminifera Amphistegina lobifera, J. Eukaryot. Microbiol., 63, 786–793, https://doi.org/10.1111/jeu.12325, 2016.
Richirt, J., Riedel, B., Mouret, A., Schweizer, M., Langlet, D., Seitaj, D., Meysman, F. J. R., Slomp, C. P., and Jorissen, F. J.: Foraminiferal community response to seasonal anoxia in Lake Grevelingen (the Netherlands), Biogeosciences, 17, 1415–1435, https://doi.org/10.5194/bg-17-1415-2020, 2020.
Risgaard-Petersen, N., Langezaal, A. M., Ingvardsen, S., Schmid, M. C., Jetten, M. S., Op den Camp, H. J., Derksen, J. W., Pina-Ochoa, E., Eriksson, S. P., and Peter Nielsen, L.: Evidence for complete denitrification in a benthic foraminifer, Nature, 443, 93–96, https://doi.org/10.1038/nature05070, 2006.
Rognes, T., Flouri, T., Nichols, B., Quince, C., and Mahé, F.: VSEARCH: a versatile open source tool for metagenomics, PeerJ, 4, e2584, https://doi.org/10.7717/peerj.2584, 2016.
Romano, E., Bergamin, L., Di Bella, L., Frezza, V., Pierfranceschi, G., Marassich, A., and Provenzani, C.: Benthic foraminifera as environmental indicators in extreme environments: The marine cave of Bue Marino (Sardinia, Italy), Ecol. Indic., 120, 106977, https://doi.org/10.1016/j.ecolind.2020.106977, 2021.
Rush, G., McDarby, P., Edwards, R., Milker, Y., Garrett, E., and Gehrels, W. R.: Development of an intertidal foraminifera training set for the North Sea and an assessment of its application for Holocene sea-level reconstructions, Mar. Micropaleontol., 169, 102055, https://doi.org/10.1016/j.marmicro.2021.102055, 2021.
Sawai, Y., Horton, B. P., Kemp, A. C., Hawkes, A. D., Nagumo, T., and Nelson, A. R.: Relationships between diatoms and tidal environments in Oregon and Washington, USA, Diatom Res., 31, 17–38, https://doi.org/10.1080/0269249X.2015.1126359, 2016.
Schönfeld, J., Alve, E., Geslin, E., Jorissen, F., Korsun, S., and Spezzaferri, S.: The FOBIMO (FOraminiferal BIo-MOnitoring) initiative – Towards a standardised protocol for soft-bottom benthic foraminiferal monitoring studies, Mar. Micropaleontol., 94, 1–13, https://doi.org/10.1016/j.marmicro.2012.06.001, 2012.
Schweizer, M.: How long after death is DNA preserved in situ in intertidal foraminifera?, J. Micropalaeontol., 34, 217–219, https://doi.org/10.1144/jmpaleo2014-023, 2015.
Scott, D. and Medioli, F.: Vertical zonations of marsh foraminifera as accurate indicators of former sea-levels, Nature, 272, 528–531, https://doi.org/10.1038/272528a0, 1978.
Scott, D. B., Medioli, F. S., and Schafer, C. T.: Monitoring in coastal environments using foraminifera and thecamoebian indicators, Cambridge University Press, https://doi.org/10.1017/CBO9780511546020, 2007.
Singer, D., Fouet, M. P., Schweizer, M., Mouret, A., Quinchard, S., and Jorissen, F. J.: Unlocking foraminiferal genetic diversity on estuarine mudflats with eDNA metabarcoding, Sci Total. Environ., 902, 165983, https://doi.org/10.1016/j.scitotenv.2023.165983, 2023.
Smith, K. E., Terrano, J. F., Khan, N. S., Smith, C. G., and Pitchford, J. L.: Lateral shoreline erosion and shore-proximal sediment deposition on a coastal marsh from seasonal, storm and decadal measurements, Geomorphology, 389, 107829, https://doi.org/10.1016/j.geomorph.2021.107829, 2021.
Spear, S. F., Groves, J. D., Williams, L. A., and Waits, L. P.: Using environmental DNA methods to improve detectability in a hellbender (Cryptobranchus alleganiensis) monitoring program, Biol. Conserv., 183, 38–45, https://doi.org/10.1016/j.biocon.2014.11.016, 2015.
Spearman, C.: The proof and measurement of association between two things, Int. J. Epidemiol., 39, 1137–1150, https://doi.org/10.1093/ije/dyq191, 2010.
Strickler, K. M., Fremier, A. K., and Goldberg, C. S.: Quantifying effects of UV-B, temperature, and pH on eDNA degradation in aquatic microcosms, Biol. Conserv., 183, 85–92, https://doi.org/10.1016/j.biocon.2014.11.038, 2015.
Sun, Y., Xing, J., Zong, Y., and Hong, G.: Coastal responses and shoreline restoration after Holocene sea-level changes in Hong Kong, China, in: Hydraulic Engineering V, CRC Press, 115–120, https://doi.org/10.1201/9781351241571, 2017.
Tan, F., Khan, N. S., Li, T., Meltzner, A. J., Majewski, J., Chan, N., Chutcharavan, P. M., Cahill, N., Vacchi, M., and Peng, D.: Holocene relative sea-level histories of far-field islands in the mid-Pacific, Quaternary Sci. Rev., 310, 107995, https://doi.org/10.1016/j.quascirev.2023.107995, 2023.
Torti, A., Jørgensen, B. B., and Lever, M. A.: Preservation of microbial DNA in marine sediments: insights from extracellular DNA pools, Environ. Microbiol., 20, 4526–4542, https://doi.org/10.1111/1462-2920.14401, 2018.
Troth, C. R., Sweet, M. J., Nightingale, J., and Burian, A.: Seasonality, DNA degradation and spatial heterogeneity as drivers of eDNA detection dynamics, Sci. Total Environ., 768, 144466, https://doi.org/10.1016/j.scitotenv.2020.144466, 2021.
Urabe, H., Mizumoto, H., Tsuda-Yamaguchi, F., and Araki, H.: Spatial heterogeneity of eDNA concentration as a predictor of small biomass of fish in a mountain stream, Limnology, 26, 223–233, https://doi.org/10.1007/s10201-024-00772-7, 2025.
Walker, J. S., Cahill, N., Khan, N. S., Shaw, T. A., Barber, D., Miller, K. G., Kopp, R. E., and Horton, B. P.: Incorporating temporal and spatial variability of salt-marsh foraminifera into sea-level reconstructions, Mar. Geol., 429, 106293, https://doi.org/10.1016/j.margeo.2020.106293, 2020.
Wang, Y.-F., Feng, Y.-Y., Ma, X., and Gu, J.-D.: Seasonal dynamics of ammonia/ammonium-oxidizing prokaryotes in oxic and anoxic wetland sediments of subtropical coastal mangrove, Appl. Microbiol. Biotechnol., 97, 7919–7934, https://doi.org/10.1007/s00253-012-4510-5, 2013.
Welch, W. J.: Construction of permutation tests, J. Am. Stat. Assoc., 85, 693–698, https://doi.org/10.1080/01621459.1990.10474929, 1990.
Wood, S. A., Biessy, L., Latchford, J. L., Zaiko, A., von Ammon, U., Audrezet, F., Cristescu, M. E., and Pochon, X.: Release and degradation of environmental DNA and RNA in a marine system, Sci. Total Environ., 704, 135314, https://doi.org/10.1016/j.scitotenv.2019.135314, 2020.
Woodroffe, S. A., Horton, B. P., Larcombe, P., and Whittaker, J. E.: Intertidal mangrove foraminifera from the central Great Barrier Reef shelf, Australia: implications for sea-level reconstruction, J. Foramin. Res., 35, 259–270, https://doi.org/10.2113/35.3.259, 2005.
WWF: Mai Po Nature Reserve and the Ramsar Convention, WWF Hong Kong, https://www.wwf.org.hk/en/resources/publications/ (last access: 30 Septemeber 2025), 2020.
Xiong, H., Zong, Y., Qian, P., Huang, G., and Fu, S.: Holocene sea-level history of the northern coast of South China Sea, Quaternary Sci. Rev., 194, 12–26, https://doi.org/10.1016/j.quascirev.2018.06.022, 2018.
Youssef, M., El-Sorogy, A., Al-Kahtany, K., and Saleh, M.: Benthic foraminifera as bio-indicators of coastal marine environmental contamination in the Red Sea-Gulf of Aqaba, Saudi Arabia, B. Environ. Contam. Tox., 106, 1033–1043, https://doi.org/10.1007/s00128-021-03192-w, 2021.
Yu, H. K. Y., Khan, N. S., Desianti, N., Garrett, E., Planavsky, N. J., and Ahmed, A.: The utility of mangrove foraminifera, diatoms, and stable carbon isotope and geochemistry in relative sea-level reconstruction in the Pearl River Delta, China, Mar. Geol., 488, 107610, https://doi.org/10.1016/j.margeo.2025.107610, 2025.
Yu, S., Luo, Y., Wu, C., and Xu, W.: Subseasonal variations of convective and microphysical characteristics of extreme precipitation over the Pearl River Delta at monsoon coast, J. Geophys. Res.-Atmos., 128, e2022JD037804, https://doi.org/10.1029/2022JD037804, 2023.
Zhang, J., Kobert, K., Flouri, T., and Stamatakis, A.: PEAR: a fast and accurate Illumina Paired-End reAd mergeR, Bioinformatics, 30, 614–620, https://doi.org/10.1093/bioinformatics/btt593, 2014.