the Creative Commons Attribution 4.0 License.
the Creative Commons Attribution 4.0 License.
 | 12 Sep 2024
Late Pliocene to recent depositional processes on the Sabrina Coast (East Antarctica): the diatom contribution
Raffaella Tolotti
Amy Leventer
Federica Donda
Leanne Armand
Taryn Noble
Phil O'Brien
Xiang Zhao
David Heslop
Alix Post
Roberto Romeo
Andrea Caburlotto
Diego Cotterle
Nicola Corradi
By examining the sedimentary records from two new cores collected from the Sabrina Coast slope, we have developed an age model spanning from the late Pliocene to the present. From multiproxy sediment analyses of the piston and kasten core, PC03, and KC03, collected during the IN2017_V01 survey on the Sabrina Coast (East Antarctica) offshore the Totten Glacier, we here present the outcomes derived within the seismostratigraphic record coupled with the sedimentological, geochemical paleomagnetic, and biostratigraphic contexts. Our results highlight that the area has been affected by recurrent sediment slides facilitated by siliceous deposits, both biogenic and from an unprecedented tephra layer, during some of the major paleoclimatological events of the late Pliocene. Diatoms contributed not only to the biostratigraphic and depositional environmental definition but also to the instability of the slope, together with the tephra layer, as documented offshore the Sabrina–Aurora Basin for the first time.
- Article
(10991 KB) - Full-text XML
-
Supplement
(1089 KB) - BibTeX
- EndNote


-
Mid–late Pliocene–present sedimentary record of the Sabrina Coast continental rise offshore Totten Glacier.
-
First observed late Pliocene tephra layer in the region.
-
Plio-Pleistocene diatom biostratigraphy and evolutionary turnover.
-
Diatoms and siliciclastic particles as potential tools to decipher Antarctic continental margin instabilities.
Marine sediment cores from the Antarctic continental margin provide a history of Cenozoic climate change, with records documenting changes in ice sheet stability, sea ice extent, and oceanographic productivity (Grützner et al., 2005; Rebesco and Camerlenghi, 2008; Massom and Stammerjohn, 2010; Rebesco et al., 2002, 2014; Amblas et al., 2017; Amblas and Dowdeswell, 2018; McKay et al., 2022). The Sabrina Coast (East Antarctica) is a key region to understanding how the cryosphere changed in response to climate warming. It lies seaward of the Sabrina and Aurora subglacial basins, with the latter being the second-largest Antarctic subglacial basin and susceptible to marine ice sheet instability (Larter et al., 2016; Salabarnada, 2018; Morlighem et al., 2020; Pelle et al., 2020). The Sabrina Coast hosts the Totten Glacier, whose evolution since its formation about 40 Myr ago is recorded in offshore sediments (Gulick et al., 2017; Donda et al., 2023; Aitken et al., 2023; Mohajerani et al., 2018). Thinning and melting rates of the Totten Glacier are currently among the fastest in the East Antarctic Ice Sheet (Greenbaum et al., 2015; Khazendar et al., 2013; Li et al., 2015; Shen et al., 2018). Melting is enhanced by the intrusion of relatively warm modified Circumpolar Deep Water onto the continental shelf, with the morpho-bathymetry playing a key role in steering warm water from the shelf break toward the ice shelf cavities, causing rapid basal ice melting (Rintoul et al., 2016; Silvano et al., 2016, 2017, 2018; Nitsche et al., 2017; Greene et al., 2017; Hirano et al., 2021; Bensi et al., 2022; Hirano et al., 2023). Given that the Totten Glacier holds a sea level equivalent of 3.9 m (Rignot et al., 2019), understanding the longer-term history of this part of the Antarctic margin thus may provide insight into the sensitivity of the ice sheet to climate warming and oceanographic change.
Previously published work from the Sabrina Coast continental shelf (Gulick et al., 2017; Fernandez et al., 2018; Montelli et al., 2020), slope and rise (Donda et al., 2008, 2020, 2023; O'Brien et al., 2020, 2022; Nitsche et al., 2017; Holder et al., 2020) helped unveil the glacial evolution of this sector of the continental margin, since the early emplacement of the East Antarctic Ice Sheet (EAIS), at different scales of resolution. Geophysical data revealed that both downslope and along-slope processes shaped the overall continental slope and rise architecture (Donda et al., 2020; O'Brien et al., 2020) and that the main sediment depocenter, where the glacial-related sequences are up to 4000 m thick, occurs seaward of the present-day location of the Totten Glacier (Donda et al., 2023). Higher-resolution records were obtained on marine sediment cores. Gulick et al. (2017) used cores sited on the continental shelf to describe the history of the cryosphere, with sediment records from the late Paleocene–Eocene and the Late Miocene–early Pliocene. Holder et al. (2020) present a more recent paleoceanographic record from the continental slope that describes glacial–interglacial variability in sedimentation from the Mid-Pleistocene to the Holocene. Sadatzki et al. (2023) reconstructed the sea ice variability off East Antarctica during the past 40 ka through a molecular biomarker-based sea ice record from piston core PC08 collected during the IN2017_V01 survey.
Historical magnetostratigraphic data, available since the 1957/1958 International Geophysical Year (IGY), have been used to investigate the magnetic crustal properties of the Antarctic continental margin, resulting in the compilation of a terrestrial/marine magnetic map, defining the tectonic evolution of the Antarctic craton, and characterizing the sub-ice geology and glacial history. These datasets are useful for stratigraphic correlations and geochronology (Heslop and Roberts, 2016; Egli et al., 2013; Golynsky et al., 2013; Macrì et al., 2005; Guyodo et al., 2001).
The piston core analyzed in this study presents a record that goes back to the Pliocene. We adopted a multidisciplinary approach to reconstruct the biostratigraphic and paleoenvironmental record of the Sabrina Coast continental slope and rise in front of the Totten Glacier, based on multiproxy data from a paired piston and kasten core collected during the IN2017_V01 survey on the eastern flank of a prominent sediment ridge, i.e., the Minang-a Ridge (Fig. 1), located on the upper continental rise (Armand et al., 2018; O'Brien et al., 2020). High-resolution geophysical data highlight the occurrence of recurrent gravity-driven processes within the sedimentary sequence, which made the interpretation of the sedimentary facies and the assignment of the chronology, based on a combination of diatom biostratigraphy, magnetostratigraphy, and radiocarbon data, particularly challenging. Diatom data, grain size analyses, and X-ray fluorescence (XRF) data are used to evaluate Pliocene–Pleistocene paleoceanographic history. Our aim is to provide a reconstruction of the late Neogene depositional environment of this key sector of Antarctic margin, thereby providing a step forward in the understanding of the distal response of areas particularly vulnerable to climate change.
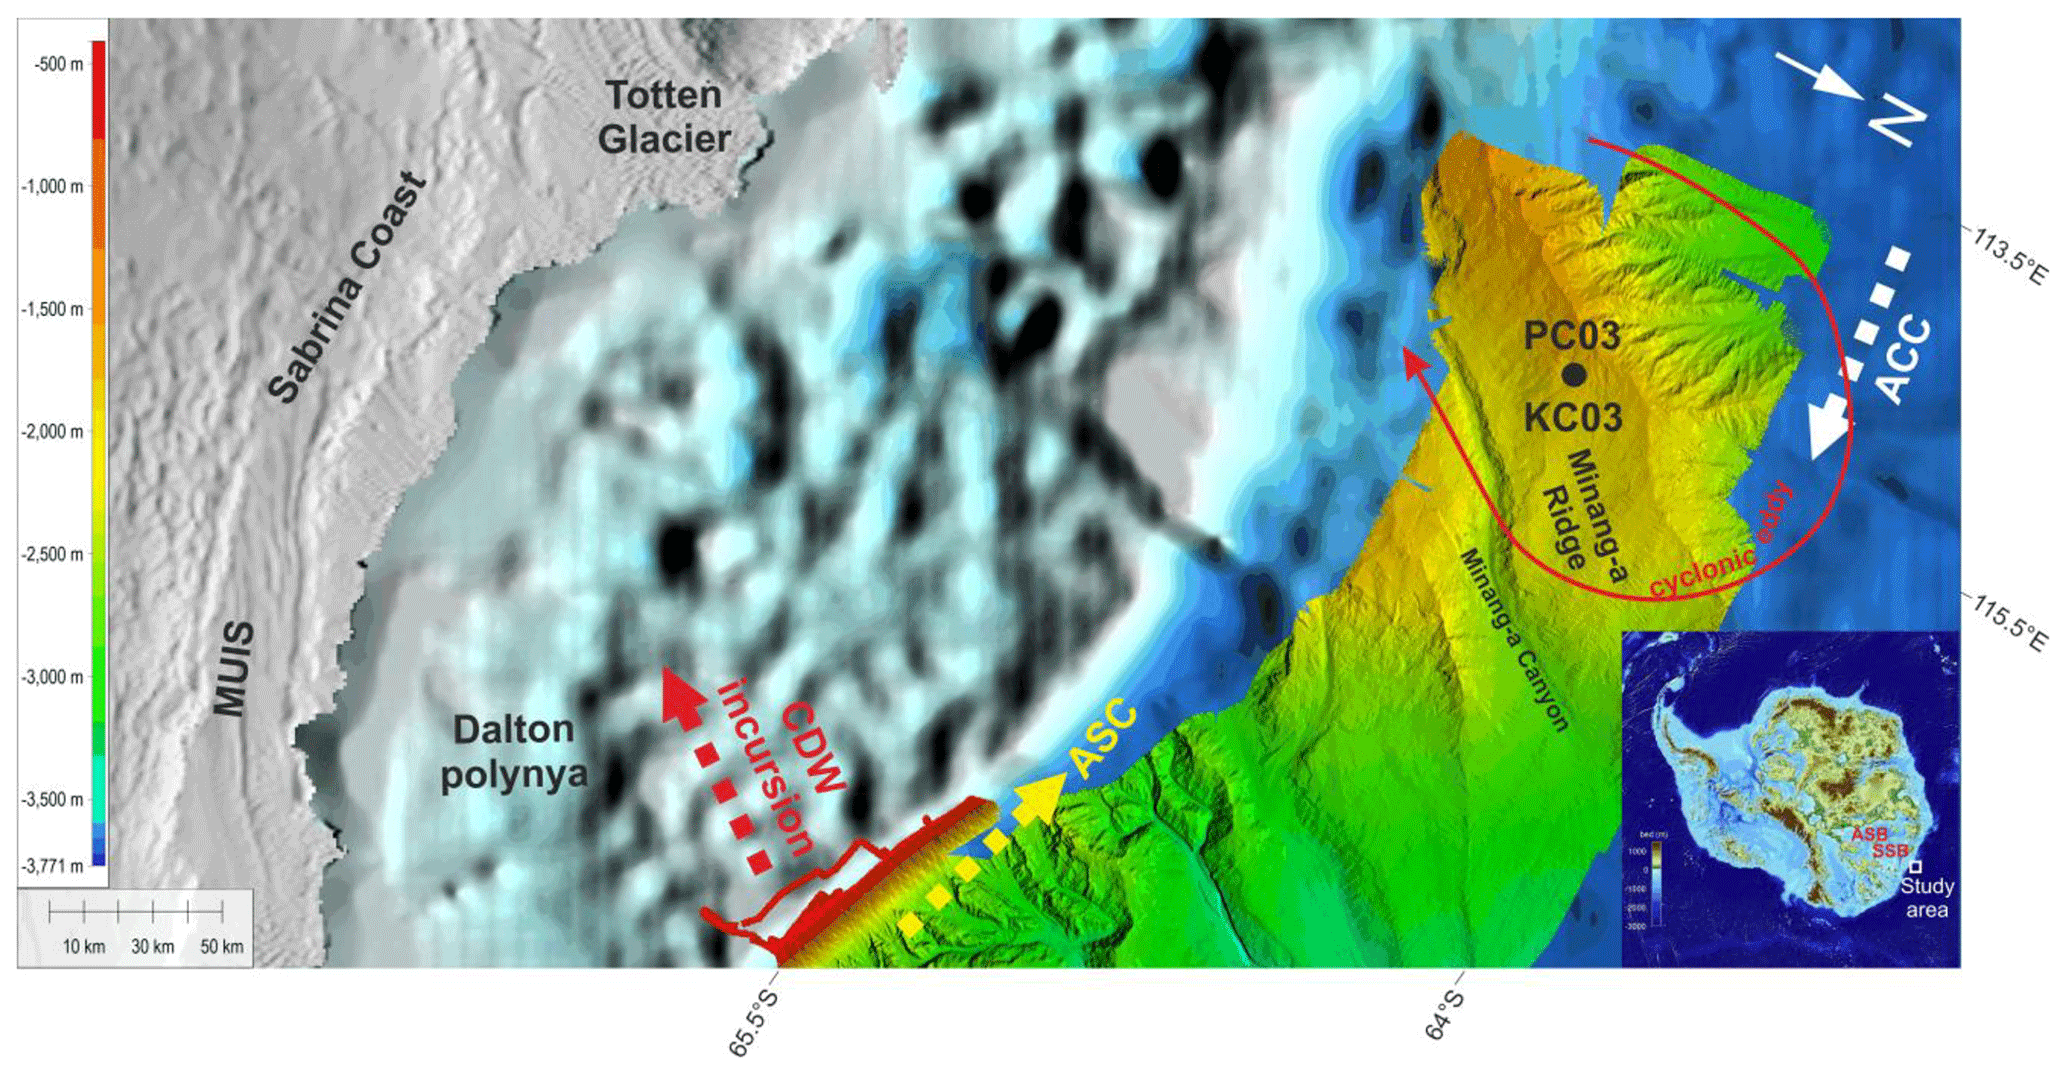
Figure 1Location of the sediment cores. Subglacial bed elevation derived from Bedmap2 grids (Fretwell et al., 2013). ASB is for the Aurora Subglacial Basin (after Young et al., 2011). SSB is for the Sabrina Subglacial Basin (after Aitken et al., 2016). MUIS is for the Moscow University Ice Shelf. The terrestrial terrain map is from the Reference Elevation Model of Antarctica (REMA; Howat et al., 2019). ACC is for the Antarctic Circumpolar Current. ASC is for the Antarctic Slope Current. The cyclonic eddy location is shown, following Hirano et al. (2021).
The study area is located seaward of an extensive subglacial basin, the Aurora–Sabrina subglacial basins (ASB and SSB; Fig. 1), which drain the Moscow University Ice Shelf (MUIS) and the Totten Glacier, which is one of the primary outlets of the EAIS and a major ice discharge of East Antarctica. Recent subglacial bed topography and ice mass balance studies of this area showed how erosional troughs connect the Sabrina Subglacial Basin to the Aurora Subglacial Basin and to subglacial basins further inland (for example, the inner Vincennes Subglacial Basin) (Young et al., 2011; Aitken et al., 2016; Shen et al., 2018). At the coast, the Sabrina Subglacial Basin includes deep and narrow troughs beneath the floating parts of the Totten Glacier tongue and the Moscow University Ice Shelf (Fig. 1). The seaward edge of the continent presents ice shelves, floating glaciers, and grounded iceberg tongues. Bathymetry and ocean dynamics affect sea ice movement, producing a series of persistent polynya regions and zones of heavy ice concentration, even in summer, west of 118° E (Williams et al., 2011; Greene et al., 2017; Silvano et al., 2016, 2018; Orsi and Webb, 2022).
Geophysical, sedimentological, and biostratigraphic data collected on the Sabrina Coast continental shelf by the 2014 US marine survey on board research vessel (R/V) N. B. Palmer suggest a complex ASB history of glacial expansion since the middle Eocene and cyclical advances and retreats of the EAIS during subsequent paleoclimatic phases, which produced three distinct sedimentary packages (Megasequences (MS)-I, MS-II, and MS-III) (Gulick et al., 2017; Fernandez et al., 2018; Montelli et al., 2020; Duffy et al., 2022).
The continental slope and rise located between ca. 112 and 122° E have been investigated by several geological and geophysical surveys since the 1980s. During the most recent IN2017_V01 cruise, oceanography and morpho-bathymetry data, as well as some new sediment cores, described in this study, were collected (Armand et al., 2018; O'Brien et al., 2020). A first regional seismostratigraphic assessment of the study area was summarized by Donda et al. (2007) and Close et al. (2007), who identified a major depocenter, the Budd Coast basin (BCB), offshore the Totten Glacier, containing more than 10 km of sediment deposited at very high-sedimentation rates and associated with polythermal glacial expansion. Further analyses on multichannel seismic profiles collected on the Sabrina Coast slope and rise area highlighted the complex and asymmetric evolution of this area since the emplacement of the EAIS, which is associated with the interplay of turbiditic and contouritic processes (Donda et al., 2020; O'Brien et al., 2020; Donda et al., 2023), especially between 114 and 116° E, where up to 4000 m thick glacial-related sequences occur (Donda et al., 2023). The present-day continental slope and rise character, with prominent canyons in the eastern area, sediment ridges, and low-sinuosity canyons to the west, appears to be inherited from older morphologies linked to the activity and sediment transport from ancient polythermal glaciers (O'Brien et al., 2020). In the eastern part of the study area, highly energetic, mostly downslope, processes were predominant, and thinner sedimentary sequences deposited, except in the western levees of the main canyons, where significant sediment accumulation have been observed (up to ca. 850 m, Donda et al., 2023). Holder et al. (2020), based on sedimentary records of further sediment cores collected during the IN2017_V01 cruise, identified the movement of grounded ice across the shelf and the extent of sea ice coverage as the primary processes controlling sedimentation on the continental slope, which have been active during the high-amplitude glacial cycles since the Mid-Pleistocene Transition (MPT).
The study area lies within the seasonal sea ice zone (SIZ), with floating glacial ice and a recurring latent-heat polynya, the Dalton Polynya (Fig. 1), in the lee of the Dalton Iceberg Tongue (Roberts et al., 2011; Young et al., 2011; Fraser et al., 2012; Massom et al., 2013; Post et al., 2017). Despite high estimated sea ice production at Dalton Polynya, about 2.5 times higher than at Mertz Polynya off the Adélie Coast, no dense shelf water production is occurring today (Silvano et al., 2018; Bensi et al., 2022). The shelf break and upper continental slope areas are characterized by the occurrence of the Antarctic Slope Front (ASF; Jacobs, 1991; Whitworth et al., 1998) that corresponds to the boundary between the cold and fresh Antarctic Surface Water (AASW) and the poleward edges of relatively warm and saline Circumpolar Deep Water (CDW). The denser CDW is “modified” (cooled and freshened) as it moves southwards and intrudes across the continental shelf break. It is referred to as mCDW and intrudes through bathymetric depressions onto the shelf (Williams et al., 2016; Silvano et al., 2018; Greene et al., 2017; Bensi et al., 2022). The AASW, due to the sea ice melting and wind mixing, varies seasonally, while a broad westward flow, the Antarctic Slope Current (ASC), linked to a horizontal density gradient across the ASF, occurs together with the Antarctic Coastal Current (ACoC) (Williams et al., 2011; Peña-Molino et al., 2016; Liu et al., 2017; Thompson et al., 2018). Along the upper continental slope (between 750 and 1250 m water depth), the westward-flowing ASC forms the boundary between CDW and AASW, while along the lower slope and rise, a westward-flowing bottom current comprising Antarctic Bottom Water (AABW) originating from Adélie Land is also present (Rintoul, 1985). The exchange of heat across the continental shelf is different between the western and eastern sectors, due to the shallower morphology of the seabed in the western sector than the east, while the strength and the dynamics among the over cited water masses cause periodic intrusions of mCDW onto the Sabrina Coast continental shelf. This heat transport to the Antarctic coastal domain also brings nutrients that support the regional marine ecosystem (Wakatsuchi et al., 1994; Smethie and Jacobs, 2005; Close et al., 2009; Hayakawa et al., 2012; Greene et al., 2017; Nitsche et al., 2018; Bensi et al., 2022).
3.1 Core recovery, sampling, physical sedimentological parameters, and chronologic work
The Australian-led scientific mission (IN2017_V01) on R/V Investigator took place between January and March 2017. The survey collected bathymetric, oceanographic, and high-resolution geophysical data, together with kasten and piston cores, to understand the interactions of the Totten Glacier with the Southern Ocean over multiple glacial cycles (Armand et al., 2018). The 13.21 m PC03 piston core was recovered from near the crest of the prominent Minang-a Ridge, on the western side of Minang-a Canyon (Fig. 1), at a water depth of 1864 m (64.463° S, 115.044° E). KC03 is a closely located kasten core (64.463° S 115.043° E; 1862 m water depth; 2.44 m core length).
Samples for grain size analysis were taken at 10 cm depth intervals. Aliquots of wet sample were pipetted for grain size analysis of the 0–2 mm size fraction using a calibrated Malvern dispersion unit and a Malvern Mastersizer 2000 laser particle sizer at Geoscience Australia. Chemical treatment for the removal of biogenic silica was not undertaken (e.g., McCave and Andrews, 2019; Ha et al., 2022). Results are presented as a volume-weighted percentage of particles in the sample. Samples were subjected to identical treatment to ensure that the silt : clay ratios were not affected by disaggregation artifacts (e.g., Xiaoling et al., 2017). Duplicates were run at 1 m intervals to ensure consistency in measured grain size, and each sample was analyzed three times to determine measurement variance (<0.4 % across clay, silt, and sand fractions). Glass bead standards were run every 50–100 analyses for instrument calibration. Grain size data are archived with the Australian Government http://dbforms.ga.gov.au/pls/www/npm.mars.search (last access: 30 August 2024). These data were pooled to determine changes in the silt, clay, sand, and gravel fractions downcore, and statistical parameters were calculated using both GRADISTAT (Blott and Pye, 2001) and QGrain (Yuming et al., 2021). In addition, the geometric mean of the 10–63 µm size fraction (SS is for sortable silt; McCave and Hall, 2006, 2017) was calculated for each sample and correlated with the percentage of sortable silt (SS %) in the total mud fraction to determine if the sediments were current-sorted, according to McCave et al. (2006, 2014) and McCave and Andrews (2019).
The mean sortable silt grain size () for PC03 was plotted and compared to the other logs. Br was also included as it can be used as a proxy for organic matter. The values correlate well with the SS % ones (0.58–0.78) so this parameter was considered useful for current speed estimates (Fig. S1 in the Supplement). The higher and lower values were analyzed, as well as the major changes, as abrupt changes in these data are considered to record major sedimentary events. Following McCave and Hall (2006) these values were translated in changes in current speed (1 µm change represents 2–3 cm s−1 change in current speed).
The glass grains (characterized by gas vacuoles and stretching features typical of tephra and microtephra grains; Plate 1; figs. 23 and 24) were counted during the microscope analyses for diatoms, and their content was expressed in number of grains per gram of dry sediment (no. grains/g dry sed).
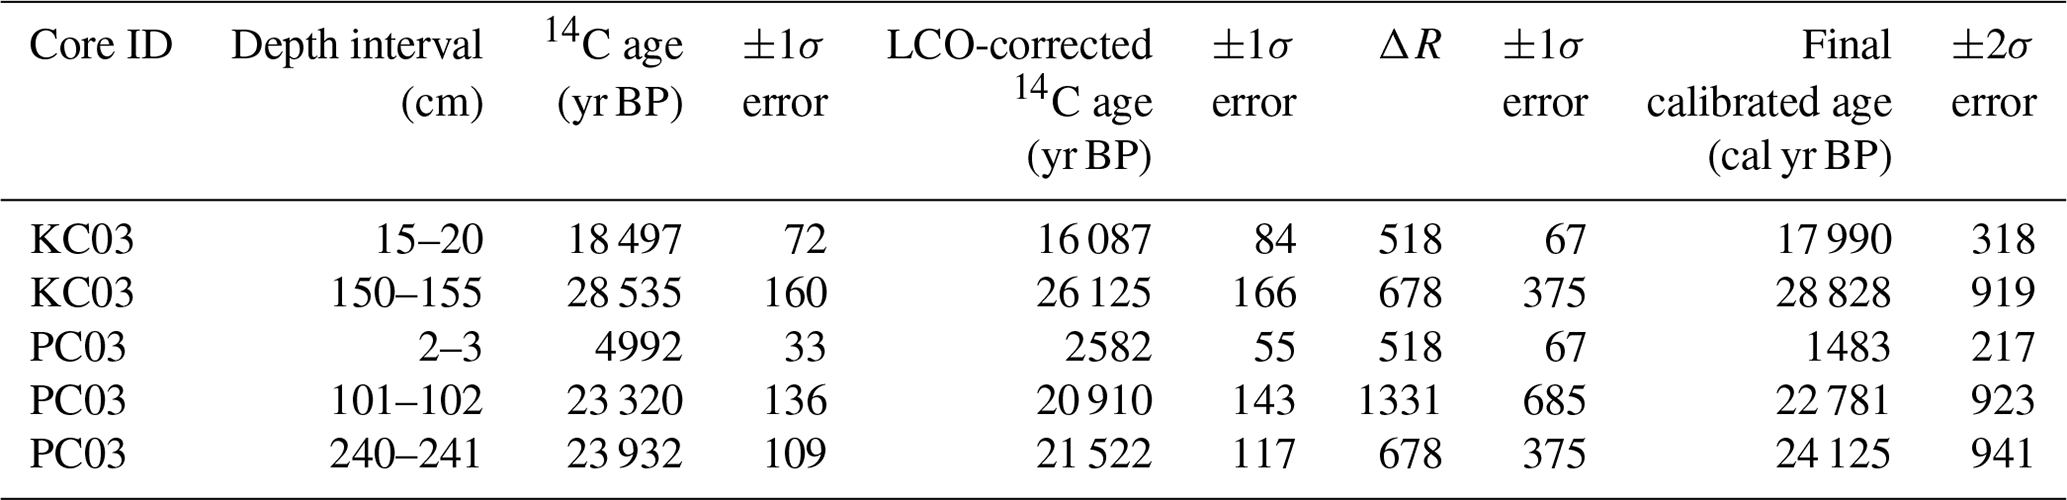
For the radiocarbon dataset, the acid-insoluble organic matter (AIOM) fraction of sediment samples from KC03 (n=2) and PC03 (n=3) was radiocarbon-dated by DirectAMS (USA) on an accelerator mass spectrometer. Each sediment sample was dried at 60 °C, ground to a fine powder, and submerged in 2M HCl on a HotBlock® at 80 °C for several hours for the removal of carbonates. The primary radiocarbon ages were first corrected for the local contamination offset (LCO), defined as the age offset produced from the input of old ancient continental carbon to the continental rise. The LCO (2410 ± 44) was calculated using the difference between the surface AIOM radiocarbon age of the proximal multicore MC01 (3335 ± 32; Creac'h et al., 2023) and a modern regional marine reservoir age (MRA) of 925 ± 30 years (Holder et al., 2020). Each LCO-corrected radiocarbon age was calibrated using the Marine20 calibration curve (Heaton et al., 2020) in MatCal 2.41 (Lougheed and Obrochta, 2016). A ΔR of 518 ± 67 years was calculated for Holocene ages using the difference between the modern regional MRA (925 ± 30 years) and the global mean MRA at 0 cal yr BP (Heaton et al., 2020). The temporal variation in ΔR values is significant at polar latitudes and was incorporated into the radiocarbon age calibration process by employing the time-varying MRA estimates for the Southern Ocean, as compiled by Skinner et al. (2019).
3.2 Geochemical analyses
The PC03 core was scanned at the Australian National University using the Avaatech core scanner located at the Research School of Earth Sciences. Core sections were covered with 4 mm thick Ultralene® film and run in three sessions at a 100 mm resolution for 10 kV and 500 µA current (no filter), 30 kV and 500 µA current (Pd thin filter), and 50 kV with 1000 µA current (Cu filter). The XRF core scan data were cleaned by excluding data for which the total counts per second were below 80 000 cps for 10 kV, 150 000 cps for 30 kV, and 360 000 cps for 50 kV. The KC03 core was scanned at Cox Analytical Systems' ITRAX Core Scanner at the Australian Nuclear Sciences and Technology Organisation, Sydney, Australia. XRF measurements were made with a Cr–He tube at 30 kV and 55 mA for the semi-quantification of elemental abundances. Data with an intensity lower than 35 000 kcps (kilo counts per second) were removed.
3.3 Diatom analyses
Diatom biostratigraphic and quantitative analyses were conducted in accordance with the international stratigraphic guide. Analyses were performed every 20 cm in PC03 and at least every 10 cm in KC03. Methods for sample preparation, diatom species identification, and counting were those described in Schrader and Gersonde (1978), Barde (1981; modified), Bodén (1991), and Warnock and Scherer (2015; for KC03). For the PC03 piston core samples, hydrochloric acid (HCl 37 %), hydrogen peroxide (H2O2 at 130 vols; first at room temperature and then heated to about 60 °C), and sodium pyrophosphate (to disaggregate the sediment) were added to a known weight of dry sediment to dissolve carbonate, decompose organic matter, and disperse the clay fraction. Diatom analysis was performed with an immersion 1000× LM Reichert–Jung Polyvar microscope (Vienna, Austria). For diatom assemblage analyses, at least 300 diatom valves were counted per slide following the counting methodology presented in Schrader and Gersonde (1978). The absolute diatom valve concentration and ADA (absolute diatom abundance) were then calculated, following Abrantes et al. (2005) and Taylor-Silva and Riesselmann (2018), and expressed as the number of valves per gram of dry sediment (vpgds). When the diatom concentration was too low or too concentrated, slides with modified concentrations were prepared to optimize counting and identification while at least 100 fields of view were analyzed. For sections of PC03 core that had a very low-diatom content and/or were suspected to have been strongly reworked, age-diagnostic taxa were identified and grouped into different “age clusters”, termed “age groups”, namely the Eocene–Oligocene group, late Oligocene–Miocene group, late Pliocene Group, and modern assemblage. Then, a quantitative evaluation of each age group was determined by applying the same ADA algorithm to each group.
For the KC03 samples, the settling method of Warnock and Scherer (2015) was followed to make slides. Whenever possible, >400 diatom valves were counted per slide; when the diatom abundance proved too low, a total of 10 transects was counted. Modern diatom species were grouped by the previously established ecological indicator assemblages for open-ocean, sea ice, and reworked forms, as defined by Armand et al. (2005) and Crosta et al. (2005) and as discussed for the Sabrina slope by Holder et al. (2020).
Diatom data for PC03 and KC03 are archived with the Australian Antarctic Data Centre and can be accessed at https://doi.org/10.26179/3f8v-tq32 (PC03; Tolotti and Leventer, 2022) and https://doi.org/10.26179/5cad45a7cb140 (KC03; Leventer, 2022).
3.4 Cluster analysis procedures
Several mathematical analysis procedures (such as cluster and correlation matrix analyses) were applied on all the datasets. Here a selected complete cluster analysis (CCA), with a Bray–Curtis dissimilarity calculation and a hierarchical clustering (Ward method), was applied to each dataset for both cores; this was done using the free R software environment (R Core Team, 2021; cluster package v2.1.3). For the data correlation processes, the R Stats Package (v3.6.2; method Pearson) was used. Due to the differences in the depth sample for each type of sample analysis, the datasets were analyzed separately. The diatom and grain size data are presented.
3.5 Paleomagnetic analyses
Vertically oriented cube samples (8 cm3) were taken approximately every 2 cm (less than 2 cm at some edges of the core sections). A total of 635 samples was measured using a 2G Enterprises model 760R-4K superconducting rock magnetometer with an in-line automated alternating field (AF) demagnetizer at the Australian National University (ANU). The initial natural remanent magnetizations (NRMs) were measured, and gradually, AF was demagnetized with a peak field following 50 logarithm steps from 2 to 170 mT. The magnetic susceptibility at a frequency of 976 Hz was measured for the same sample set with an AGICO MFK2 Kappabridge at ANU (data are available in Table S1 Magnetic_susceptivity.xlsx and Table S2 Inclination_results.xls that are inserted in the SupMat.zip). The anisotropy of magnetic susceptibility (AMS) was also measured with the AGICO MFK2 Kappabridge for every second sample (Fig. S5). The characteristic remanent magnetization (ChRM) directions and their uncertainties were estimated using the principal component analysis (PCA) methods of Kirschvink (1980) and Khokhlov and Hulot (2016).
To identify the potential carriers of the paleomagnetic signal, anhysteretic remanent magnetization (ARM) acquisition was performed on each sample using a 170 mT AF with a biasing field of 0.05 mT. The acquired ARMs were demagnetized with a stepwise AF to assess the coercivity distribution of the magnetic mineral assemblage (Egli, 2004), and the corresponding ARM median destructive field (MDF) was estimated for each sample.
3.6 Sub-bottom profiler data
Sub-bottom profile data were acquired with a Kongsberg SPB 120 using a sweep of 2.5–6.5 kHz.
The pulse length was 6 ms. In the survey areas, the system operated in single-ping mode but with a burst during transit in deep water. A gain of 6 dB was applied to the data, followed by gain correction, matched filter, instant amplitude processing, and a time variable gain to enhance sub-bottom reflections. The sub-bottom profiler (SPB) data were recorded as two-way time sections and as SEG-Y (Society of Exploration Geophysicists Y format) and Kongsberg proprietary “.raw” files (Armand et al., 2018; O'Brien et al., 2020).
4.1 Stratigraphy and lithostratigraphic facies
4.1.1 PC03
Core PC03 is composed of mostly muds, with some sandy muds with roughly equal amounts of silt and clay with sand varying between 0 % and 34 % (Figs. 2 and 3; Figs. S1 and S2). The number of samples with sand >10 % is higher than other cores from this area (Holder et al., 2020), with sandier horizons present in several intervals. A distinctive feature of the core, highlighted during microscopic analyses, is the presence of silt to fine-sand-sized volcanic glass fragments dispersed through other facies (Plate 1; figs. 23 and 24).
The main lithostratigraphic facies are as follows (Fig. 2):
-
Facies A has massive muds from mottled grey and green–grey to olive brown, which vary in texture from silty clay to clayey silt. Some intervals display scattered sand grains, and sharp bedding contacts are present in places (Facies B).
-
Facies B has thinly bedded grey to dark grey silt with sand lamina in some places.
-
Facies C has thin graded muddy sand beds.
-
Facies D has massive green–grey silty clay with rounded clasts of sandy diamicts.
Ice-rafted detritus is present as patches with higher sand content and scattered pebbles, but there are no gravel layers, while the volcanic glass fragments are present in Facies C and D.
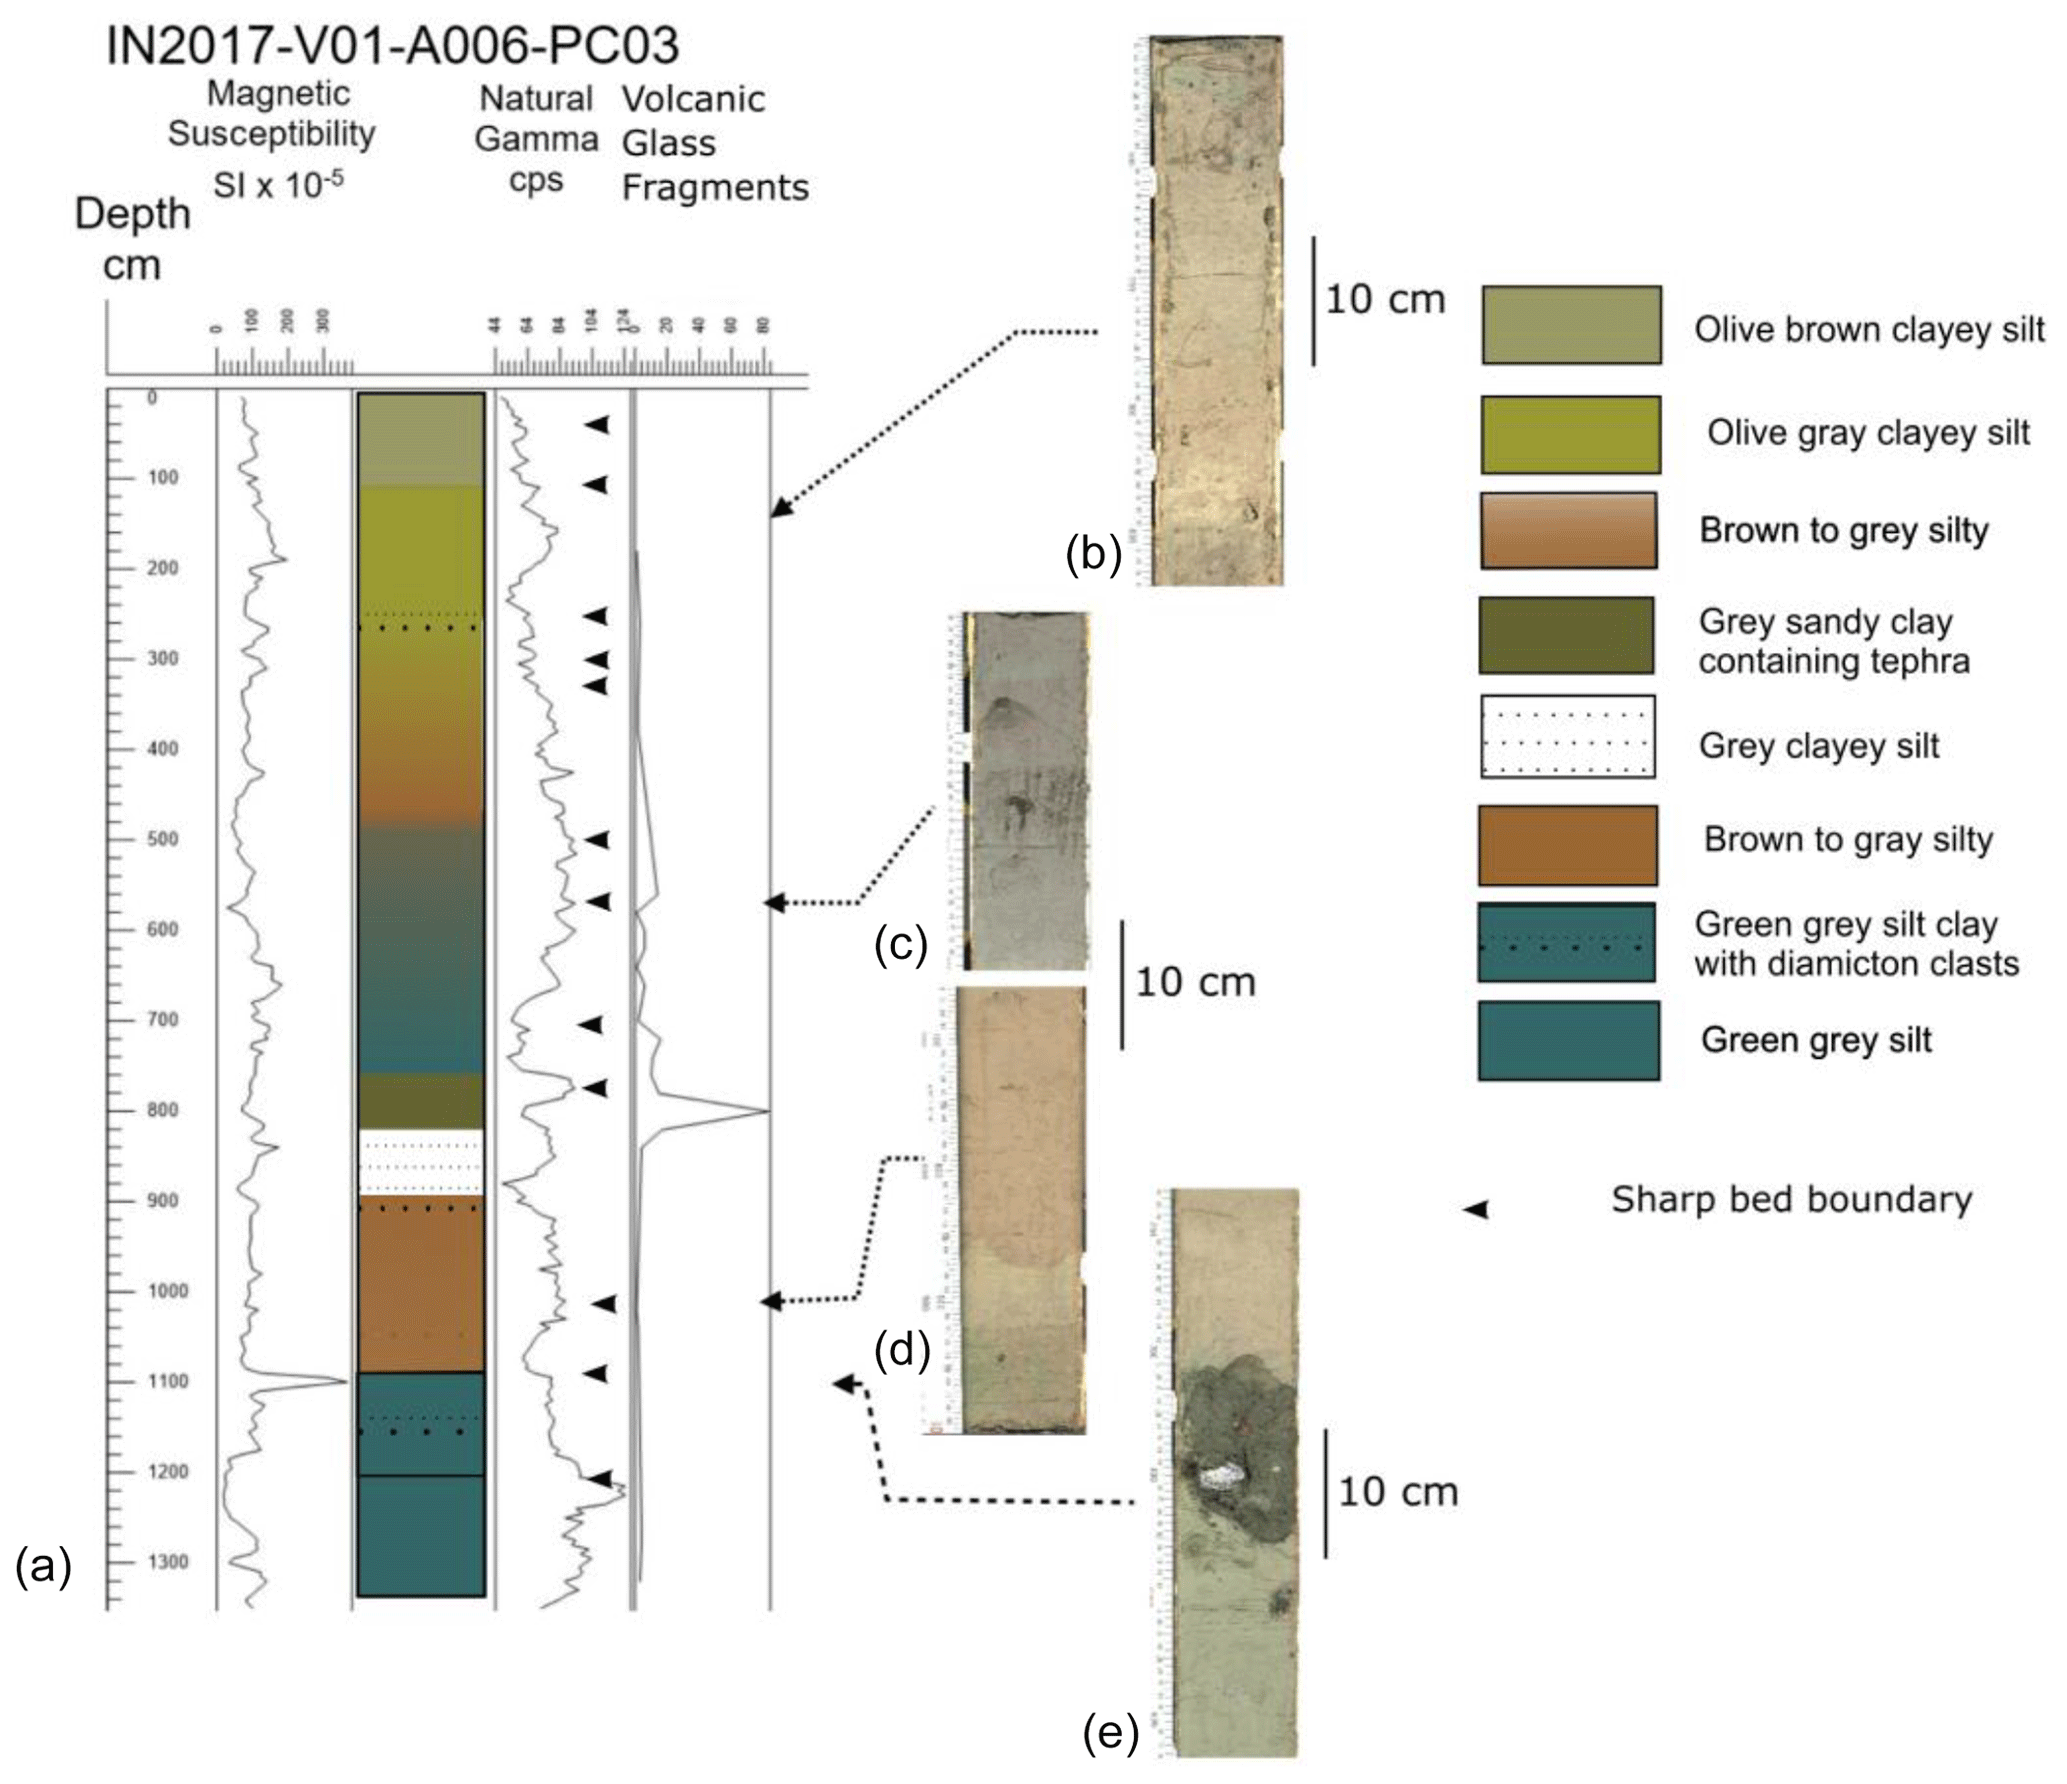
Figure 2(a) Summary log of PC03 with magnetic susceptibility, lithology of natural gamma, volcanic clasts, and main facies. Main sharp boundaries are highlighted. (b) Facies A. (c) Facies B. (d) Facies A and C. (e) Facies D overlain by Facies A.
Grain size, facies assemblages, and sortable silt datasets are used to subdivide the core into three main sections (Figs. 3 and 4).
PC03 basal section – 1321 to 901 cm
The basal section is defined based on the grain size analysis and microfossil/volcanic glass content. Its basal part is primarily a dark grey massive clay with cyclic, silty layers up to a few centimeters thick. Grain size data highlight average clay values of about 60 % (median value of 61.5), average silt values of 33 % (median value of 23.7), and average values of sand of 6 % (median value of 7.0), producing mostly fine-skewed distributions with only a few samples with high fine- to medium-sand content. Massive green–grey silty clay muds, sometime mottled, are observed from 1090 to 1200 cm. Some sharp lower-bed boundaries are visually evident and marked by increased silt (Figs. 3 and 4) at 1297, 1142, 1085, 1028, and 900 cm, suggesting some erosional boundaries or disturbances that may indicate the presence of sliding material events in the core sedimentation (Figs. 2, 3, and 4). The most evident discontinuities are marked.
values vary from a maximum of 26.02 to a minimum of 15.03 (Fig. S1). The correlation among and SS % is high (R0=0.768), suggesting current sorting during deposition and/or erosional events (McCave and Andrews, 2019). Such a range of indicates a range of current velocity change between 20 and 30 cm s−1 (McCave and Hall, 2006).
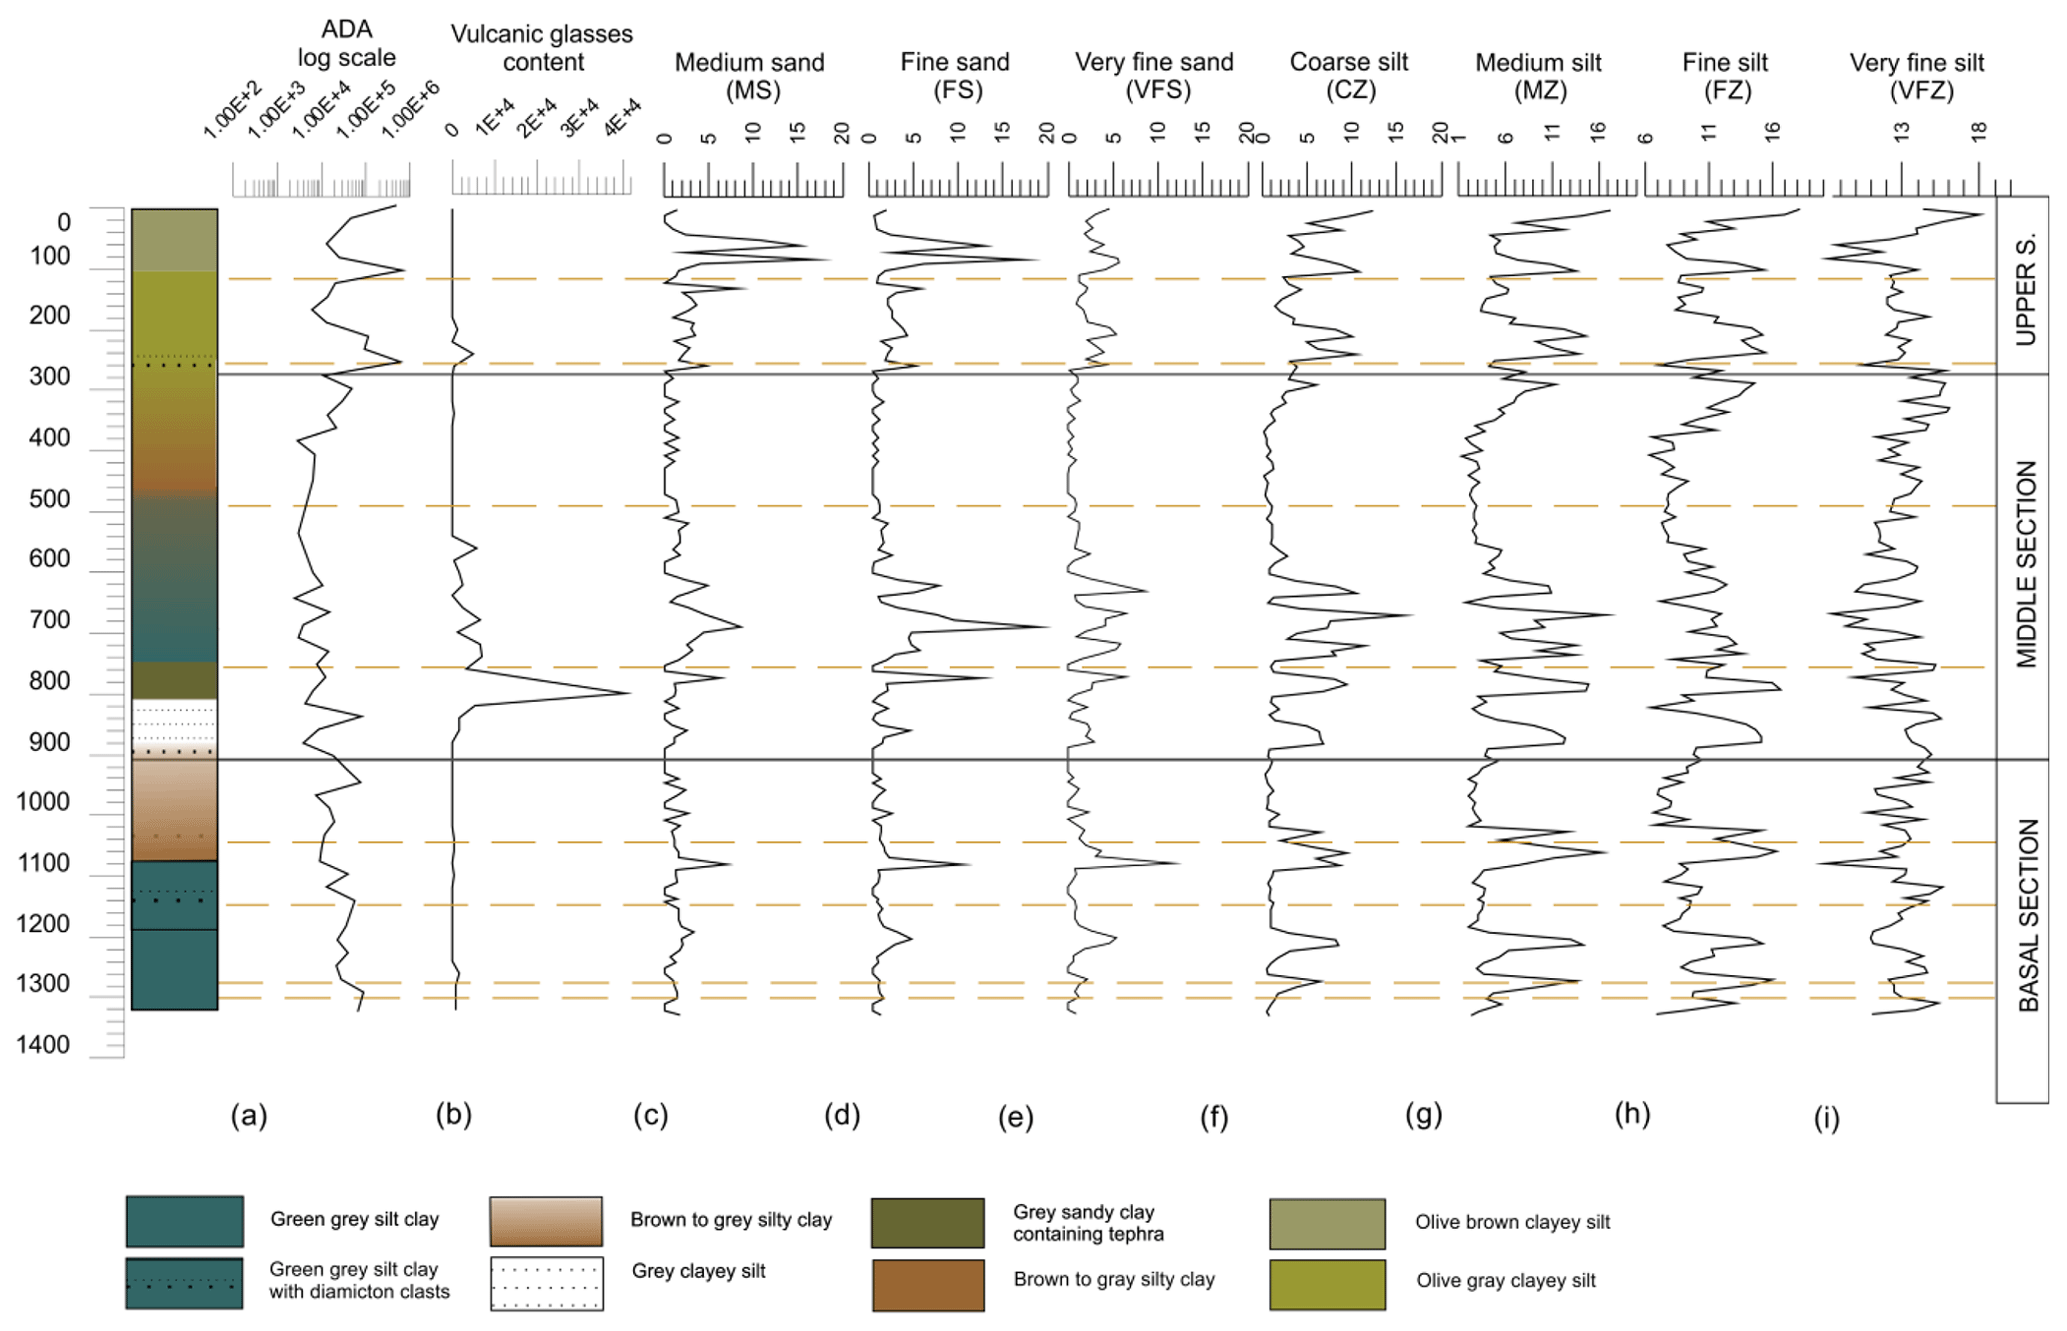
Figure 3Logs of main grain size fractions for IN2017-V01-A006-PC03 compared to lithology. (a) Absolute diatom valve concentration (ADA) expressed in log scale. (b) Volcanic glass content (tephra). (c) Sand, where MS is for medium sand, (d) FS is for fine sand, and (e) VFS is for very fine sand. Silt, where (f) CZ is for coarse silt, (g) MZ is for medium silt, (h) FZ is for fine silt, and (i) VFZ is for very fine silt. The clay and silt fractions prevail downcore on the sand one, present in its medium–fine component. The dotted lines identify some of the major disturbances/changes noted in sedimentation.
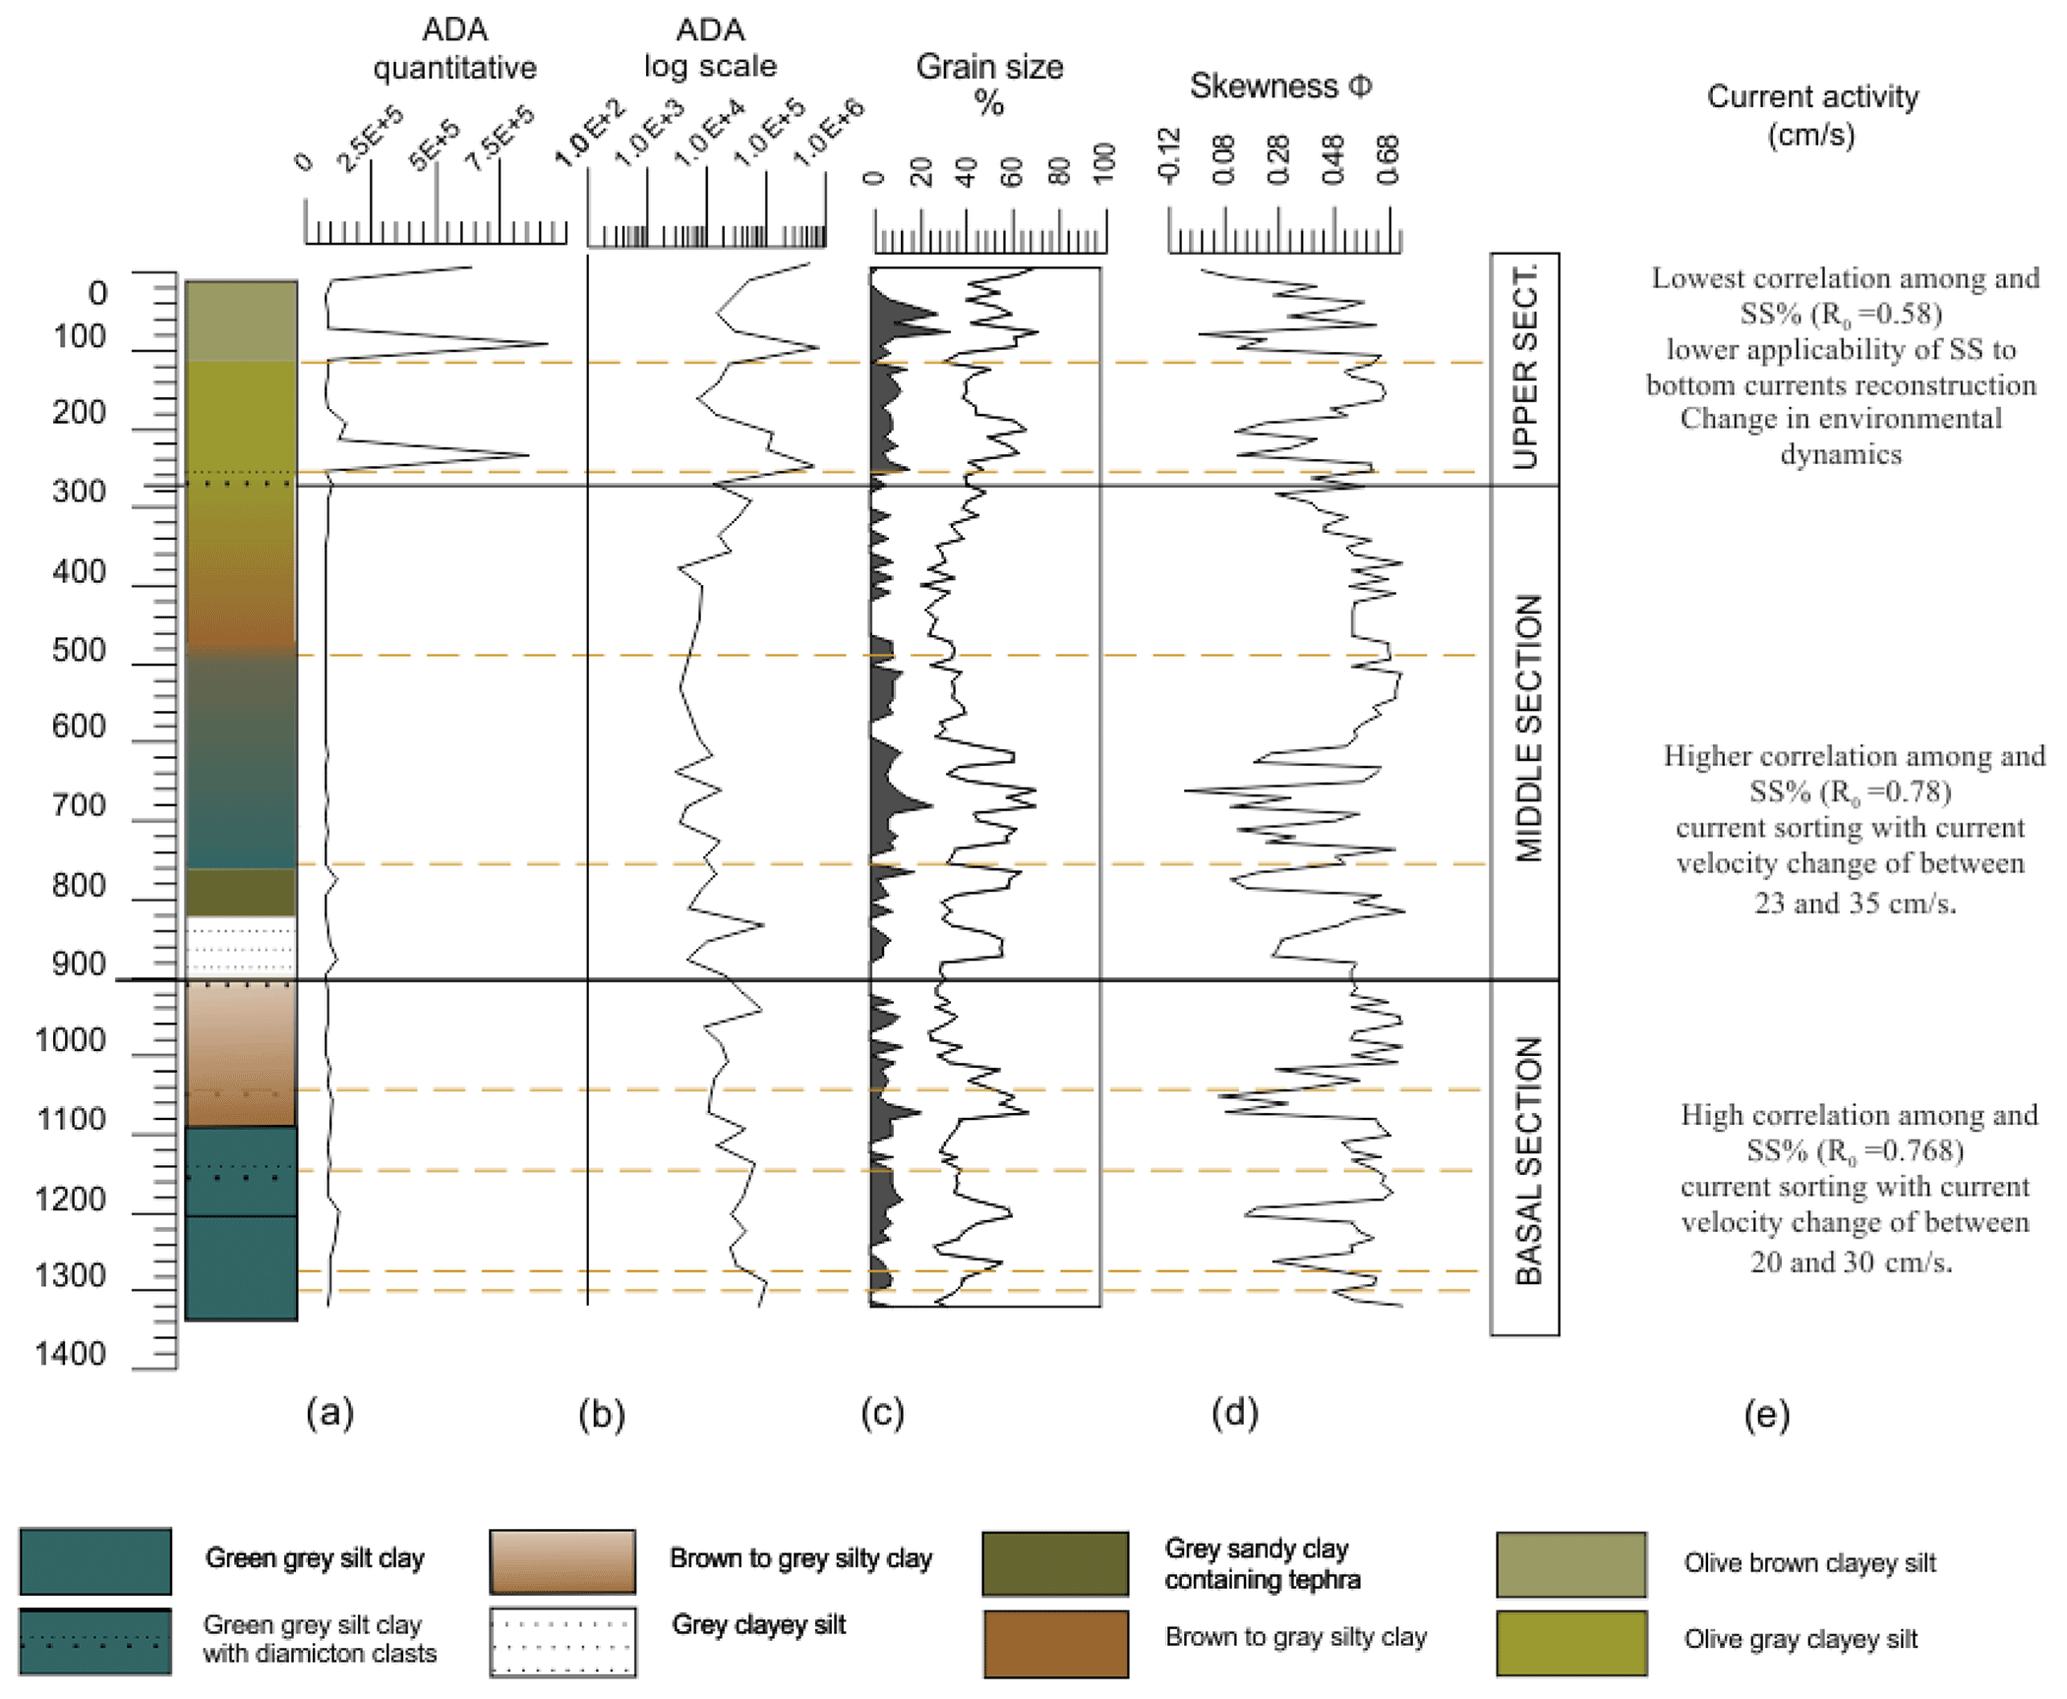
Figure 4IN2017-V01-A006-PC03 lithostratigraphic log compared to (a) ADA (absolute diatom abundance) and expressed in a quantitative manner (number valves per gram of ram of dry sediment). (b) ADA expressed in logarithmic scale. (c) Grain size cumulative logs for sand (black silhouettes), silt (black line), and clay percentages. (d) Skewness values (φ) to define the main core's sections. (e) Current activity highlighted from the correlation between the 10–63 µm size fraction (SS is for sortable silt) and the percentage of sortable silt (SS %) in the total mud fraction. This to test if the sediments are current-sorted, according to McCave and Hall (2006), McCave et al. (2014), and McCave and Andrews (2019).
PC03 middle section – 901 to 260 cm
This section is a grey to green–grey gradational bedded silty clay sequence with beds ∼ 2–5 cm thick. A tephra layer with maximum abundances at 800 cm marks this middle section. Scattered sand grains and pebbles are present throughout the section, and a reddish-grey clay interval is observed from 756–754 cm. A sharp-based, faintly interbedded, and reddish-brown clay unit is present from 495 to 465 cm. This sharp boundary suggests erosion, while the massive to slightly bedded sequence indicates more continuous deposition.
Grain size data show an average clay value of 58.5 % (median value of 62.3), average silt values of about 35 % (median value of 31.8), and average values of sand of 5.7 % (median value of 6.5). Discontinuities and bed boundaries are observed frequently in this middle section, evident at 820, 740, and 480 cm (Figs. 3 and 4). Rare individual volcanoclastic glass fragments are scattered through the core, but higher concentrations are present between 840.56 and 560.5 cm. The abundance of glass fragments, tabulated during microfossil counting, is expressed in number of grains per gram of dry sediment. The glass fragments are clear to yellowish in color and angular in shape, suggesting minimal abrasion or alteration (Plate 1).
values vary from a maximum of 25.97 to a minimum of 14.53 with a delta value of 11.44. The correlation between and SS % is higher than in the basal section (0.78), suggesting higher overall current activity of the order of 23–35 cm s−1.
From 341 to 260 cm, there is a gradual transition from clay to silty clay, accompanied by a change in color from brown to green. At about 260–255 cm, a change to a grey–brown clay–silt interval is followed by a gradational boundary that marks the boundary between the middle and top section of the core. The top of this section was, in fact, defined based on (a) the microfossil dataset, (b) the presence of some close and sequential sharp boundaries altered by gradational levels, and (c) the presence of a lithological change in color.
PC03 upper section – 260 to 0 cm
The uppermost section (Figs. 3 and 4) is the only section with a diatom content adequate for statistically valid assemblage analysis. Sponge spicules, agglutinated foraminifera, and worm tubes are also present. From 255–249 cm upward, the olive grey, faintly bedded, and clayey-silty sediment exhibits bioturbation. A gradational boundary transitions upward to light olive grey, faintly bedded, and clayey sequences and dark olive grey and massive silty sequences. A change in texture at 249 cm and a sharp discontinuity at 102 cm suggest the presence of some changes in sedimentation that could be considered hiatuses or due to a lack of sedimentation. At 102 cm, the sediment shifts from dark olive grey silt (containing dispersed sand) to the uppermost sequence (composed of olive brown massive and sandy–clayey slit sediments). This transition is characterized by mottled intervals and burrows. Radiocarbon data (Table 3) indicate that the sequence between 260 and 100 cm is of a pre-LGM (Last Glacial Maximum) age (ca. 23 kyr), while the uppermost 100 cm are Holocene in age.
Grain size data highlight average clay values of 47.2 % (median value of 48.4), average silt values of about 42 % (median value of 37.5), and average values of sand of 10 % (median value of 8.6), while the negative skewness trend, coupled with a silt fraction increase, suggests increasing current energy during deposition (Fig. 3). On the other hand, values shift here from a maximum of 23.61 to a minimum of 17.18, with a delta value of 6.43. The correlation between and SS % is the lowest for the core (R0=0.58), suggesting a change in the dynamics of the environment and a lower applicability of to bottom current reconstruction. This mismatch could result from the increase in silt-sized diatoms affecting the sorting of the silt fraction suggesting a possible link between sediment rinsing and biosiliceous content.
However, using calibrations of with current strength (McCave and Hall, 2006), current speeds vary between 12 and 19 cm s−1 (Fig. S1).
The diatom content is thought to interfere with the silt fraction and the sortable silt results but can be considered sedimentary particles. We did not undertake chemical treatment for the removal of biogenic silica, as this can also damage the terrigenous silica components.
4.1.2 KC03
Core KC03 is mostly clay-rich (up to 54 % in clay) and with a very fine clay fraction <1.1 % (Appendix 8 in Armand et al., 2017). Two silty intervals are observed at ca. 155–125 cm and at the top (about 20 cm), while the sand fraction is always <25 %. On the basis of the sediment grain size dataset, lithology, and the diatom record (see below), two sediment discontinuities, corresponding to potential hiatuses, are highlighted: H1 at 160 cm and H2 at 40 cm. Radiocarbon data indicate that the basal part of the sequence (base is H1) is older than about 30 kyr, the middle section comprised between H1 and H2 < 30 kyr, while the uppermost sediment above H2 is Holocene in age.
4.2 Seismostratigraphy
The sediment core was collected in the western sector of the area surveyed during the IN2017_V01 cruise, which is characterized in its uppermost seismostratigraphic levels by semi-transparent facies with low-amplitude, continuous, sub-parallel reflectors (Donda et al., 2023). Above the semi-transparent facies, the sub-bottom profile also reveals the occurrence of a well-layered unit that progressively thickens toward the Minang-a Canyon axis (Fig. 5). The seismic units intercepted by the piston core PC03 belong to the WL-S10 seismic sequence of Donda et al. (2020, 2023), and together with WL-S9, these have distinct characteristics from the seismic units lying below that are constituted by higher-amplitude seismic reflectors. The time–depth conversion performed through seismic data tomographic analyses (Donda et al., 2023) allowed for an estimation of depth reached by the bottom of the piston core (red arrow in Fig. 5), which corresponds to a high-amplitude reflector that lies just below the base of the semi-transparent acoustic facies. The yellow reflector, which is located at an approximate depth of 900 cm, corresponds to an unconformity interpreted as a mass movement scar. Above this reflector, the semi-transparent facies represents the more poorly bedded and fine-grained sediment infilling the slump scar and includes remnant slide material. The yellow reflector progressively deepens downslope to the east so that the slide material (i.e., the semi-transparent facies) thickens in that direction (Fig. 5). Another significant change in the seismic facies occurs at approximately 450 cm depth, where the pink reflector represents the base of a package of higher-amplitude reflectors.
The high-resolution seismic profile indicates that between ca. 450 and 900 cm, PC03 is intercepted a slide composed of more incoherent material and that the slide is bounded by two prominent reflectors which represent two unconformities. Similar, semi-transparent acoustic facies are also recognized below the stratigraphic succession intercepted by piston core PC03, indicating the occurrence of recurrent sediment slides along the flank of Minang-a Ridge, intercalated by packages of continuous seismic reflectors, and possibly representing hemipelagic- and/or bottom-current-related sediments.
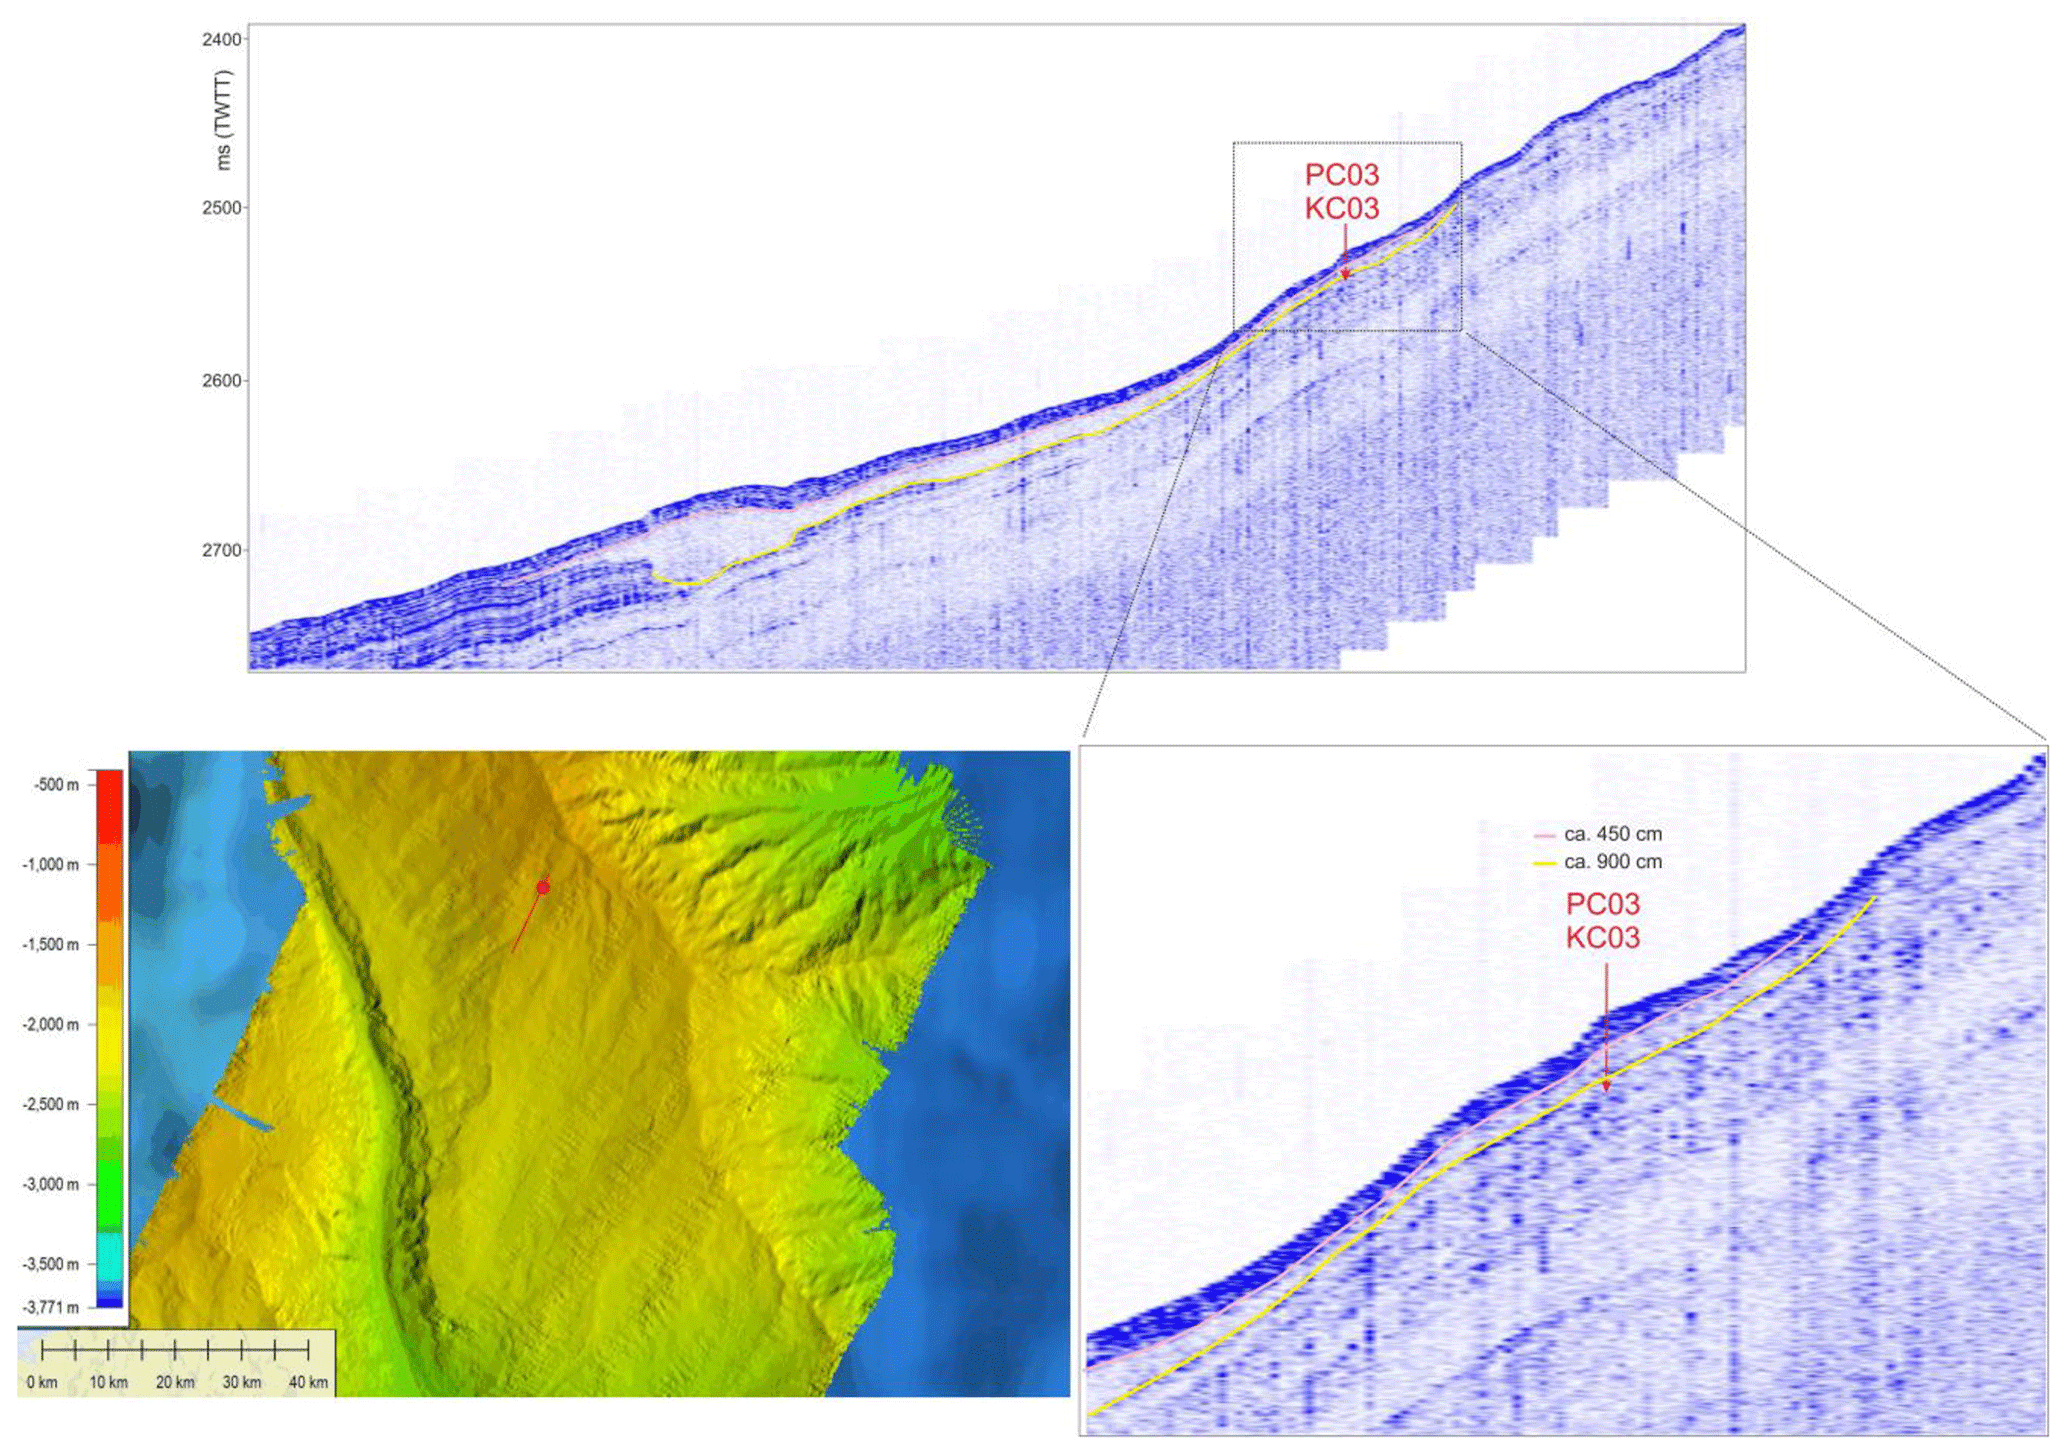
Figure 5Location of KC03/PC03 on the crossing CHIRP sub-bottom and on the multibeam bathymetry (at the bottom left). A time–depth conversion was applied, using the seismic velocities derived from high-resolution multichannel seismic profiles collected in the study area during the IN2017_V01 cruise, as described in Donda et al. (2023). The bottom of PC03 core is marked by the red arrow. The yellow reflector, which lies at an approximate depth of 900 cm, corresponds to the main late Pliocene mass movement (H3). Above this reflector, the semi-transparent facies representing the slide is bounded upward by a pink reflector at ca. 450 cm. It corresponds to H4, which marks the transition to a well-layered stratigraphic sequence progressively thickening toward the Minang-a Canyon axis.
4.3 Magnetostratigraphy and age model
Stepwise AF demagnetization reveals that all samples carry a magnetic overprint, which could be due to viscous relaxation, drilling, or transportation. The overprint component was typically removed by AF demagnetization at peak fields of 20–40 mT (Figs. S3, S4 and S5). A ChRM was isolated for each sample visually and quantified by PCA. Both normal and reversal polarity directions were identified, with the majority of samples displaying simple demagnetization behavior toward to the origin of a Zijderveld (1967) plot (Fig. S3). Some data were difficult to interpret, especially samples from the lower part of the core. This is, however, reflected by larger ChRM direction uncertainties. Due to the high dip angle of the Earth's magnetic field at the PC03 site, the ChRM inclination is expected to reflect the geomagnetic polarity more clearly than declination. Assuming a geocentric axial dipole (GAD) field, the normal polarity inclination for the PC03 site is approximately −77°. Furthermore, based on the TK03 giant Gaussian process field model of Tauxe and Kent (2004), inclinations at the PC03 site are expected, based on 95 % confidence intervals, to vary within a range from −86 to −44° (normal polarity) and from 86 to 44° (reversed polarity).
To identify potential magnetic mineral carriers of the paleomagnetic signal, ARM MDF was compared to the AF interval selected to represent each sample's ChRM. This was performed on a section-by-section basis and demonstrates that the ChRM is carried by relatively high coercivity minerals compared to the ARM (Fig. S4). Based on the coercivity of the paleomagnetic signal, the ChRM may be carried by biogenic magnetite or antiferromagnetic minerals (Egli, 2004).
In Fig. 6, ChRM inclination is shown as a function of depth. Through sections of the core, the ChRM inclinations carry large uncertainties but exhibit broadly consistent values. To aid visualization, the ChRM directions were smoothed using an 11-point moving average with the propagation of uncertainties via parametric bootstrapping (Tauxe et al., 2010). The inclinations of normal and reversal polarity zones of upper-core sections (14A to 6I) agree with the value predicted with a GAD and TK03 95 % confidence intervals. This indicates that the polarity was recorded reliably though this upper portion of PC03. Inclinations from the lower five sections (5J to 1N) are more erratic and carry large uncertainties (e.g., section 2M). AMS results did not, however, reveal evidence for sediment disruption, and there is no clear difference between the magnetic fabrics in the upper (14A to 6I) and lower (5J to 1N) sections. Given the variable quality of the inclination data, a robust age model based on polarity transitions alone is infeasible. It is, however, possible to provide some board paleomagnetic constraints on the chronology of core PC03 via comparison to the geomagnetic polarity timescale (GPTS; Ogg, 2020).
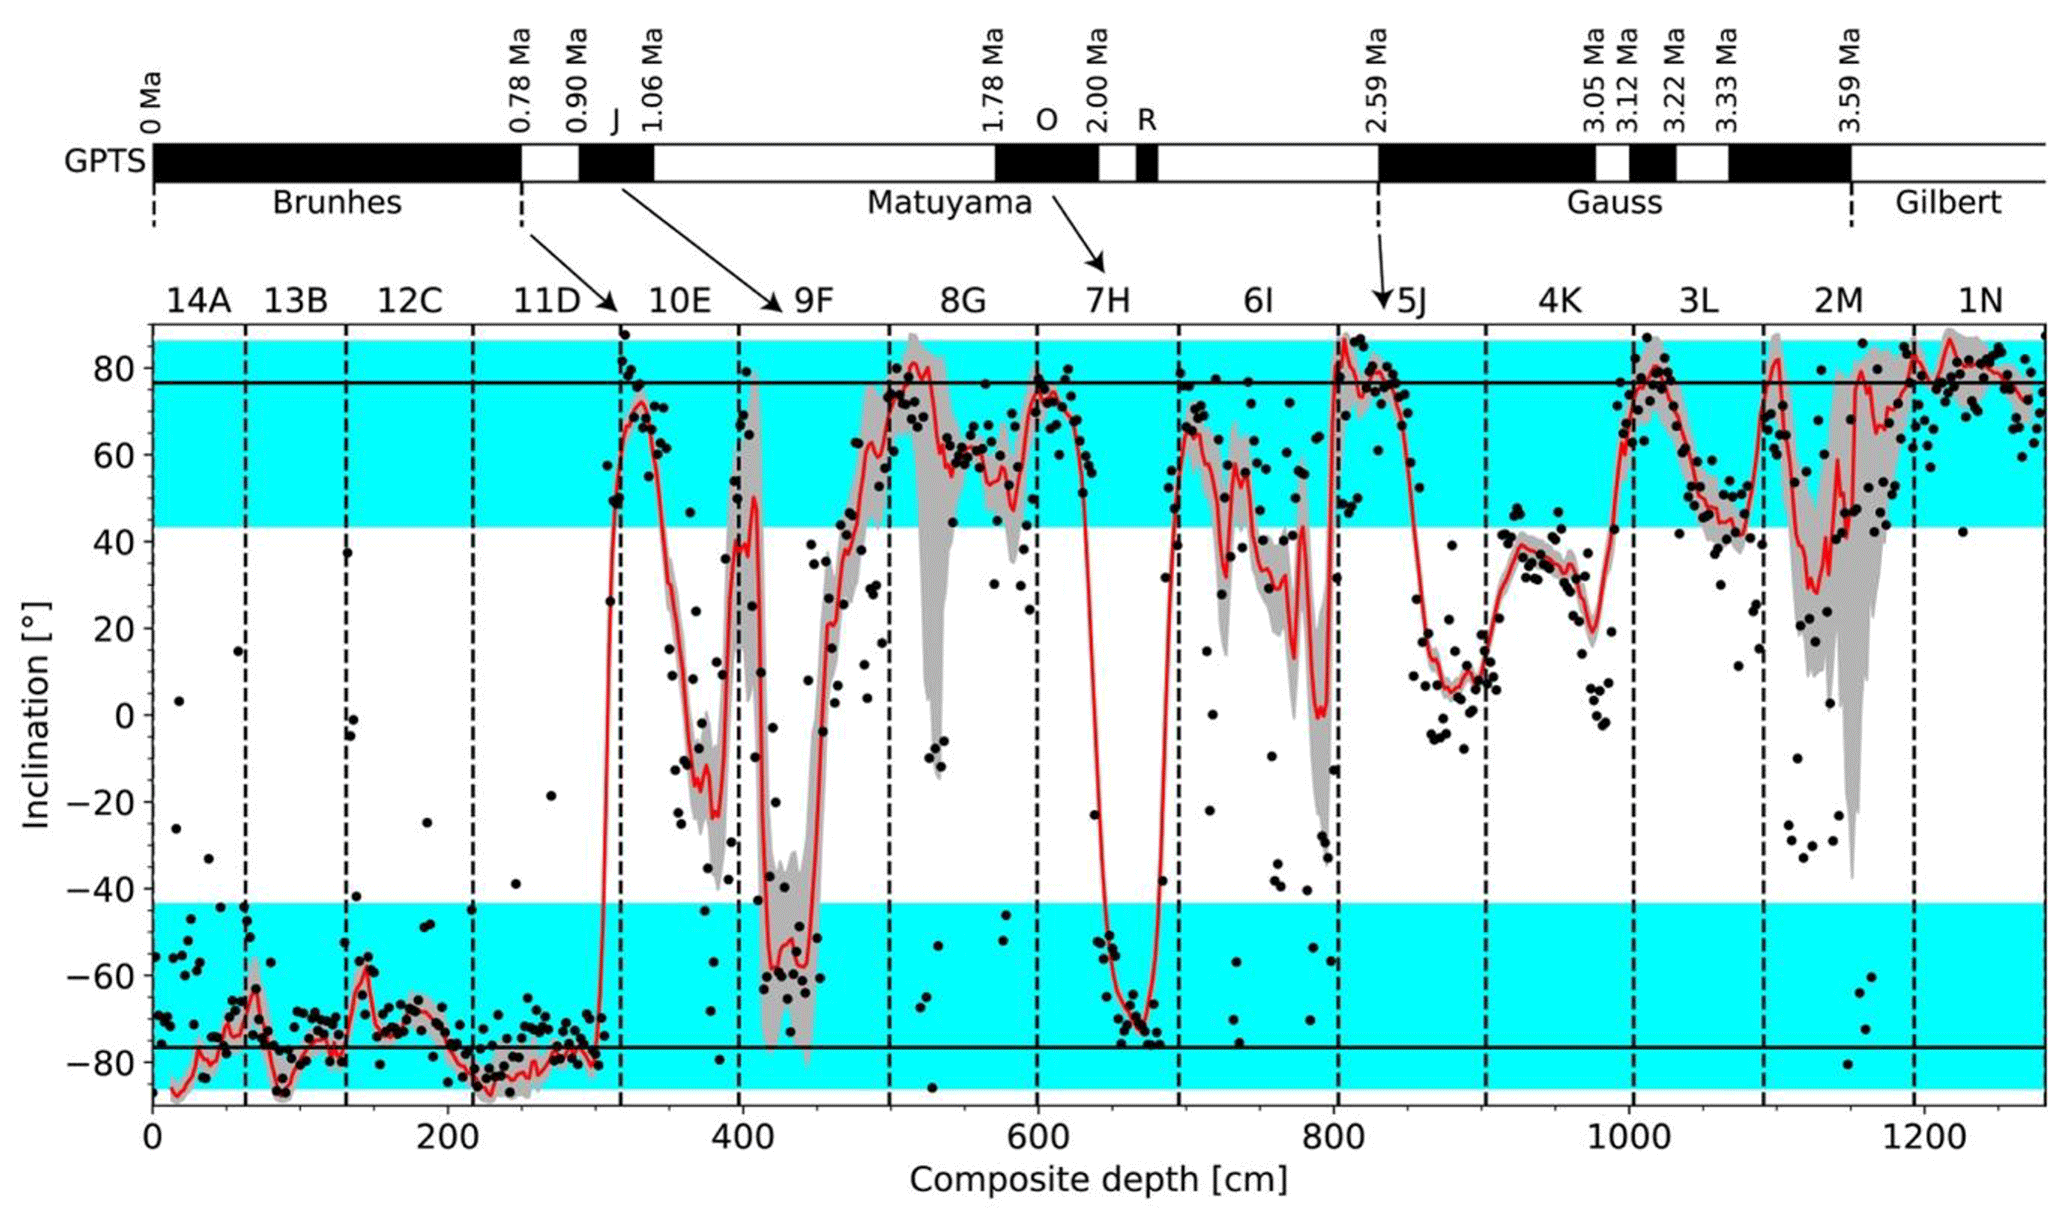
Figure 6Inclination versus depth for PC03 with possible correlations to the geomagnetic polarity timescale (GPTS). Core breaks are indicated with dashed vertical lines, and section numbers (14A to 1N) are shown. The black lines at ± 77° correspond with the expected inclination for a geocentric axial dipole field at the location of PC03. Cyan shading shows the 95 % confidence interval for expected inclinations, according to the TK03 model of Tauxe and Kent (2004). Characteristic remanent magnetization (ChRM) inclinations for individual samples are shown as black points. For clarity, the uncertainties associated with the ChRM points are not shown but are available in the Supplement. An 11-point moving average and its 95 % confidence interval are shown as a red line and grey shading, respectively. The potential correlation of the ChRM inclination record to normal- (black) and reversed-polarity (white) GPTS intervals is shown by arrows.
The normal-polarity Brunhes chron (0–0.773 Ma) is clearly identifiable in sections 14A to 11D. Furthermore, the polarity transition between the Matuyama (reversed) and Brunhes (normal) chrons spans the top of 10E into the base of 11D, providing an age marker of 0.773 Ma. There are multiple normal-polarity subchrons within the Matuyama chron. The Jaramillo (0.78–0.90 Ma) and Olduvai (1.78–2.00 Ma) subchrons are assigned to 9F and 7H, respectively. The Réunion subchron (2.1–2.2 Ma) is potentially recorded in 6I; however, the ChRM inclinations are erratic, so this designation is speculative. The erratic inclinations in the lower five sections (5J to 1N) make a correlation with the GPTS challenging. The transition between the Gauss (normal-polarity) and Matuyama (reversed-polarity) chrons at 2.59 Ma is potentially located within 5J; however, this is speculative, given that full normal-polarity inclinations are not observed within (5J to 1N).
The sample inclinations across 4K to 1N do not exhibit normal polarity, which is inconsistent with the expectations for the Gauss chron. There are positive inclinations in the lower portion of PC03 that may correspond to reversed-polarity subchrons during the Gauss chron (Fig. 6). Given the lack of normal-polarity samples across 4K to 1N, assigning intervals with reversed polarity to specific subchrons within the Gauss chron is, however, not feasible.
4.4 Tephra layer
The volcanic glass grains and micrograins (tephra and microtephra), counted during the microscope analyses for diatoms, were expressed in number of grains per gram of dry sediment by applying the same quantitative algorithm (ADA) used for diatom quantitative analysis (Figs. 2a and 3b). During the quantitative estimate, a wide variety of volcanic particle shapes was recorded. Clast morphologies are related to the composition, degassing, and crystallization kinetics during volcanic eruptions and magma ascent, followed by the fragmentation mechanism. Ash types include vesicular elongate clasts, smooth crystals, elongated platy bubble wall shards, needle-like fragments of tube pumice, and the extremely elongated Pele hairs formed by low-viscosity basaltic melt (Saxby et al., 2020). The tephra estimate highlights a maximum abundances at 800 cm, suggesting a defined layer of mainly vesicular elongate clasts and bubble wall shard clasts (Fig. 4b; Plate 1; figs. 23 and 24), while scattered grains are present upward up to about 550 cm.
4.5 Diatom data
4.5.1 PC03 diatoms (Plate 1)
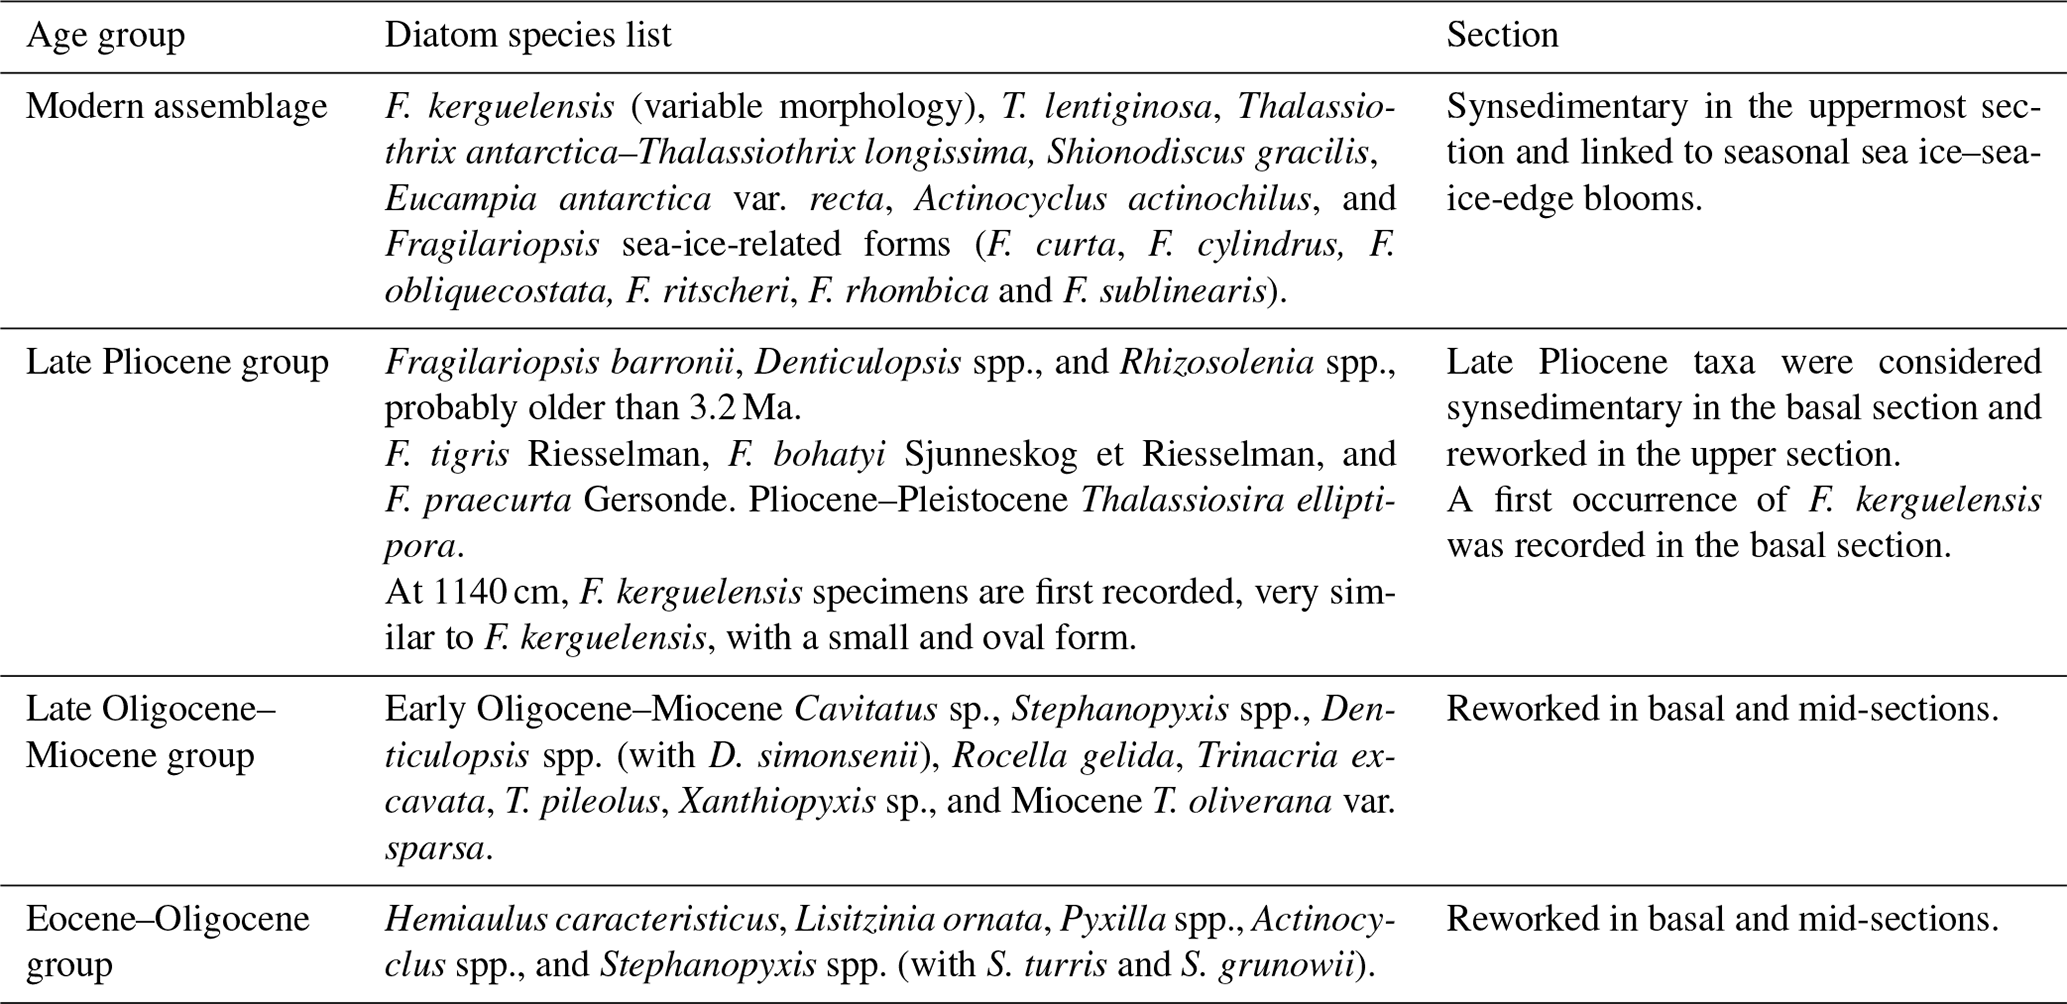
The primary goal of the diatom work was to provide a chronologic framework for the core. The basal (1321–901 cm) and mid- (901–260 cm) sections of the core have very low-diatom abundance, with generally valves per gram of dry sediment (vpgds), and many of the samples are barren (Fig. 7). The diatom assemblages are characterized by specimens of mixed age, indicative of reworking. Here, the data are used more generally to identify the ages of reworked material. Specific geological ages based on grouping taxa into different age clusters, here termed age groups, are the Eocene–Oligocene group, late Oligocene–Miocene group, late Pliocene Group, and modern assemblage (Table 1). The modern assemblage is present only in the uppermost section (260–0 cm), where diatom abundance is significantly higher, reaching vpgds.
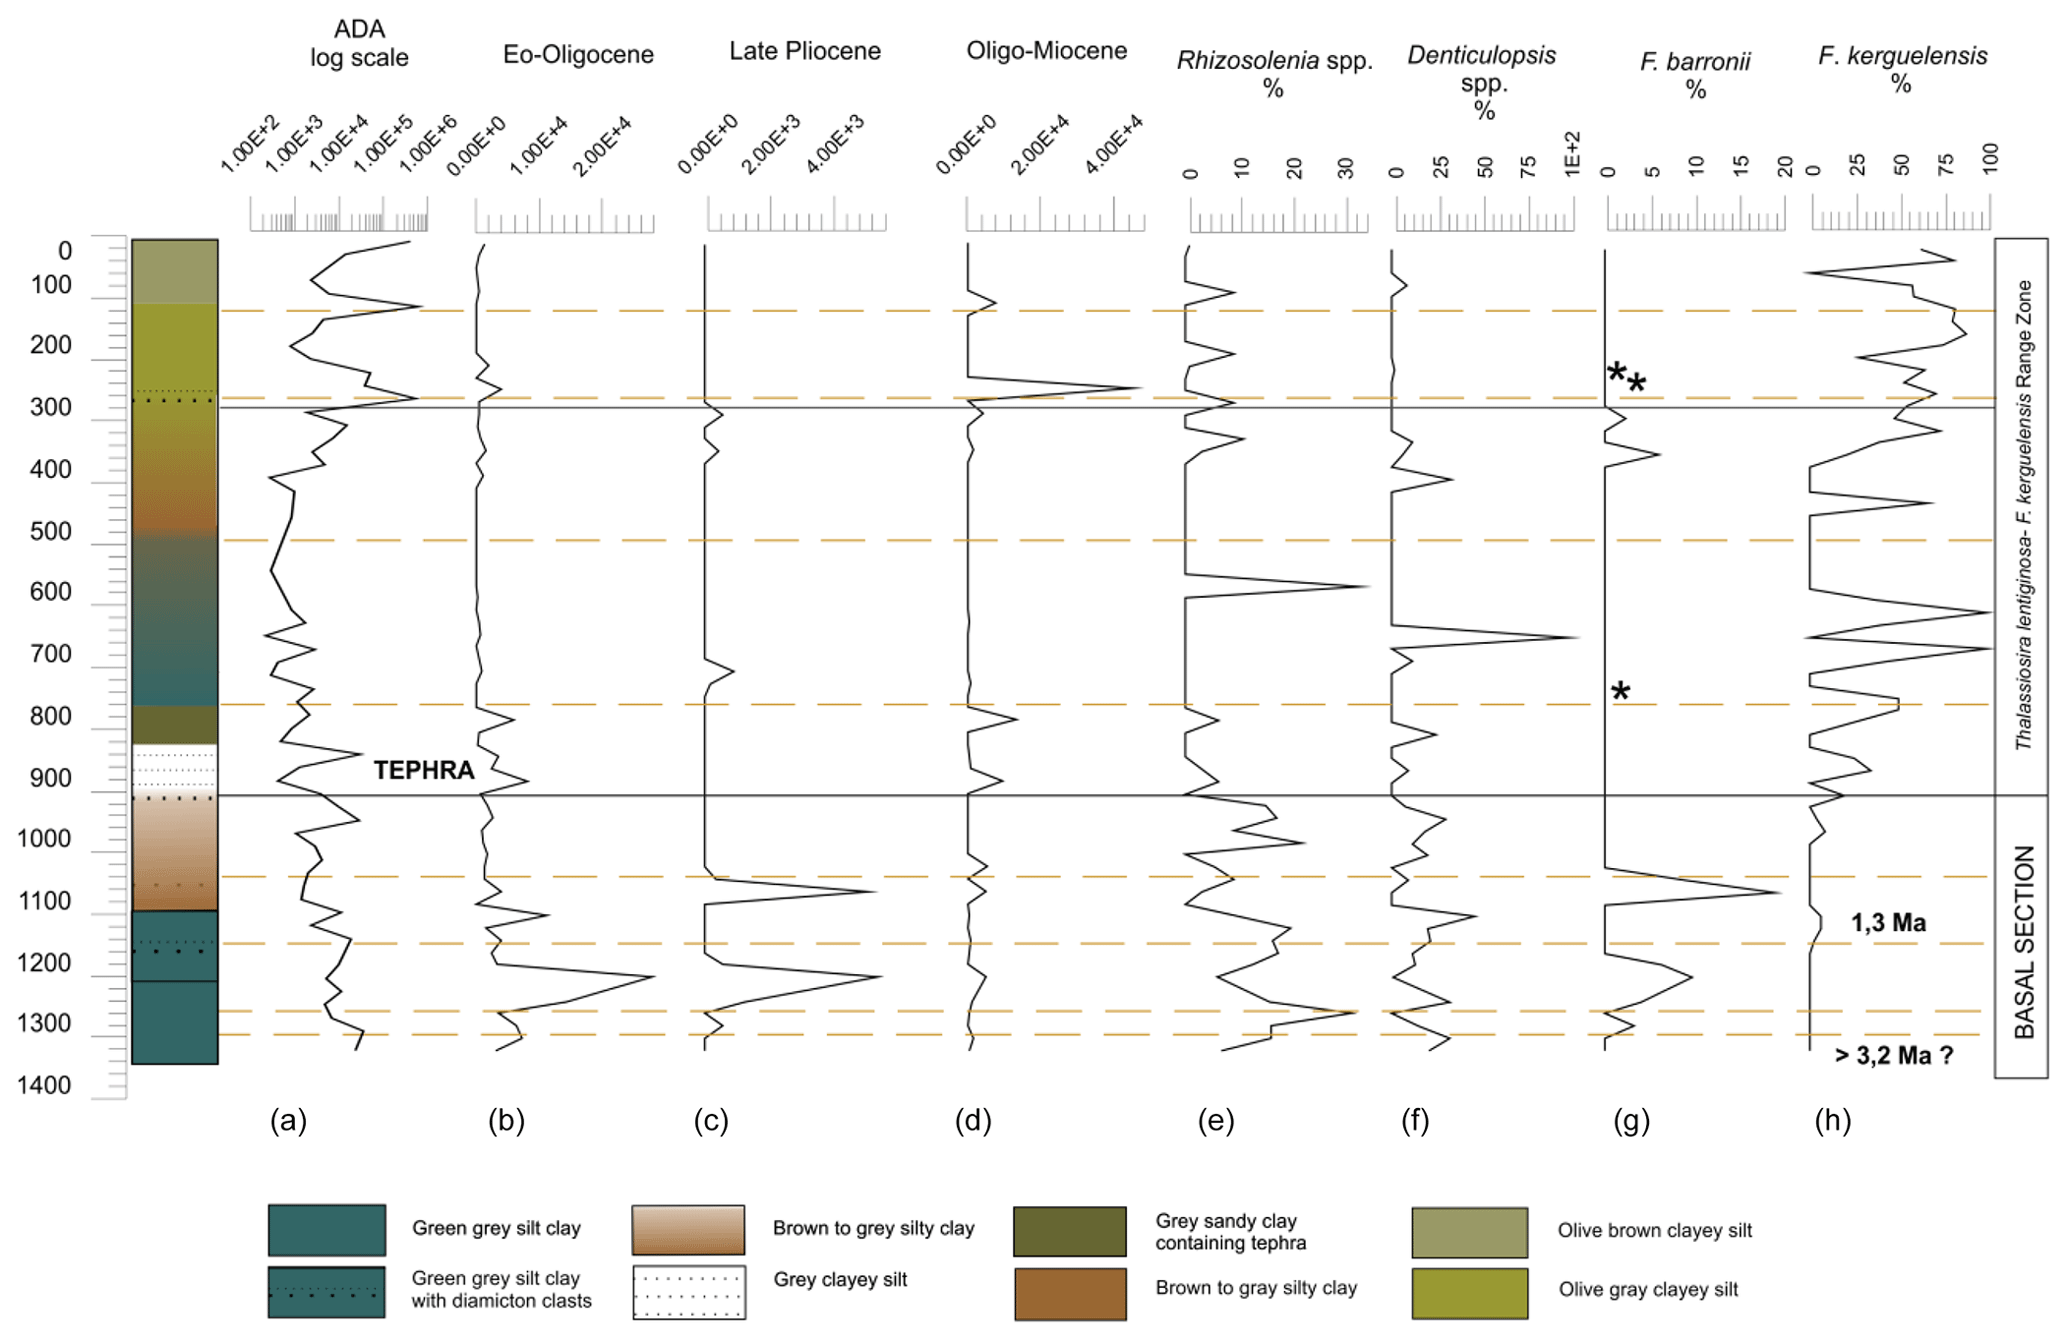
Figure 7IN2017-V01-A006-PC03 core age model based on biostratigraphy. The core lithostratigraphic log is compared to (a) ADA in the logarithmic scale. The age groups were identified by merging specific geological taxa into different age clusters and considered sediment particles. Diatom age groups (see Table 1) include the Eocene–Oligocene group (b), late Pliocene group (c), and late Oligocene–Miocene group (d). These values are expressed in vpgds by applying the ADA algorithm to each specific group. Some taxa (here expressed in percentage) presented specific trends, as seen with Rhizosolenia spp. (e) and Denticulopsis spp. (f), while F. barronii (g) was used as biostratigraphic marker (see Table 2). The modern assemblage (h) dominated by F. kerguelensis. The asterisks highlight the sporadic presence of Hemidiscus karstenii. Some indicative ages are suggested, while at the right of the graph, an attempt at zonal biostratigraphic subdivision is made.
The mid-section of the core is characterized by sparse diatoms that exhibit signs of reworking and dissolution (Plate 1; Figs. 2, 9–10, and 14–15). At 720 cm, the biostratigraphically important taxa F. kerguelensis and F. barronii are observed together, with several other species of Fragilariopsis, such as the late Pliocene F. tigris Riesselman and F. bohatyi Sjunneskog et Riesselman (Scherer et al., 2007; Cody et al., 2008; Sjunneskog et al., 2012). Miocene Thalassiosira oliverana var. sparsa and Pliocene–Pleistocene Thalassiosira elliptipora are observed. The sporadic presence of the poorly preserved early Oligocene–Miocene Cavitatus sp. is noted from 341 to 101 cm (Akiba et al., 1993; Scherer et al., 2007).
The uppermost section of PC03 core (Fig. 8A) is characterized by higher diatom abundance, with peaks at 240, 100, and 0 cm. The assemblage is dominated by cold open-ocean diatom taxa, mainly F. kerguelensis, T. lentiginosa, the Thalassiothrix antarctica–Thalassiothrix longissima group, Shionodiscus gracilis, and Stellarima microtrias. Sea-ice-associated taxa include Eucampia antarctica var. recta, Actinocyclus actinochilus, and Fragilariopsis sea-ice-related forms (F. curta, F. cylindrus, F. obliquecostata, F. ritscheri, F. rhombica, and F. sublinearis).
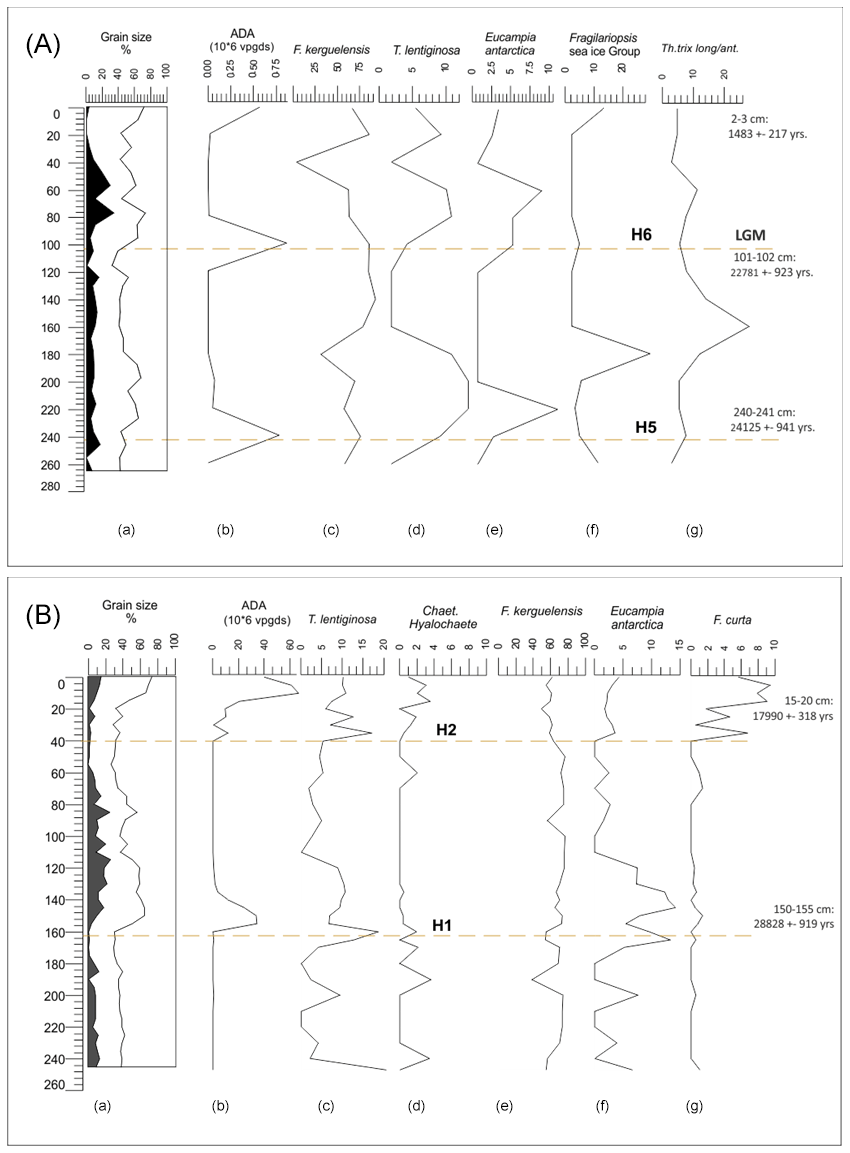
Figure 8(A) IN2017-V01-A006-PC03 core uppermost section. (a) Grain size in percentage, and (b) quantitative ADA values expressed as the number of valves per gram of dry sediment (vpgds). (c) F. kerguelensis in percentage (%) of the total assemblage. (d) Thalassiosira lentiginosa (%). (e) E. antarctica (%). (f) Fragilariopsis sea ice group (% of the total assemblage). (g) Thalassiothrix antarctica–Thalassiothrix longissima group (%). Dotted lines highlight sedimentary disturbances (upper part of PC03 H5 and H6) coupled with radiocarbon dating. (B) IN2017-V01-A006-KC03 core grain size log (a), ADA values expressed in vpgds (b), and the main representative diatom taxa, namely T. lentiginosa (c), Chaetoceros (Hyalochaete) (d), F. kerguelensis (e), E. antarctica (f), and F. curta (g). Two sediment discontinuities, identified on the basis of the sediment grain size dataset, lithology, and diatom record, are highlighted by dotted lines and related to potential sedimentation noise or washing episodes (KC03-H1 and H2; these are not to be confused with PC03-H1 and PC03-H2 in the most superficial part of the PC03 core).
4.5.2 KC03 diatoms
In KC03, the ADA values are high at 150–155 cm, reaching 3.4×10⁷ valves per gram of dry sediment, and in the uppermost 20 cm, ADA values peaked at 6×10⁷ valves per gram of dry sediment at 10.5 cm (Fig. 8B). The diatom assemblage is dominated by F. kerguelensis (up to ca. 78 %), while Eucampia antarctica reaches a maximum of 11 % at 145.5 cm. F. curta is present in higher percentages in the upper 40 cm. Chaetoceros subg. Hyalochaete are present in relatively low relative abundances, never more than a few percent, while T. lentiginosa percentages up to ∼ 10 % are observed.
4.5.3 Diatom age groups
There are specific geological ages based on grouping taxa into different age clusters, here termed age groups, namely the Eocene–Oligocene group, late Oligocene–Miocene group, late Pliocene group, and modern assemblage (Table 1). These groups are distributed variably in the sedimentary sequence, with the modern assemblage present only in the uppermost section.
Table 1Age groups containing the cluster of specific taxa related to particular geological ages, a list of the related taxa, and the sections in which each age group is represented. Late Oligocene–Miocene and Eocene–Oligocene groups incorporate fragmented and resuspended forms (like Stephanopyxis spp.) that are considered reworked material characteristic of basinal contour currents.
4.5.4 Biostratigraphic details
First and last occurrences of two biostratigraphically useful taxa, F. barronii and F. kerguelensis, are highlighted, alongside other taxa, and provide chronologic constraints that are used in combination with the magnetostratigraphic data (Fig. 7). In this core, the identification of the transition from F. barronii to its evolutionary successor F. kerguelensis was challenging (Gersonde and Bárcena, 1998), given the wide range of morphological variability observed and the variable biogeographic distribution of these forms (Harwood and Bohaty, 2001; Zielinski and Gersonde, 2002; Barron et al., 2004; Whitehead et al., 2006; Cody et al., 2008; Tauxe et al., 2012; Peck et al., 2021; Winckler et al., 2021) (Table 2).
Table 2Total range model and average range model (Cody et al., 2008) of Fragilariopsis kerguelensis and F. barronii. FAD is the biostratigraphic first-appearance datum while LAD represents the last-appearance datum.
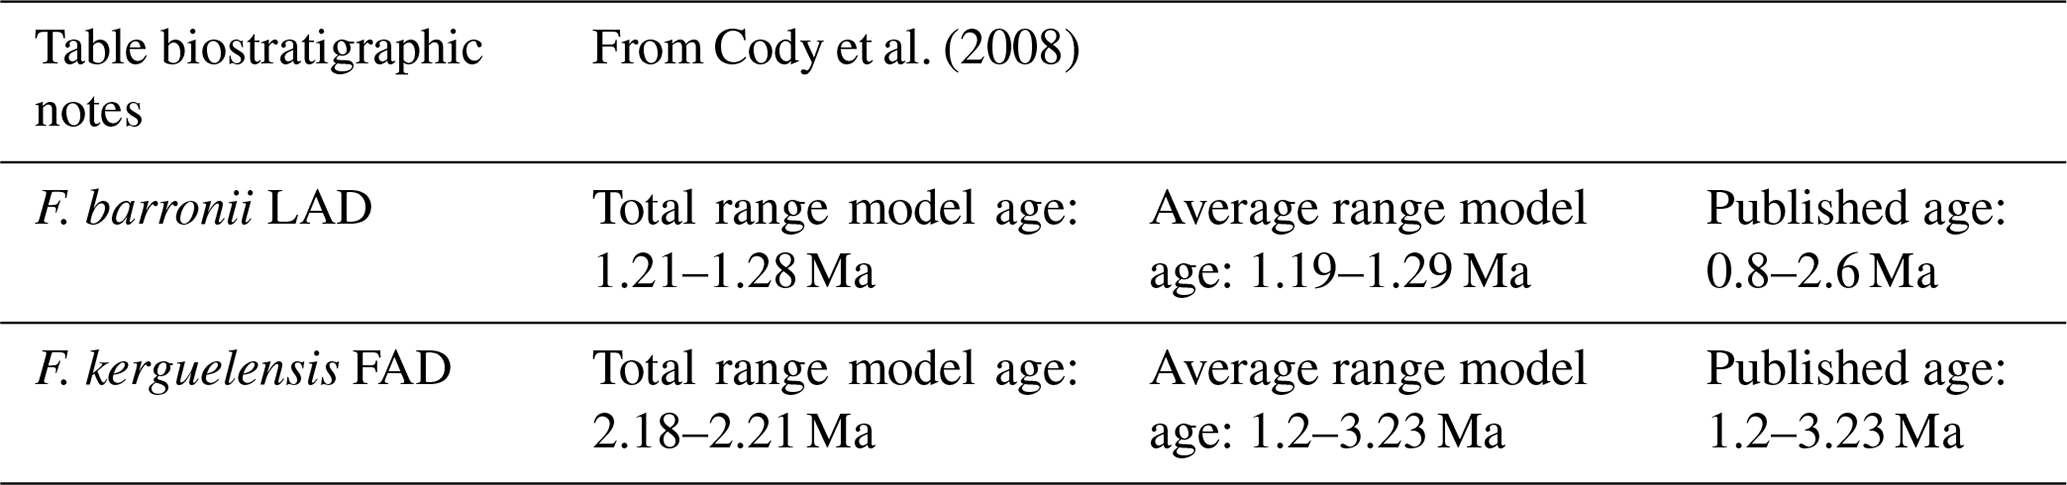
The lower part of the PC03 basal section is characterized by the presence of F. barronii in percentages up to about 10 %, Denticulopsis spp. (including D. simonsenii), and Rhizosolenia spp. (including R. harwoodii) (Yanagisawa and Akiba, 1990; Mahood and Barron, 1996; Ishino and Suto, 2020; Winter et al., 2012; Potapova et al., 2023; Plate 1). The taxa, identified to species level, suggest a late Pliocene sequence, probably older than 3.2 Ma. In this basal section of the core, we observe a disturbed transition from a Pliocene-aged assemblage to an Early Pleistocene one, based on the observation, at 1140 cm, of specimens of F. cf. kerguelensis, which is very similar to the small and oval form of F. kerguelensis (Cortese and Gersonde, 2008; Grigorov et al., 2014; Pinkernell and Beszteri, 2014; Beszteri et al., 2018; Shukla et al., 2018). This species has a published FOD (first occurrence datum) at 3.23 Ma (Zielinski and Gersonde, 2002; Cody et al., 2008), but its first occurrence (FO) in sediments spans from 1.9 to 2.5 Ma across the polar front zone (Zielinski and Gersonde, 2002; Cody et al., 2008; Peck et al., 2021; Winckler et al., 2021). The presence of several inferred hiatuses impedes the resolution of this transitional phase; it is possible that part of the sequence was removed during downslope sliding events. Despite their poor preservation status, late Pliocene forms, as the younger identified taxa, are considered to occur in biostratigraphic position, while Eocene to Miocene forms are considered reworked.
Reworked diatom taxa associated with warm-pelagic Eocene–Oligocene environments and contained in pre-diagenetic silica casings occur together with open- and stratified-water forms as Stephanopyxis spp., heavily silicified forms common during the early–middle Eocene (Witkowski et al., 2014; Jordan and Stickley, 2010), and Rhizosolenia spp. (Armand and Zielinski, 2001). These findings are coupled with Miocene Denticulopsis cf. simonsenii and Plio-Pleistocene Actinocyclus ingens, F. barronii and its Pleistocene descendent F. kerguelensis (Tolotti et al., 2018; Cortese and Gersonde, 2008; Whiting et al., 1985). These reworked, fragmented, and resuspended assemblages are considered characteristic of basinal contour currents and are likely biased by the loss of more delicate species, as evidenced by the fragmentation of the Pliocene taxa and Eocene–Oligocene diatom valves encased in a pre-diagenetic silica crust. Sedimentary disorders (H1, H2, and H3) do not allow a precise Pliocene to middle Pleistocene stratigraphy, as some parts of the late Pliocene–Early Pleistocene sequence may have been lost.
Following Cody et al. (2008), we suggest that the “best fit” of the highlighted biostratigraphic events place D. simonsenii at the end of its “total range model” and F. barronii within its local total range model (Fig. 7). The few H. karstenii valves (Plate 1; Fig. 11), observed at 280 cm, just above the tephra interval, and at the base of the upper section (200 and 100 cm), were considered reworked, probably a consequence of the slide event, based on the absence of an early–middle Pleistocene sequence and out of its biostratigraphic range (as at ca. 190 kyr; this species went extinct; see Crosta et al., 2020).
The similarities between the diatom assemblages in the uppermost section of PC03 and KC03, and supported by the radiocarbon dataset, allowed the two sequences to be correlated and dated to MIS3 or pre-LGM through the Holocene.
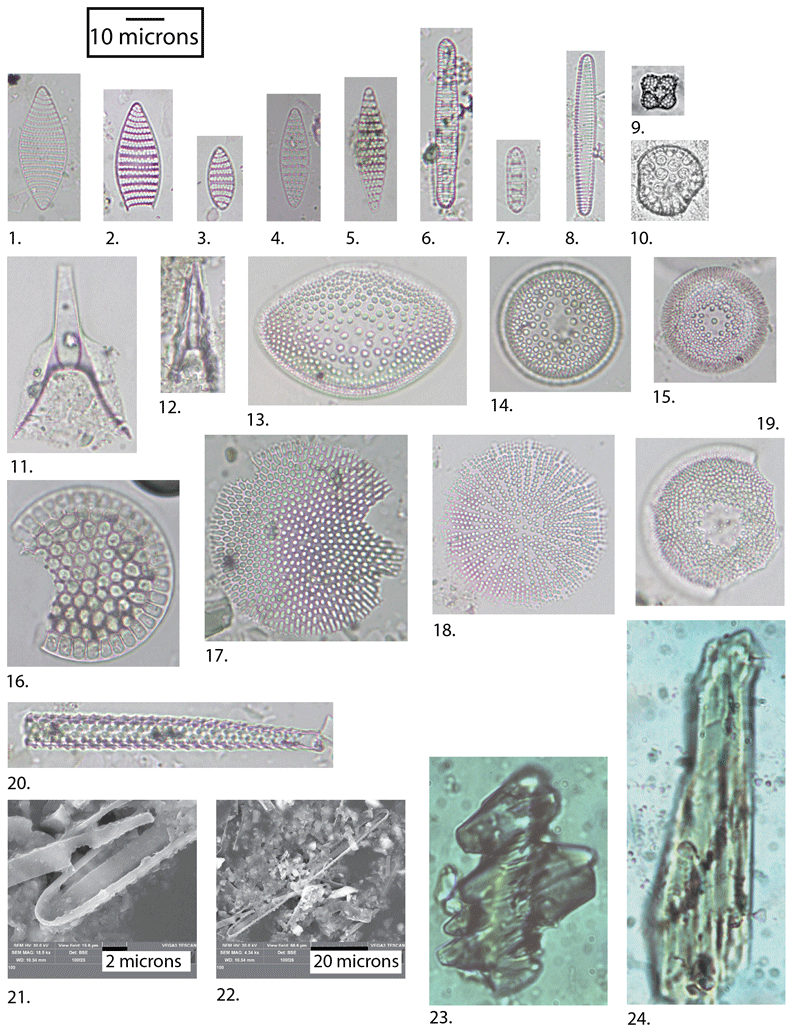
Plate 1(1, 2) Fragilariopsis barronii (Gersonde) Gersonde and Bárcena 1998 (1 – 1240–1241 cm; 2 – 1060–1061 cm). (3) Fragilariopsis barronii transitional form to F. kerguelensis (1060–1061 cm). (4, 5) Fragilariopsis kerguelensis (O'Meara) Hustedt (780–781 cm). (6, 7) Denticulopsis cf. simonsenii Yanagisawa and Akiba 1990 (6 – 1320–1321 cm; 7 – 1120–1121 cm). (8) Fragilariopsis cf. matuyamae (Gersonde and Bárcena, 1998) (1200–1201 cm). (9) Lisitzinia ornata Jousé 1978 (840–841 cm). (10) Rocella gelida (Mann) Bukry 1978 (1260–1261 cm); deformed specimen. (11) Rhizosolenia crassa Schimper in Karsten (1200–1201 cm). (12) Rhizosolenia harwoodii Winter (1060–1061 cm). (13) Hemidiscus karstenii Jousé in Jousé et al. (780–781 cm). (14) Actinocyclus ingens (Rattray) Whiting and Schrader (780–781 cm). (15) Thalassiosira inura Gersonde 1990 (1200–1201 cm). (16) Stephanopyxis grunowii Grove and Sturt in Schmidt 1883 (780–781 cm). (17) Thalassiosira elliptipora (Donahue) Fenner 1991 (1060–1061 cm). (18) Actinocyclus karstenii Jousé in Jousé et al. (1200–1201 cm). (19) Thalassiosira sp. cf. T. oliverana var. sparsa Harwood and Maruyama (1200–1201 cm). (20) Pyxilla reticulata Grove and Sturt (1060–1061 cm). (21) Cavitatus sp. Akiba et al., 1993. Focus on polar zone and hyaline sternum; scale bar = 2 µm (280–281 cm). (22) Cavitatus sp. Akiba et al., 1993. Isopolar valve; scale bar = 20 µm (280–281 cm). (23, 24) Volcanic ash particles (800–801 cm). Vesicular elongate clasts, smooth crystals, and platy bubble wall shards are highlighted. All images are from IN2017_PC03. Unless otherwise noted, the 10 µm scale bar in the upper-left corner is applicable.
4.5.5 Cluster analyses
Cluster analyses were used to evaluate and to compare different age diatom groups, sediment fractions, and values (Figs. 9 and 10).
In the cores, the cluster procedures highlighted three main clusters (see a specific cluster's parameters in Table S3 PC03 clusters' parameters and Table S4 KC03 clusters' parameters in the Supplementt).
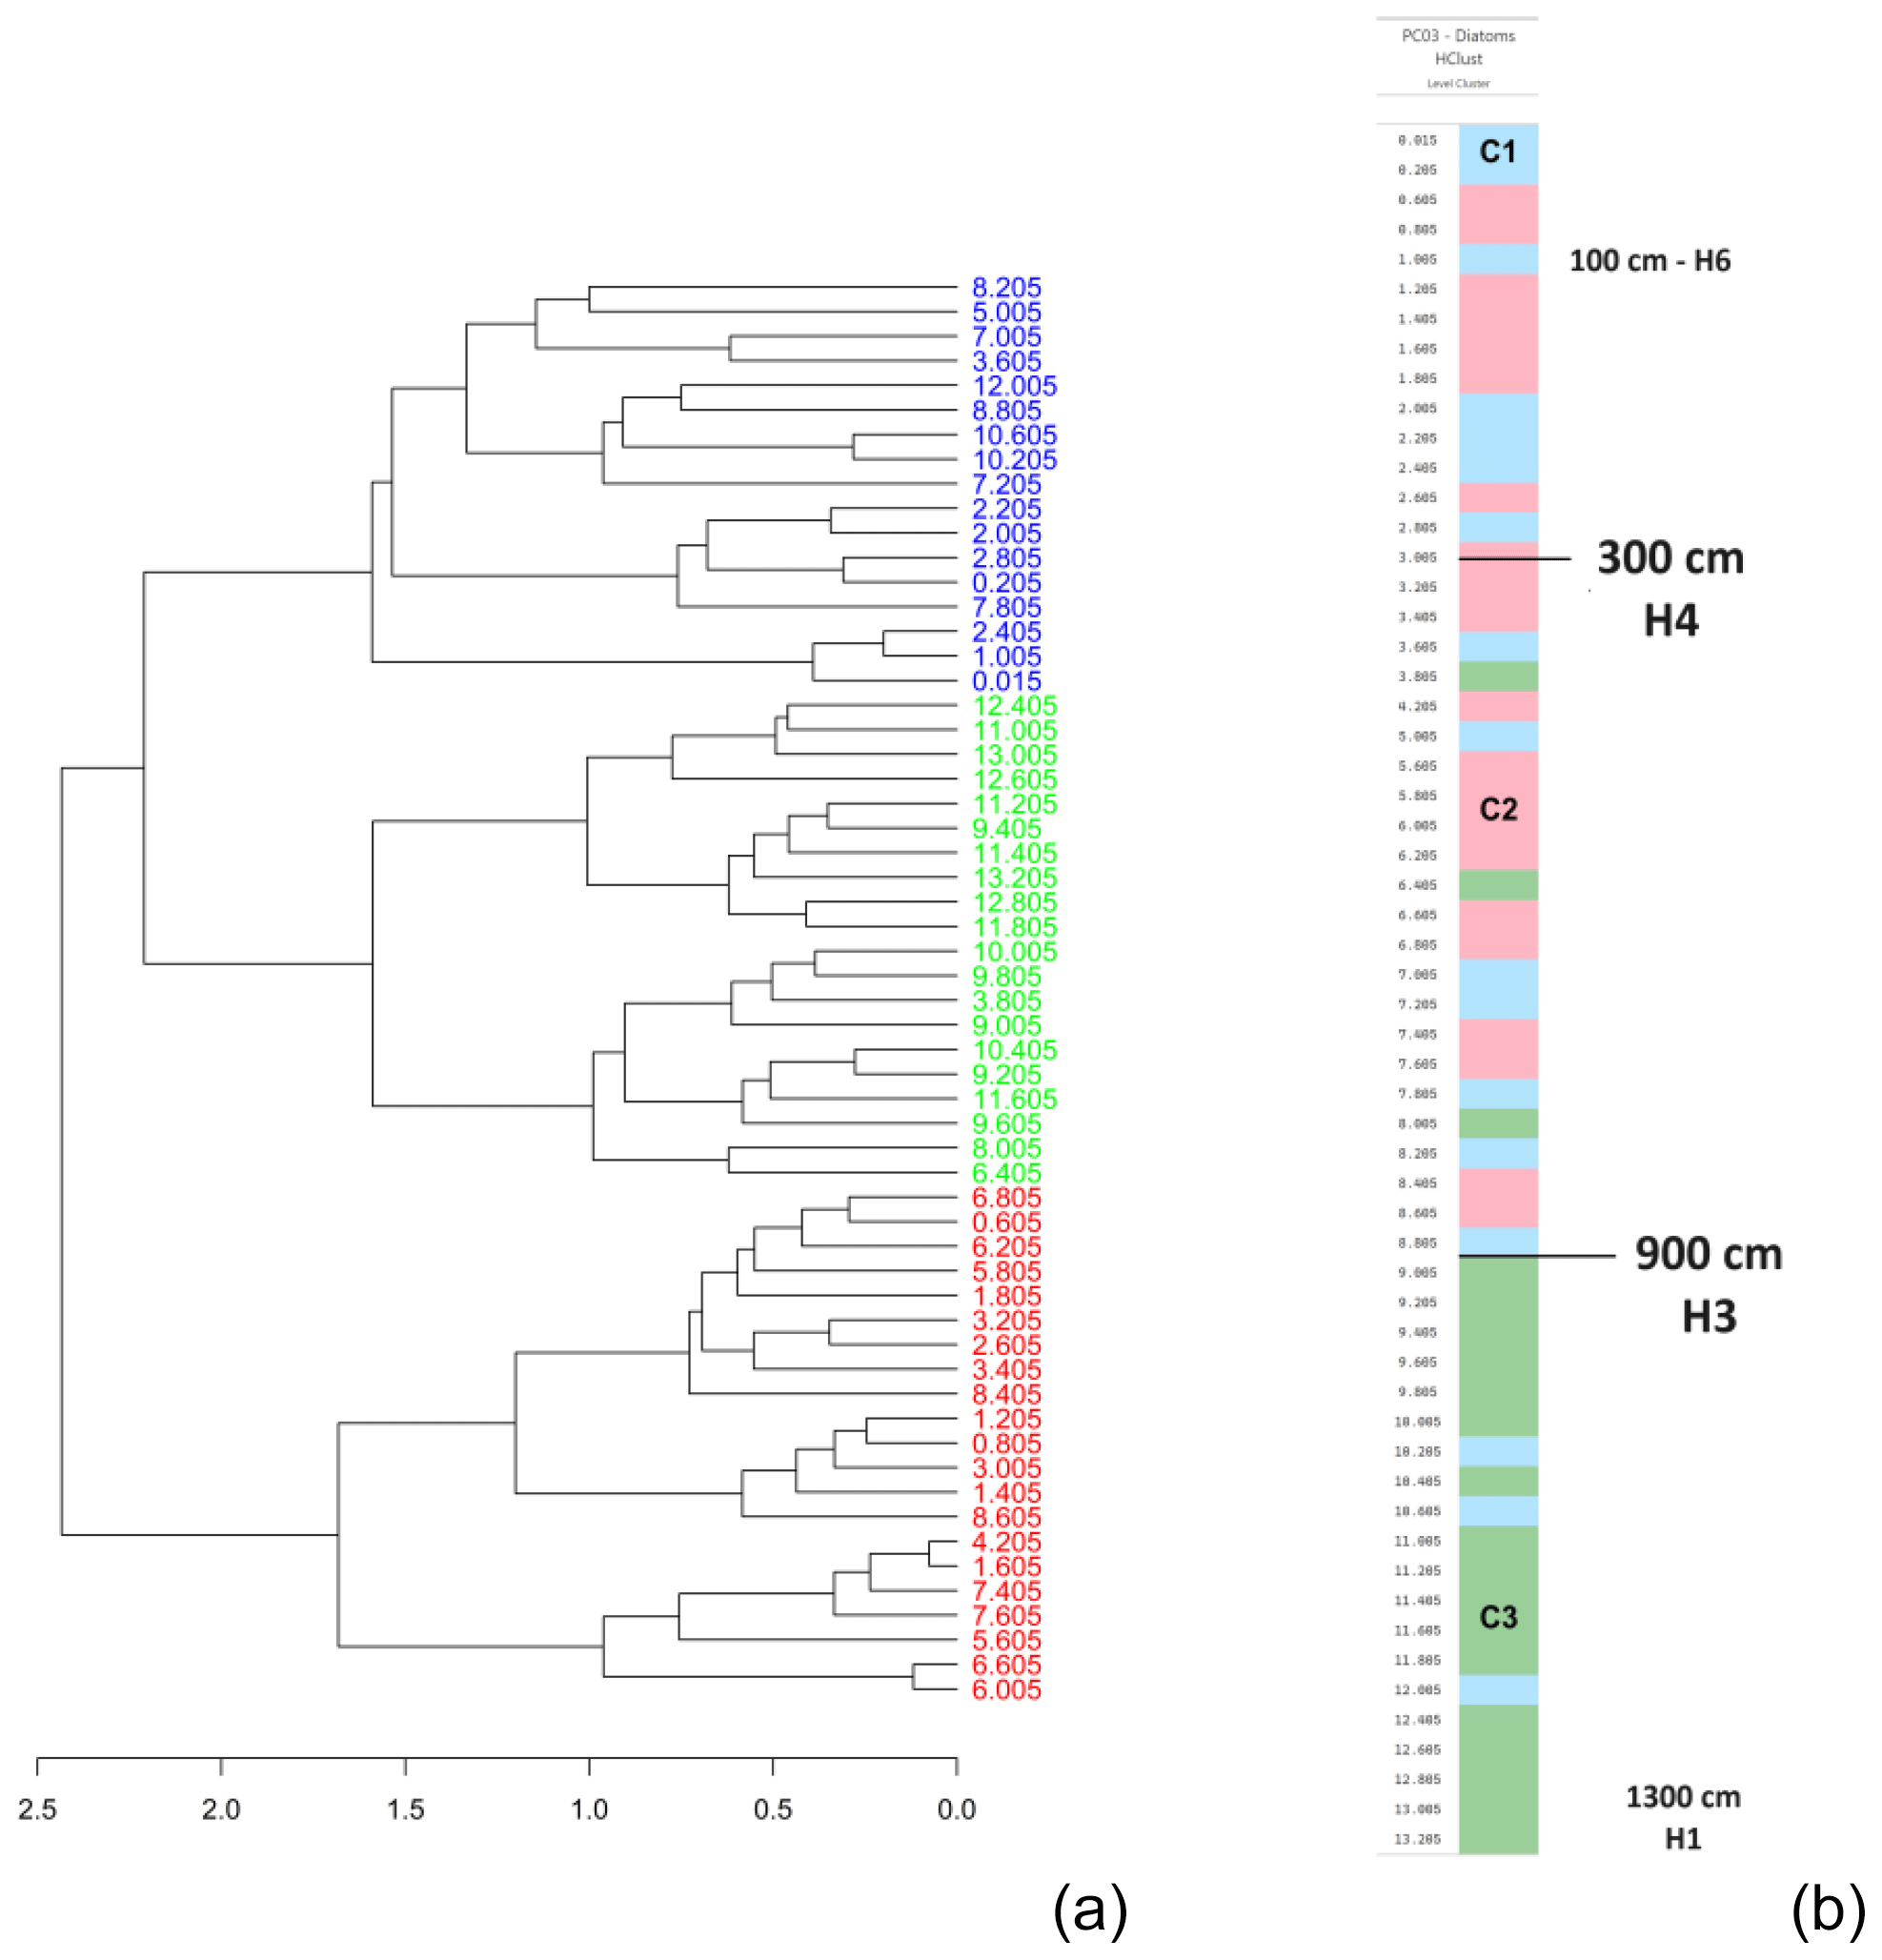
Figure 9(a) PC03 cluster dendrogram. (b) PC03 log clusters. (C1) Blue cluster. (C2) Red cluster. (C3) Green cluster (Table S1). The similarity degree is calculated on the first three branches with a dissimilarity of 2.0.
In the PC03 core, three clusters have been identified and plotted (Fig. 9a and b). From the bottom to the top of the PC03 core, a gradual shift from C3 to C1 is observed. Generally, C3 is represented by the Eocene–Oligocene and late Oligocene–Miocene age groups, while C2 and C1 are marked by Pleistocene–modern assemblages. The upward change in clusters corresponds to sedimentation disturbance. The clustering highlights the presence of reworking and plots the last presence of C3 in the middle section of the core.
In KC03, two clusters, C3 and C2, characterize the basal–mid-sections of the core (Table S2; Fig. 10a and b). A gradual shift toward modern assemblages, characteristic of C1, is recorded from about 30 cm upward. C2 at about 30 cm corresponds to the first sedimentation after a sedimentary disturbance event.
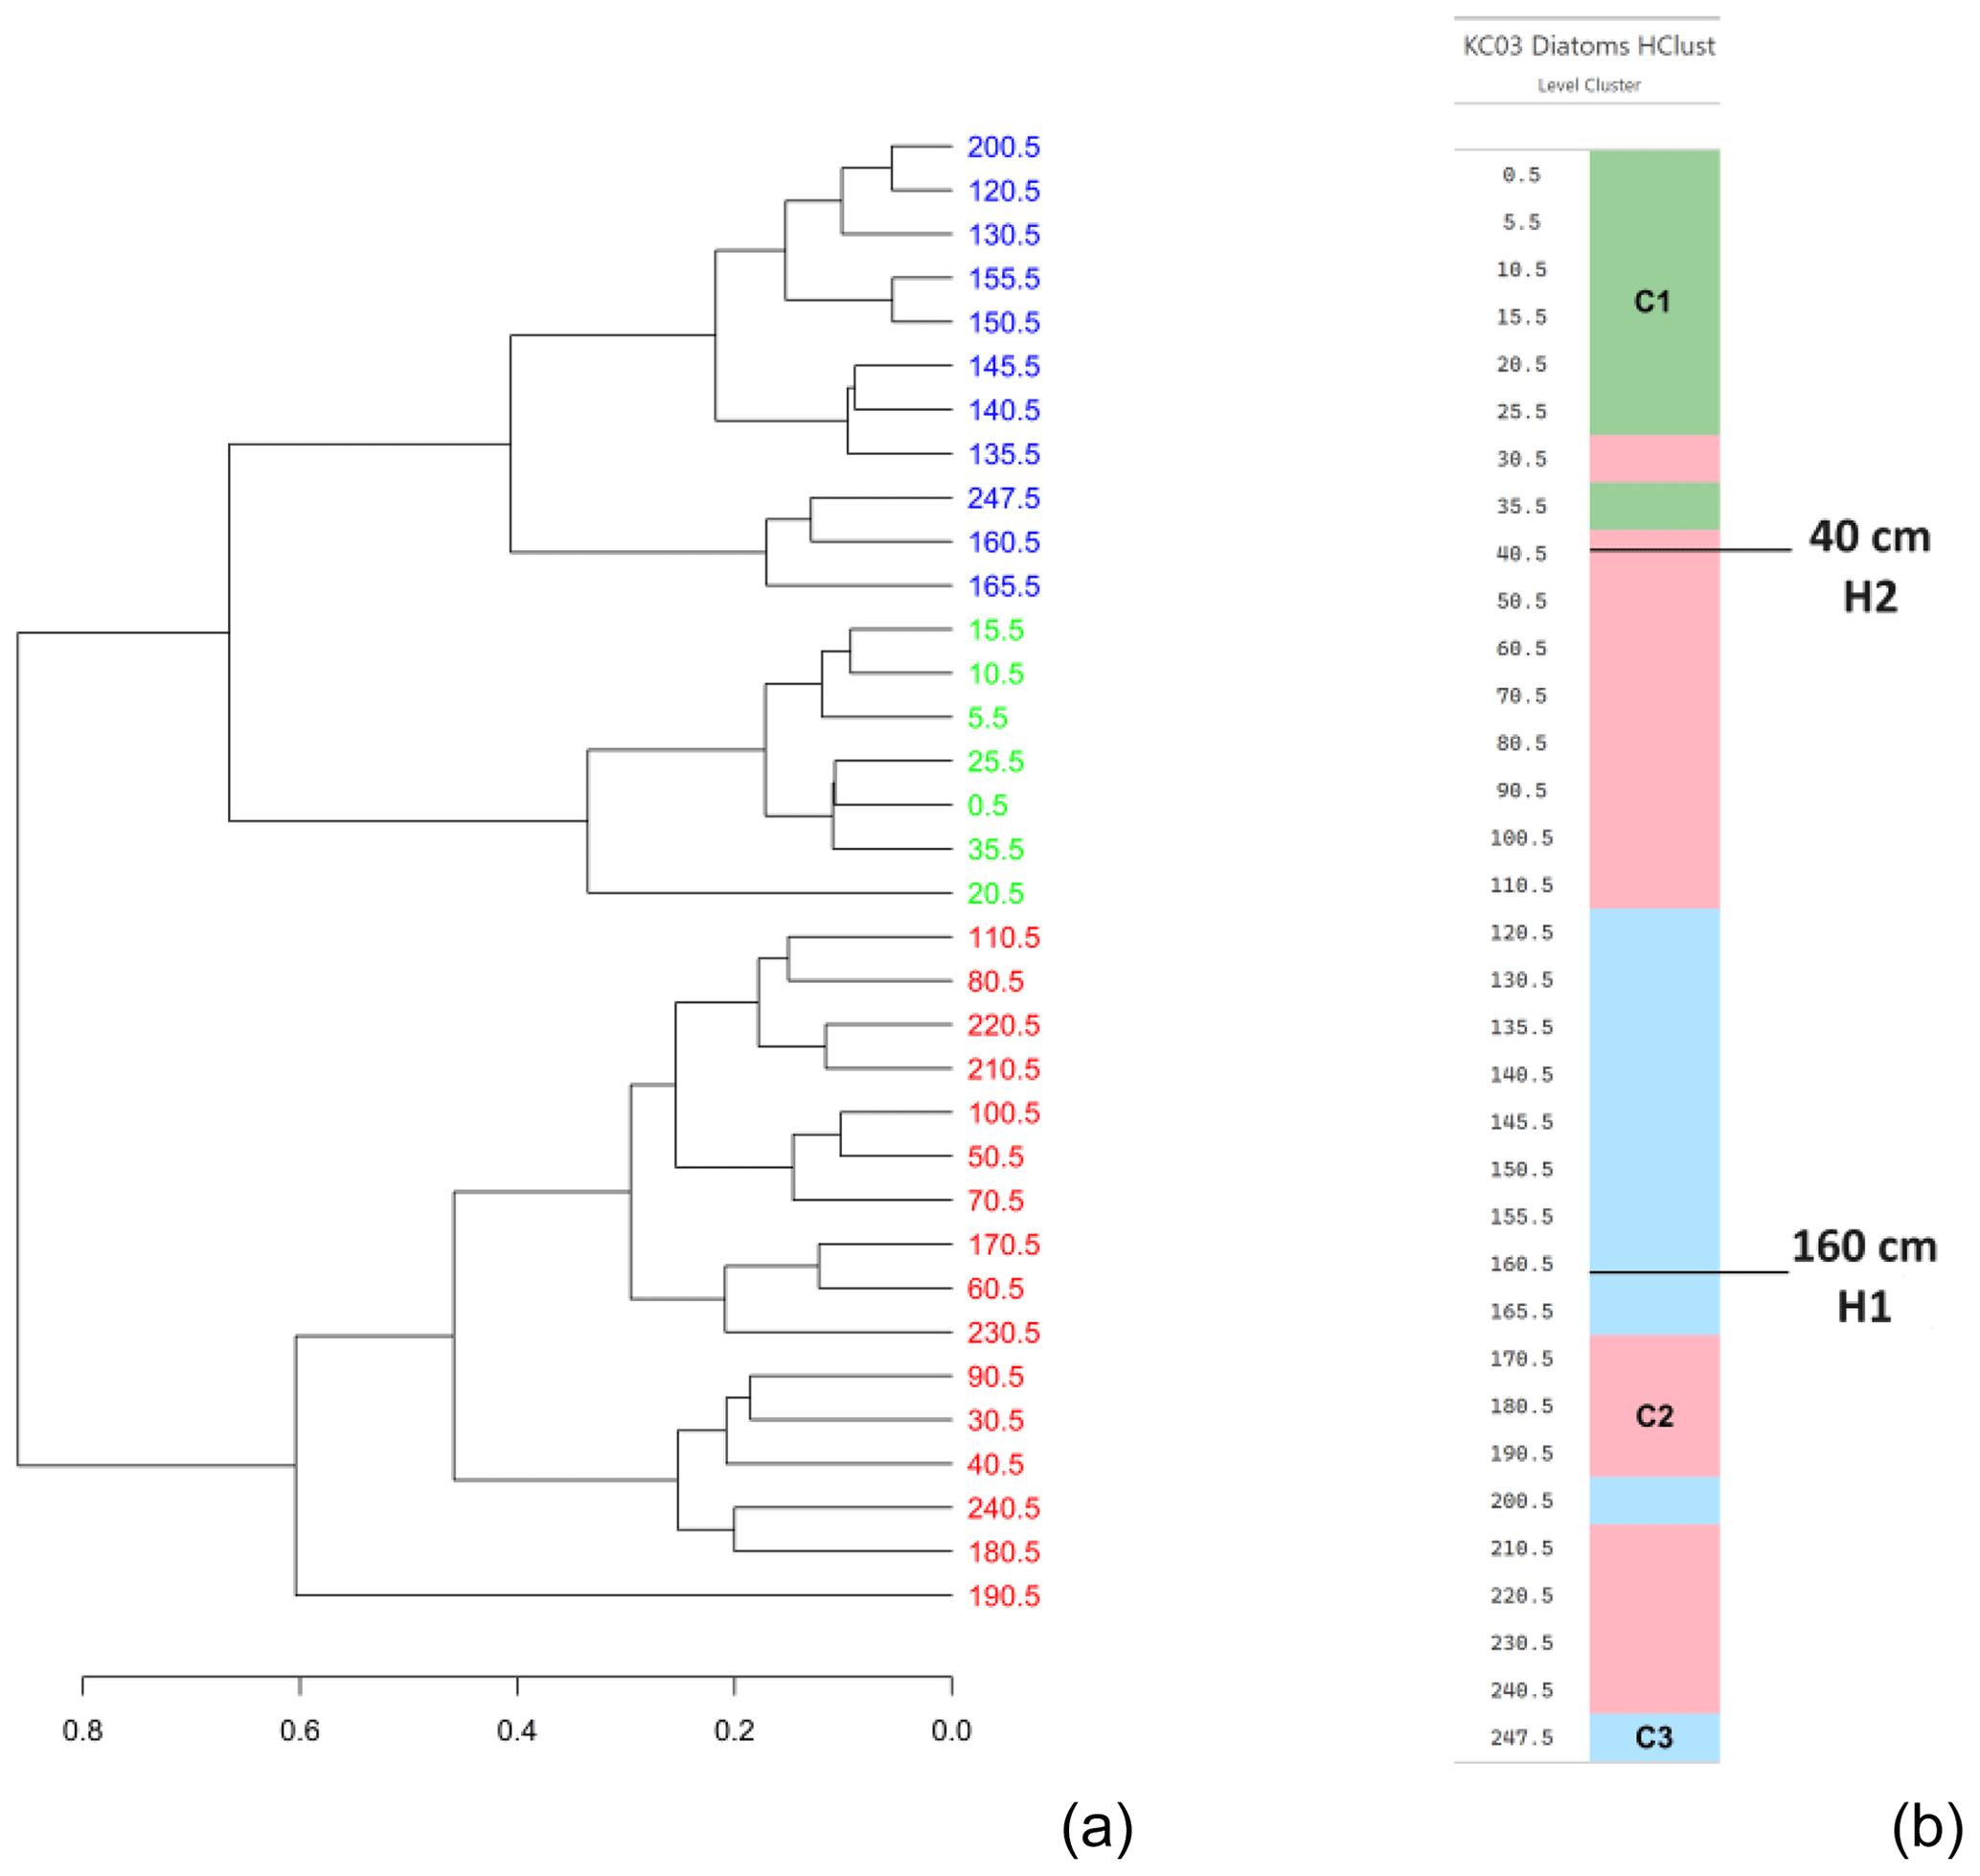
Figure 10(a) KC03 cluster dendrogram. (b) KC03 log clusters. (C1) Green cluster. (C2) Red cluster. (C3) Blue cluster (Table S2). The similarity degree is calculated on the first three branches with a dissimilarity between 0.8 and 0.6.
4.6 Radiocarbon chronology
For more information, please see Table 3.
Table 3Table showing radiocarbon ages calculated for each sample, the LCO correction, the ΔR used, and the final corrected and calibrated age.
4.7 XRF data
The sediment geochemistry inferred by the XRF data shows distinct changes downcore, along with changes in grain size (Figs. 11 and 12a and b). For both KC03 and PC03, the terrigenous inputs tracked by and ratios vary with the percent clay, with higher associated with a greater proportion of clay (Figs. 12a and b). The , , and ratios co-vary with the percent silt, with high values associated with high-silt percentages. ratios in minerals have been shown to vary with grain size, such that Rb is enriched in the fine fraction during mineral sorting (Blum and Erel, 1997). The ratios show a similar trend to (not shown), which are consistent with values (see Table S1 for PC03 cluster parameters). ratios have been used as a proxy for bottom-current strength, where silt size fractions tend to have lower-Rb concentrations (Wu et al., 2020).
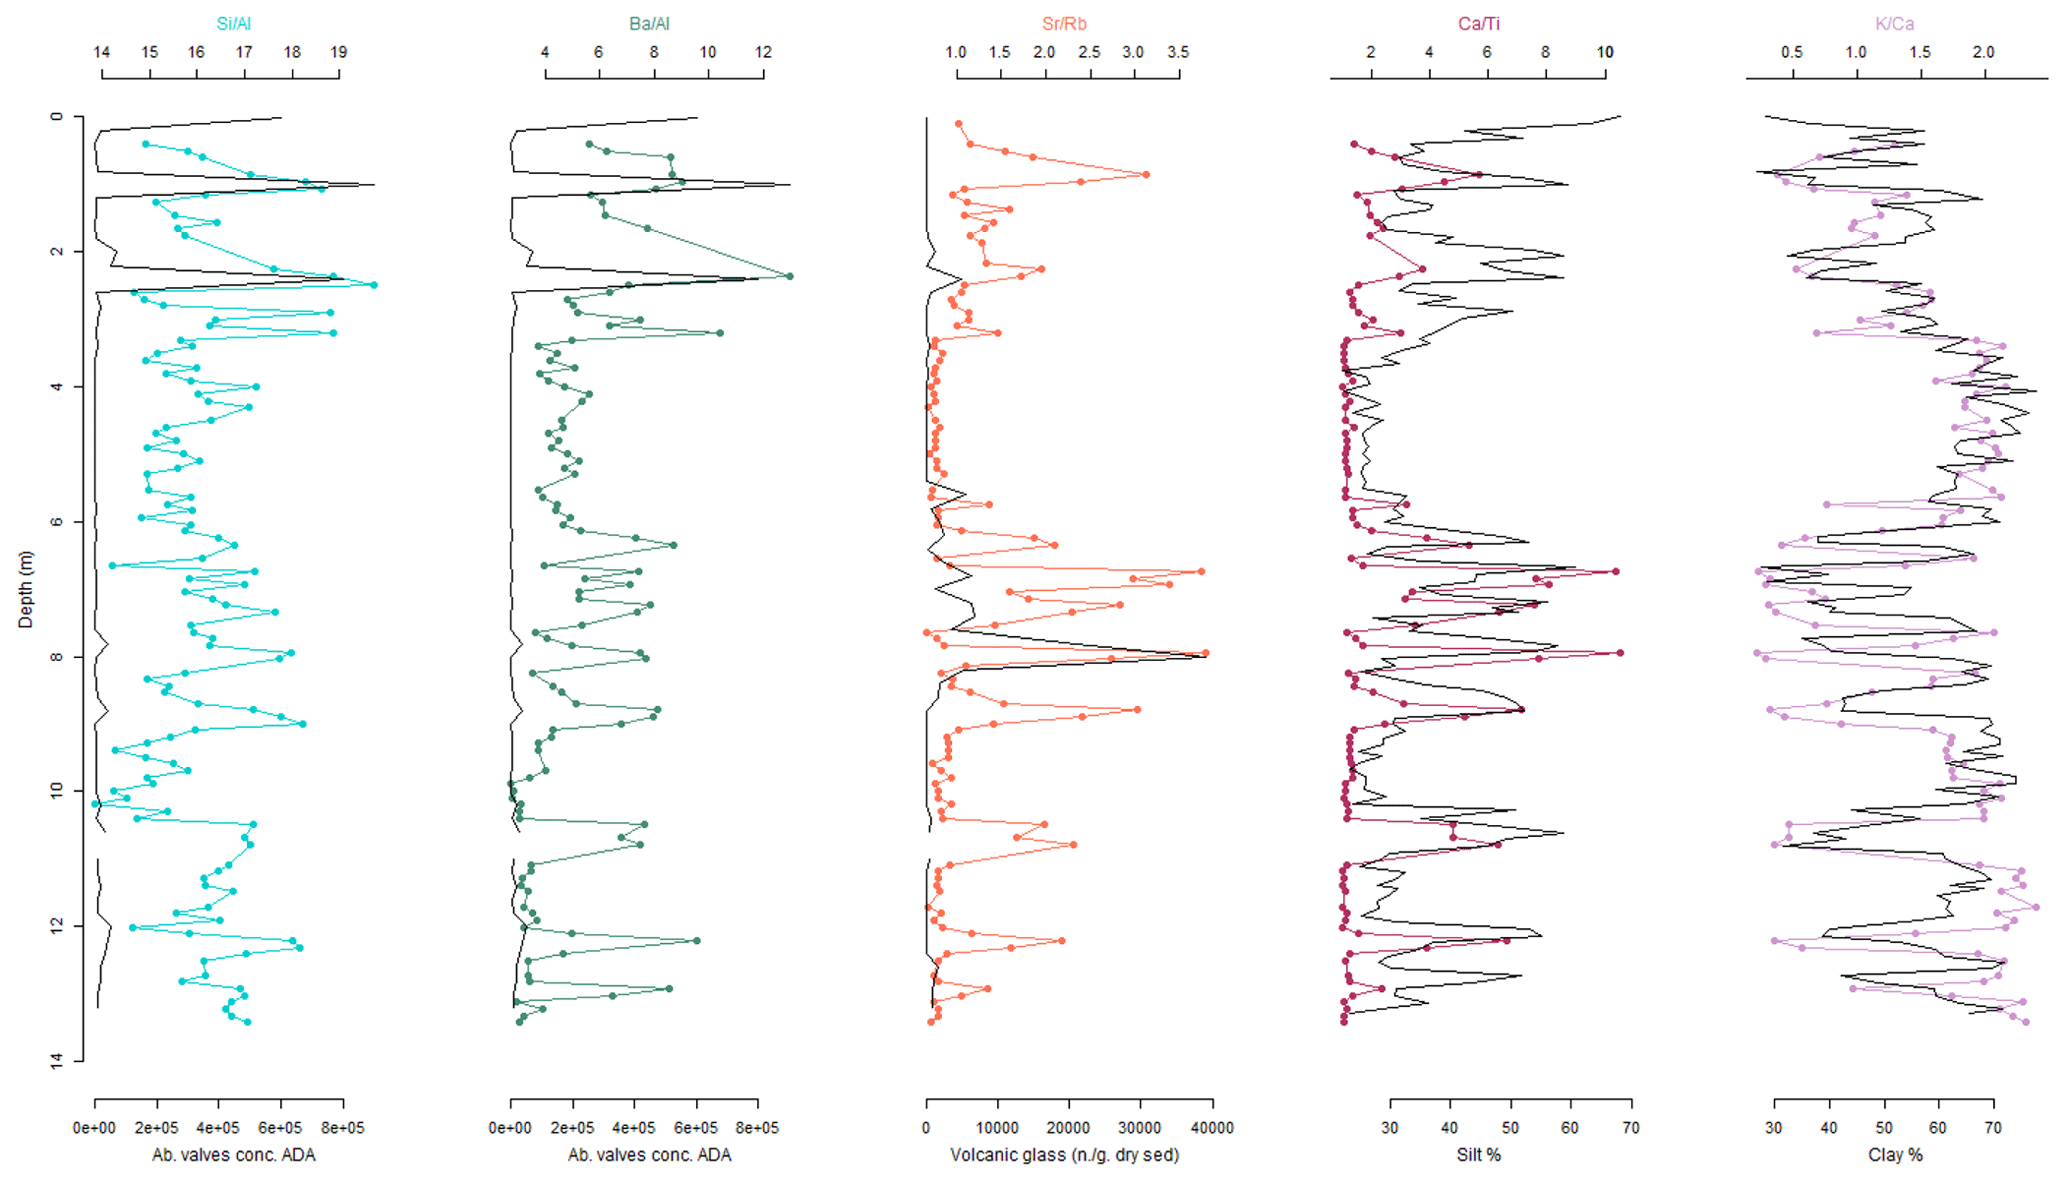
Figure 11PC03 absolute diatom counts, volcanic tephra, and silt and clay percentages versus XRF productivity proxies in and . The silt percent varies with and ratios, while the clay percent varies with .
In general, or have been correlated to interglacial periods associated with higher biological productivity and periods of stronger contour current flows and higher ventilation, while high ratios of and high-clay percentages can be considered a proxy for lithogenic accumulation inputs in sediment during glacial periods (Presti et al., 2011; Jimenez-Espejo et al., 2020).
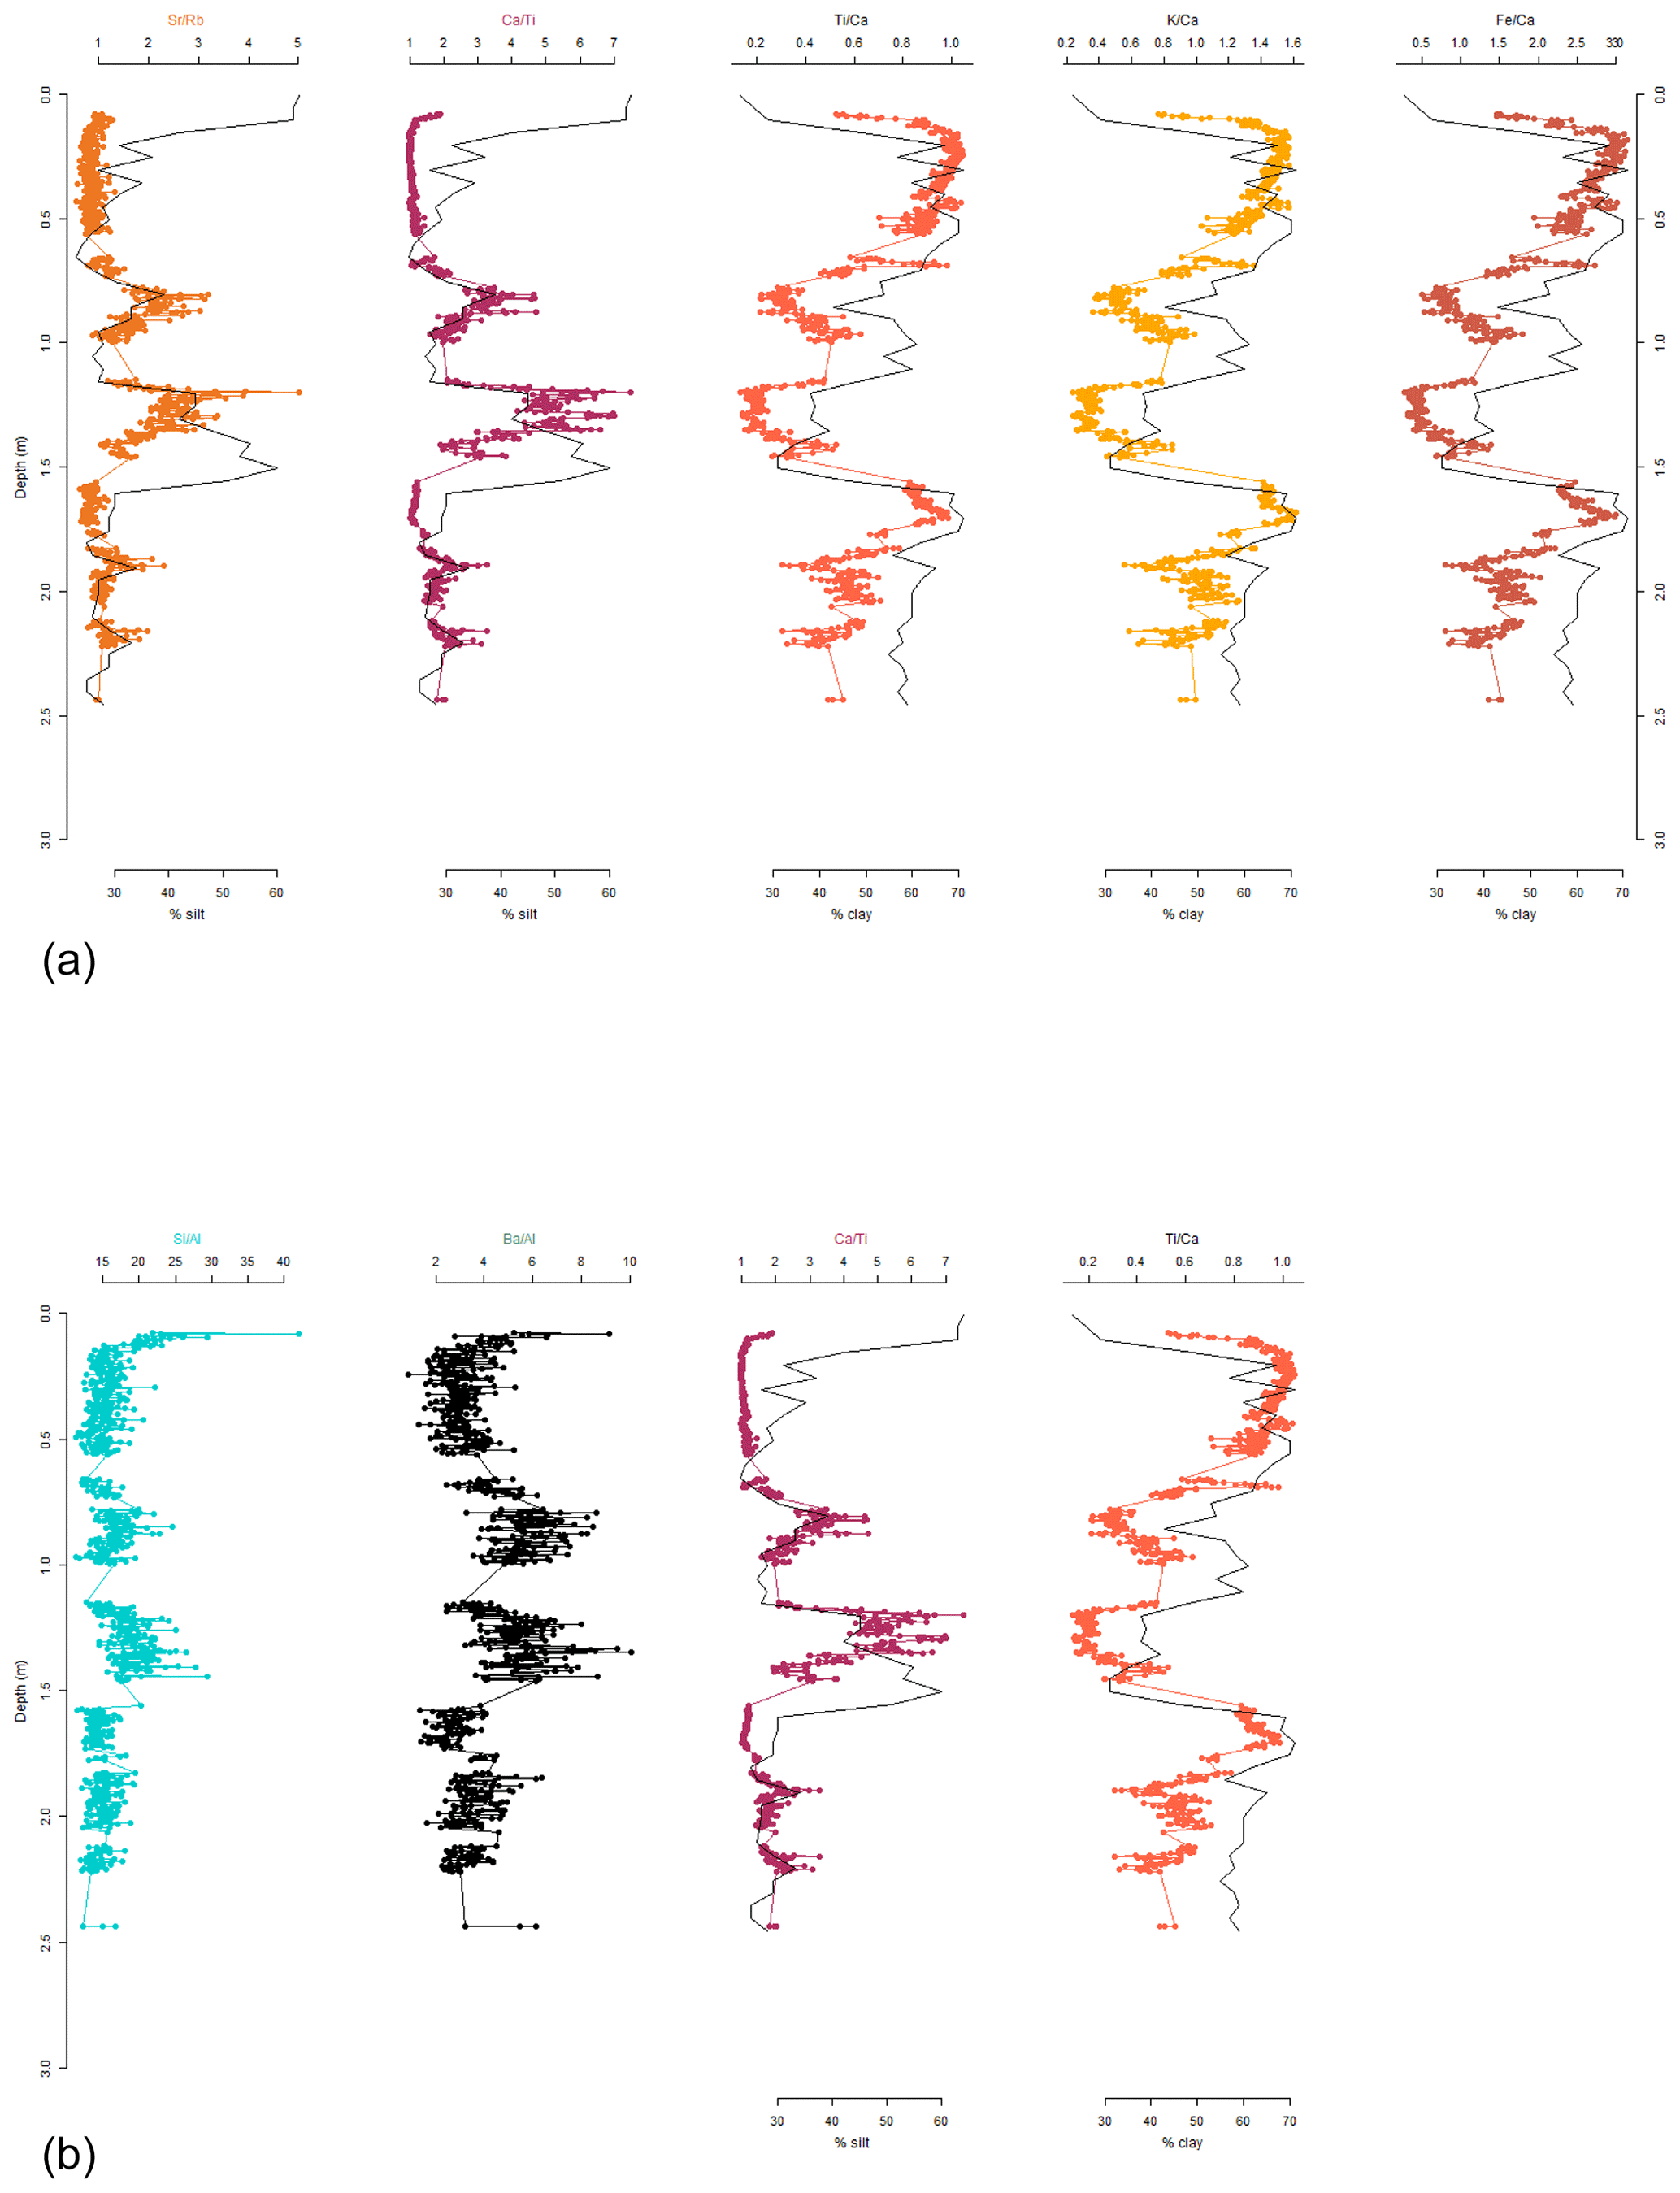
Figure 12(a) KC03 XRF data of the main sediment geochemistry tracers plotted and compared with percent clay and silt (the end-member controlling sediment composition). The coarser units have higher and ratios, while the clay fraction and , , and co-vary. (b) Comparison of biogenic tracers and ratios, as well as the ratio, with silt percent and clay percent.
The studied stratigraphic sequences are composed of distal muddy sub-ice-shelf/seasonal open-ocean sediments on the continental rise. Their location, on a ridge, exposes the sediment to density currents and overflows, as well as barotropic currents and intermittent processes, linked to climate (Rebesco et al., 2014; Smith et al., 2019). The multiproxy sediment analyses, coupled with the seismostratigraphic record, have allowed us to reconstruct the paleoenvironmental evolution of the study site since the late Pliocene (Fig. 13). Magnetostratigraphy and radiocarbon data (Table 3) from the PC03 core indicate a discontinuous sedimentation rate with some main slide events like hiatus 1 (PC03 H1), possibly reflecting an EAIS melting phase; hiatus 3 (H3), comprising the cooling event at 2.85–2.6 Ma; and hiatus 4 (H4), corresponding to the Matuyama–Bruhnes reversal involving a stratigraphic sequence from 0.773 Ma to ca. 25 kyr. In fact, the eastern flank of the Minang-a Ridge was affected by recurrent sediment slides of variable magnitude, as evidenced by sharp contacts that correspond to changes in silt and sand and abundance, magnetopolarity changes, qualitative and quantitative changes in diatom content, and volcanic glass content. The yellow reflector (Fig. 5), which lies at an approximate depth of 900 cm, corresponds to the main late Pliocene mass movement (H3). Above this reflector, the semi-transparent facies, representing the material filling the niche slide (middle part of the core), is upward bounded by a pink reflector at ca. 450 cm. This corresponds approximately to H4, which marks the transition to a well-layered stratigraphic sequence progressively thickening toward the Minang-a Canyon axis.
We hypothesize that the main late Pliocene submarine slide (above the yellow reflector; Fig. 5) would have modified the paleo-topography by increasing the slope inclination of the seafloor, which was then prone to generating subsequent smaller-scale slides. In fact, several sharp contacts (hiatuses from PC03 H1, H2, and H3) can be recognized; H1–H2 represent a significant break in sedimentation and the passage from polarity C3 to polarity C3.3n (3.59 Ma). Another sedimentary break is recognizable in the middle part of the core (at 900 cm) as PC03 H3 (Fig. 13), corresponding to 2.59 Ma at the Pliocene–Pleistocene transition (GPTS 5J). In Fig. 5, the yellow reflector corresponds to changes in lithology, SS mean, and diatom assemblage (H3 in Fig. 13). The tephra layer with maximum abundances at 800 cm marks this middle section (Fig. 3b), while a gradual increase in clay fraction is noted from 400 cm upward, suggesting continuous sedimentation from 500 cm to about 300 cm (Figs. 3 and 4). It should also be noted that this is, at present, the first discovery of a tephra level in the Aurora Basin area and that the tephra intervals are often identified in sedimentary sequences as altering the normal magnetostratigraphic record (Touchard and Rochette, 2004; van der Bilt et al., 2021). Moreover, this higher non-biogenic-silica level may have provided a weak zone in the sediment sequence that facilitated the late Pliocene failures (Urlaub et al., 2018; Gatter et al., 2021; Gales et al., 2023). In addition, Pleistocene interglacial sediments, characterized by high-diatom content (Volpi et al., 2003; Urlaub et al., 2015, 2018; Holder et al., 2020), may have facilitated slope instability.
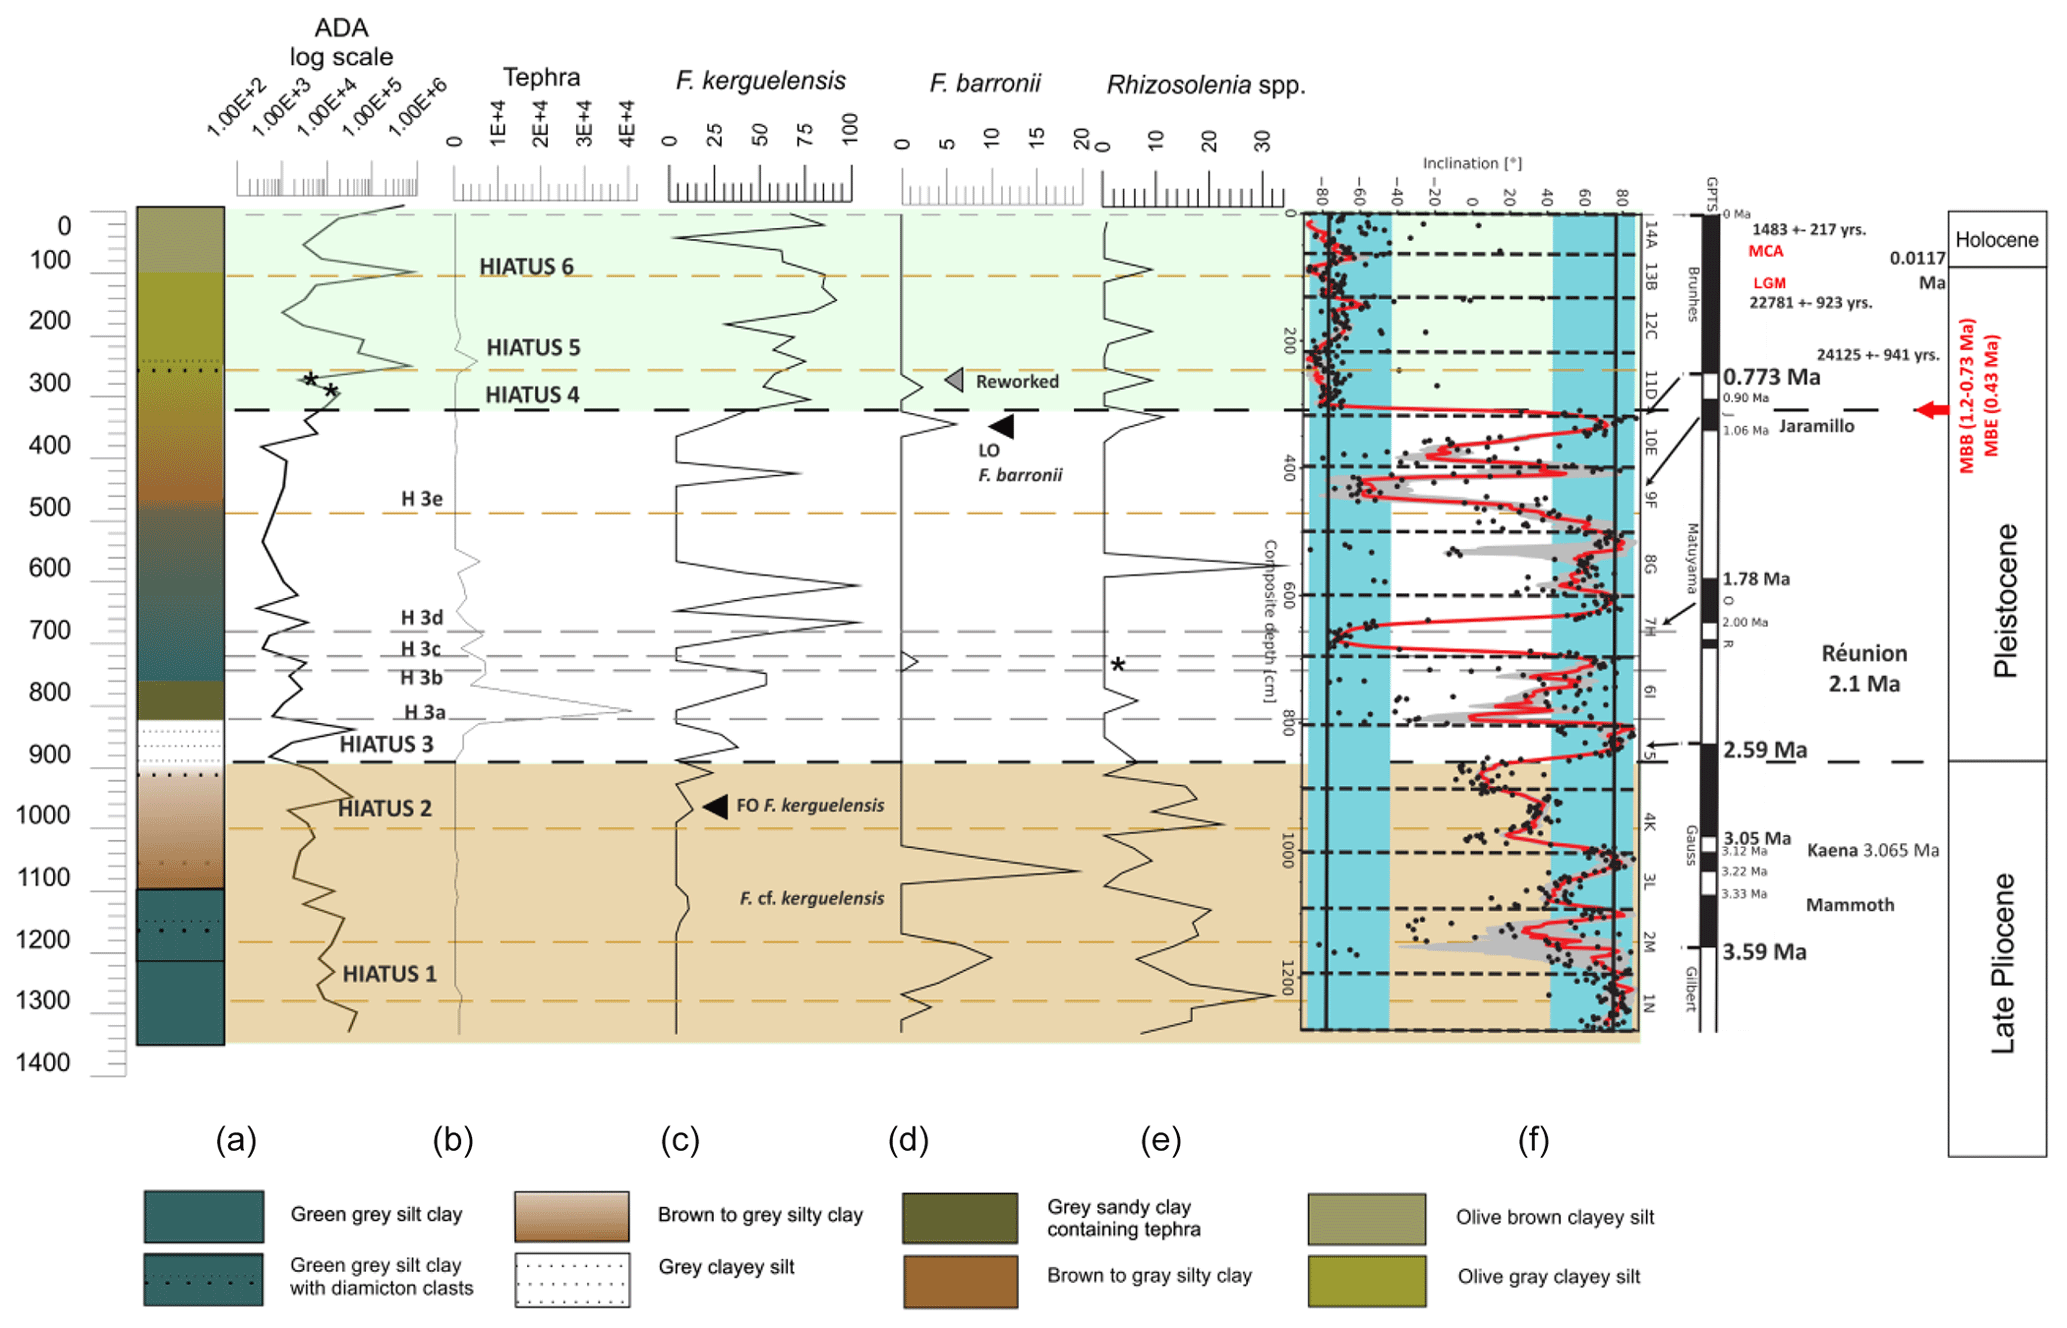
Figure 13PC03 core age model compared with age–depth profile and biostratigraphic data (see Table 2). Lithology, ADA values, and tephra content with biostratigraphic data (last occurrence datum, LOD – Fragilariopsis barronii; first occurrence datum, FOD – F. kerguelensis), magnetostratigraphy, and a radiocarbon dataset (Table 3) are shown.
Dashed lines highlight the main lithological changes and sedimentological disturbances, such as hiatuses or currents washing events (H1 up to H6), coupled with biostratigraphic events. Comparing the magnetostratigraphic dataset, biostratigraphy, and radiocarbon data, some of the main climatic events and transitions have been temporally identified. The Matuyama–Brunhes boundary is identified at ca. 0.773 Ma during marine isotope stages (MISs) 19–18. The Mid-Pleistocene Transition (MPT) or Mid-Pleistocene Revolution (MPR) is marked between 1.2 and 0.8 Ma, along with the Mid-Brunhes Event (MBE) at about 0.42 Ma BP for MISs 12–11 (Legrain et al., 2023; Head et al., 2021; Haneda et al., 2020; Lisiecki and Raymo, 2005).
The chronology of the core is developed by the magnetostratigraphic and biostratigraphic dataset (Fig. 13). A sequence of normal or reverse polarity, ranging from ca. 3.6 Ma, with a major change from the reversed C1r.1r to normal C1rn (MPT Event at 0.78 Ma or MBE at 0.43 Ma (Figs. 6 and 13), is recorded at 324 cm at hiatus 4 (PC03 H4).
PC03 H4 prevents any sedimentary sequences associated with the MPT being preserved in PC03. Lithostratigraphic and magnetostratigraphic data highlight a change at 1.08–1.06 Ma. This age corresponds to a super interglacial MIS 31, linked to a specific alignment of orbital parameters and ice sheet–ocean–climate feedbacks that lead to a major warming event (Berger and Loutre, 1991; Beltran et al., 2020). We have no direct evidence for a super-interglacial but do record H4 at this time. This timing of PC03 H4 and H5 occurred during the transition from the MPT at ca. 1.2–0.773 to the MBE at ca. 0.43 kyr, i.e., the two major climatic changes associated with a non-linear response of the Earth system to orbital forcing and to an increase in interglacial intensity (Legrain et al., 2023; Wilson et al., 2022).
The PC03 downcore records a change the silty fractions and in the sortable silt values (see the correlation between SS and SS %, following Lucchi and Rebesco, 2007; Rebesco et al., 2014; McCave et al., 2017; McCave and Andrews, 2019; Salabarnada et al., 2018; Ha et al., 2022), which presents, during the late Pliocene and the Mid-Pleistocene Transition, a current velocity range from 20–30 up to 23–35 cm s−1. This suggests an upward increase in the current dynamic, unsteady, and potentially discontinuous sediment accumulation with downslope-predominant sedimentary processes. This upward change in the current dynamics is accompanied by changes in diatom assemblages linked to different water mass influxes, oceanographic evolution, and reworked diatom content. The downcore distribution of the geochemical elements suggests that increased and ratios correspond to silty fractions, which we interpret as correlated to stronger bottom currents and with possible terrigenous material supply or weathering. In contrast, higher ratios are observed in the clay-rich fractions, as observed in other Southern Ocean cores (Escutia et al., 2011; Wilson et al., 2022; Salabarnada et al., 2018; Hillenbrand and Fütterer, 2001; Konfirst et al., 2012). The ratio coupled with diatom abundance confirms the strong link between silty factions, stronger currents, and biological productivity during warmer climate intervals (Figs. 11 and 12a and b).
We suggest that, for the PC03 sediment core, this interpretation is a response to changing climatic conditions since the late Pliocene.
-
Base–H3 (base – 880–900 cm; cluster 3–2). The basal section of PC03 is mid–late Pliocene in age (Fig. 14), containing both in situ late Pliocene diatoms, such as F. kerguelensis and its ancestor F. barronii. The biostratigraphy is in agreement with the magnetostratigraphic record. Reworked diatoms from the Eocene–Oligocene and Miocene are present as well and probably eroded from proximal–regional shelf outcrops and were transported along-slope. Sharp contacts (H1 and H2) may represent the scar surfaces of two late Pliocene sliding events linked to two of the three highest global mean sea levels (between 3.3 and 2.85 Ma). These events, identified initially in the seismic profile (yellow reflector in Fig. 6; Figs. 13 and 14), were confirmed by the lithologic and biostratigraphic data and suggest the late Pliocene formation of a basal sediment slide scar on the Minang-a Ridge (Fig. S6). The productivity proxies, and (Fig. 13), may not record a change in the biological productivity; given the low-diatom abundances recovered, the micropaleontological data are more difficult to interpret as an indicator of productivity. This may be due to a combination of poor preservation and/or amplified winnowing, in this sector, by late Pliocene cryosphere and ocean–atmospheric evolution (Escutia et al., 2009; Bart and Iwai, 2012; Zhang et al., 2013; Scherer et al., 2016; Donda et al., 2020; Tangunan et al., 2021; Siegert et al., 2023). The overall assemblage, dominated by F. barronii and F. kerguelensis, suggests an environment similar to the Permanently Open Ocean Zone (Crosta et al., 2005). The relative warmth of this time period in Antarctica has been already widely reported (Scherer et al., 2007; Escutia et al., 2009; Winter et al., 2012; Crampton et al., 2016) and associated with mid–late Pliocene sea level highs (global mean sea level) that are recorded during the Piacenzian, between 3.9 and 3.3 Ma (Bohaty et al., 2003; Dowsett et al., 2016; Grant et al., 2019; Dumitru et al., 2019).
-
H3–H3a (880–820 cm; alternation between clusters 3, 2, and 1). This section is marked by an enrichment in volcanoclastic glass (Figs. 4b, 13). The possible sources of this layer are Heard or McDonald islands on the Kerguelen Plateau or a Transantarctic Mountain volcanic activity (Pompilio et al., 2007; Prentice et al., 2022; Di Roberto et al., 2019, 2021). Based on the magnetostratigraphic record, this event occurred at about 2.85–2.6 Ma, i.e., the Late Plio-Pleistocene transition (Fig. 13). The Gauss–Matuyama chron transition at 2.59 Ma and the Réunion subchron (2.1–2.2 Ma) are speculatively located within 5J and within 6I, respectively (Fig. 13); however, the erratic ChRM inclinations and the full normal polarity inclination results are biased. Climatically, it corresponds to the last phase of the Piacenzian cooling event (M2), related to sea ice expansion, with changes in South Atlantic deep-water ventilation and to diatom species turnover (Hodell and Venz-Curtis, 2006; Whitehead et al., 2006; McKay et al., 2012; Scherer et al., 2016; Ishino and Suto, 2020).
-
H3a–H3d (820–680 cm; alternation between clusters 3, 2, and 1, with cluster 3 decreasing upwards). This section of the core is marked by a magneto-polarity changing record (Xuan et al., 2020) and by a more energetic environment with frequent slides and moat fillings (Fig. S6). Tephra grains reach their maximum abundance (at 800.5–780.5 cm), but they are present throughout this section, up to ca. 560 cm, as reworked grains and with decreasing abundance. This section includes the Mid-Pleistocene Transition (MPT at 1.2–0.8 Ma in Legrain et al., 2023, and Tachikawa et al., 2020) but with a low-sedimentation rate.
-
H3d–H3e (680–480 cm; alternation between clusters 1, 2, and 3, with cluster 3 decreasing upwards). This section is characterized by a sharp contact at 495 cm and by some interbedded red to brown silty clay (about 2.5 cm thick) up to 465 cm. Higher values of the bioproductivity proxies, including open-ocean diatom assemblages and sea ice ones as accessories, suggest a period of warmth. However, the very low-diatom concentration suggests that increased current strength, supported by and SS % values, may have winnowed diatom valves. The H3e discontinuity, evidenced by lithology and magnetostratigraphy, and dated at the beginning of the Jaramillo geomagnetic event at about 1.06 Ma, could be due to the Pleistocene super-interglacial MIS 31 (1.085–1.055 Ma). This interval of time was associated with large oceanographic changes and a shift in the polar front and with higher-diatom productivity events which may have given rise to biosiliceous layers that facilitated instability and slides in a highly dynamic environment (Lisiecki and Raymo, 2005; Konfirst et al., 2012; Yin and Berger, 2015; Justino et al., 2017; Beltran et al., 2020; Duffy et al., 2022).
-
H3e–H4 (480–320 cm; alternation between clusters 2 and 1). The polarity of the Brunhes–Matuyama transition spans into this section (from the top of 10E into the base of 11D in Fig. 6) (Haneda et al., 2020) and provides an age marker of 0.773 Ma with multiple normal polarity subchrons within the Matuyama chron (the 0.78–0.90 Ma Jaramillo and the 1.78–2.00 Ma Olduvai subchrons). The bottom of this section is marked by a sharp lithologic change from silty sediment to mostly olive green clay. At H4, 320 cm, the magnetostratigraphic dataset records a sharp change from reversed C1r.1r to normal C1rn, fixing this event at 0.773 Ma (Fig. 13). The sediments observed here result from near-ice-margin processes, and their very low-diatom content suggests perennial ice cover, limiting diatom primary production but not potential microbial activity. Perennial sea ice cover could be related to local atmospheric circulation and to a response to the Atlantic Meridional Overturning Circulation (AMOC) and interhemispheric heat transport linked to the Mid-Bruhnes Event (Colleoni et al., 2018; Wilson et al., 2022) (Fig. 12 in Lisiecki and Raymo, 2005; Legrain et al., 2023).
-
H4/H6 – top (320–0 cm; cluster 1). The normal-polarity Brunhes chron (0–0.773 Ma) is clearly identifiable in this section (Fig. 6 from 14A to 11D). The radiocarbon dataset confirms the latest Pleistocene age of this section of core dated to MIS 3. Its stratigraphic location, just a few centimeters above sediments deposited during the MBE, suggests another hiatus (H4) during the mid–late Pleistocene. The diatom assemblage in this section is indicative of a modern seasonally open-ocean environment dominated by F. kerguelensis (Fig. 7h), while even the lowest correlation between and SS % and the lower current speeds (12–19 cm s−1) suggest a change in the dynamics of the environment and a lower confidence in the applicability of to bottom-current reconstruction due to grain size interference from the diatoms.
After the MBE, the cyclicity at 100 kyr was characterized by an increased amplitude in the glacial–interglacial cycles with major interglacials (MIS 5, MIS 7, MIS 9, and MIS 11 for MBE) and by warmer waters, up to 2–4 °C, with implications for sea ice cover, CO2, and temperature (Jansen et al., 1986; Wilson et al., 2022). Due to the occurrence of PC03 H4, sediments recording glacial–interglacial periods, from approximately 0.773 Ma to 0.025–0.023 Ma (ca. 800 kyr), are missing from this core (Figs. 13 and 14).
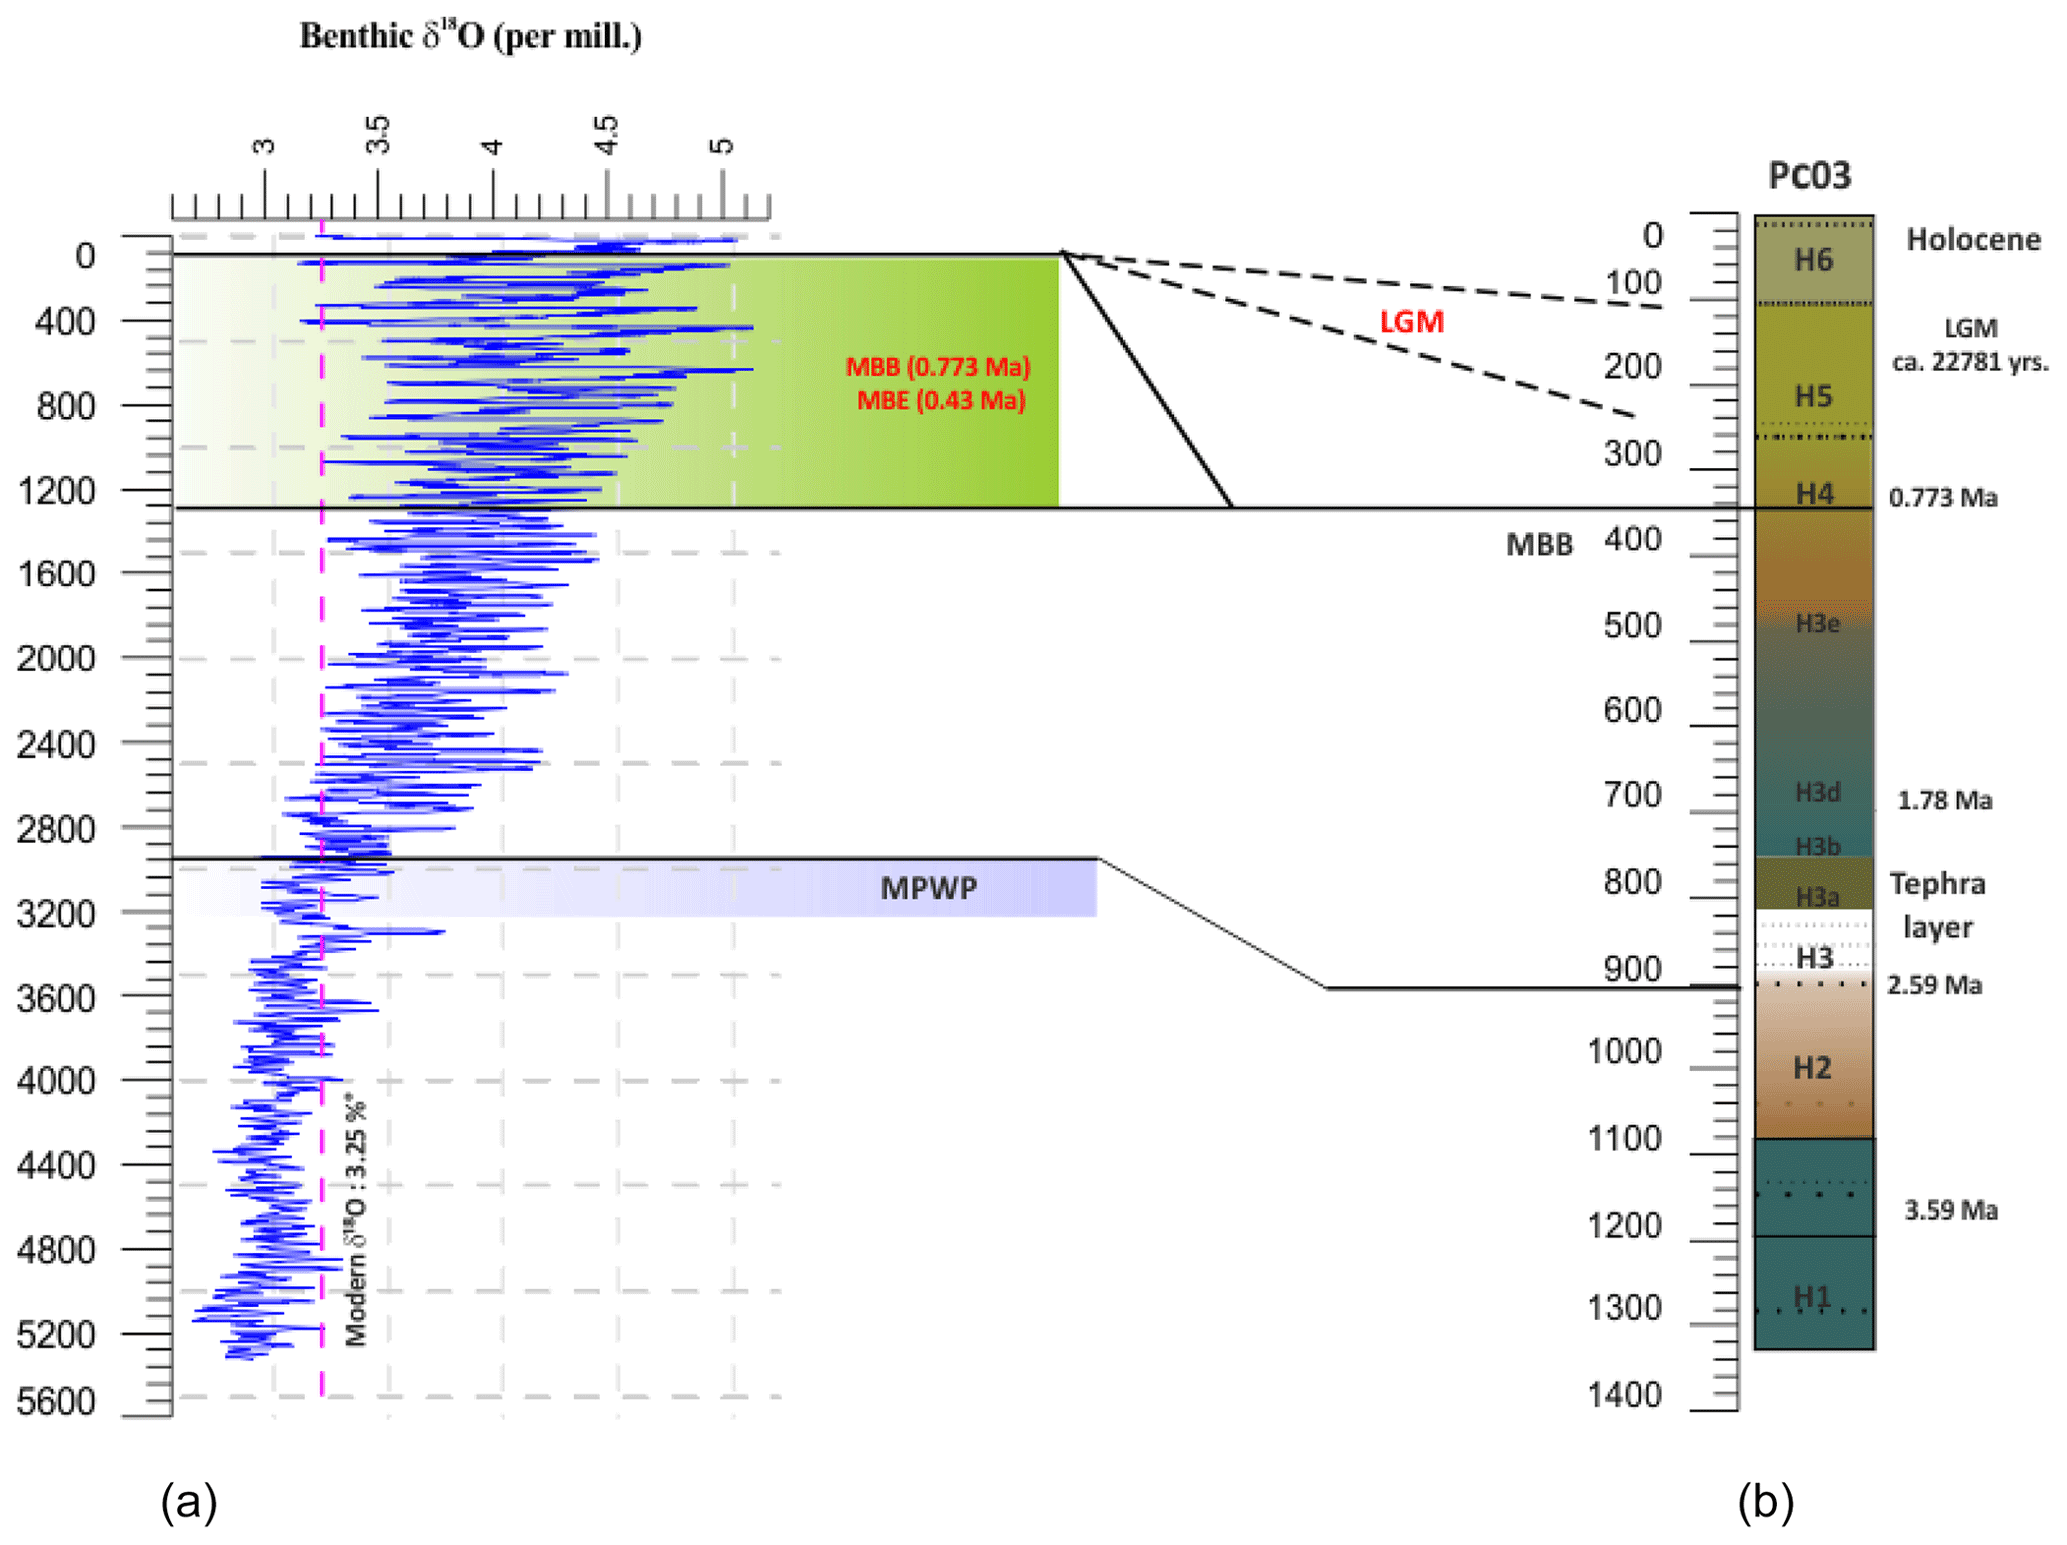
Figure 14Benthic δ18O isotope stack from Lisiecki and Raymo (2005) (a) compared to the PC03 core lithostratigraphic log and the main identified hiatuses (H1 and H2, H3, H4, and H5 and H6). The dotted pink line represents the modern δ18O isotopic composition. The blue box highlights the mid-Pliocene Warm Period (mPWP) (Grant et al., 2023). The green box highlights the lost stratigraphic sequence from 0.773 Ma up to the LGM, comprising the Mid-Pleistocene Transition (when high-amplitude ∼ 100 kyr glacial–interglacial cycles replaced the more subdued ∼ 40 kyr glacial–interglacial cycles in the Benthic δ18O isotope) and comprising the geomagnetic Matuyama–Brunhes boundary (MBB), the MBE, and part of the mid–late Pleistocene (Naish et al., 2009; Legrain et al., 2023). The dotted black lines join the isotopic curve with the corresponding LGM sediments, presenting H5 and H6. The most superficial sediments (overlaying H6) are Holocene in age.
All data and analyses from KC03 core are comparable with PC03 in terms of facies type and biosiliceous content, characterized by the modern diatom assemblages dominated by F. kerguelensis with a secondary sea ice component and age (attributed to MIS 3 up to the LGM and deglacial phase) to the upper part of PC03. Comparison between the biogenic tracers ( and , as well as ratios) and silt–clay fractions, reveal some slight offsets which may reflect the depositional selection on the geochemistry tracers due to current origin–transport and/or changes in depositional processes, such as differences in composition of the silt component of the plumes through time.
The sedimentary sequences in the two cores presented here, PC03 and KC03, record the Pliocene–present and Late Pleistocene–Holocene (LGM) sedimentary response to a range of processes, with the most prominent of them being the recurrent landslides and erosion events (Figs. 13 and 14). The instability of the Minang-a Ridge flank was probably amplified by its topography, by the presence of biosiliceous layers deposited during major interglacials (Holder et al., 2020), and by the presence of the tephra layer. Both of the last characteristics have the potential to generate slope failure by changing the sediment geotechnical properties and porosity (Alves, 2015; Wiemer and Kopf, 2015; Gardner et al., 2023; Gales et al., 2023; Donda et al., 2024), and this may have affected even the mid-section of the piston core.
This study highlights the late Pliocene–present sedimentary record of part of the Sabrina Coast slope and rise, a region seaward of the Sabrina–Aurora subglacial basins, important in terms of its ice volume and current studies documenting ice loss (McCormack et al., 2023; Donda et al., 2023; Allen et al., 2022; Holder et al., 2020; O'Brien et al., 2020; Post et al., 2020). The provenance area of the two sediments, IN2017-V01-A006-PC03 and KC03 cores, analyzed in this study, corresponds to the upper part of the Minang-a Ridge flank. This area has experienced recurrent slide events, probably amplified by its topography and inclination and the regional evolution of margin drift with probable influence from isostatic rebound and volcanic and seismic activities, as well as changes in oceanographic and morpho-sedimentary processes. A dynamic large-scale Plio-Pleistocene evolution of the marginal drift can be hypothesized. We observe alternations in biosiliceous productivity depositional events (linked to more productive mCDW inland) and erosion at the base of the canyon flank due to bottom currents and turbiditic events during extreme interglacial to glacial periods of the last 2.5 Ma (Tolotti et al., 2019; Donda et al., 2024; Mudelsee and Schulz, 1997; Siegert et al., 2008, 2023; Passchier, 2011; Grant, 2012; Bart and Iwai, 2012; Cook et al., 2013; Rebesco et al., 2014; Laake and Wolfe, 2015; Laake and Hernandez-Molina, 2023; Hernández-Molina et al., 2016; Stow and Smillie, 2020).
The multiproxy, seismostratigraphic, magnetostratigraphic, and biostratigraphic sediment analyses allowed us to highlight the following key aspects:
-
Lithological, sedimentological, and geochemical facies, coupled with a seismostratigraphic and magnetostratigraphic dataset, can help in identifying the seismostratigraphic facies and the ice sheet dynamics during major climatic events.
-
The occurrence of siliceous biogenic and tephra deposits facilitated the sliding events, mainly during the late Pliocene (period in which huge paleoclimate changes took place) or Pleistocene glacial–interglacial cycles (Gales et al., 2023, and references therein).
-
The sedimentary biosiliceous content, particularly diatoms, contributes not only to the biostratigraphic and depositional environmental definition but also as potential water mass tracers as correlated to sediment and geochemical components. High-biosiliceous content in sediment affects the stability of the slopes, linked to the balance among the previous morphology, the sedimentary load, and the activity of the bottom currents (critical depositional speed, eddy, internal waves kinetics, etc.) (Rodriguez et al., 2022).
-
For the first time in the study area, a tephra layer, a promising correlation tool of unknown origin, has been identified. It derives from late Pliocene–Early Pleistocene volcanic activity and can provide insights into paleo-volcanic activity, whose petrogenetic province and source could be identified by focused petrographic and tephrochronological analyses.
Unfortunately, due to the recurrent sediment slides, the Plio-Pleistocene sedimentary record is incomplete. The record lacks some of the main biostratigraphic events and does not contain a continuous or comprehensive history of diatom assemblage evolutionary turnover (Cortese et al., 2007; Giuliani et al., 2011; Ishino and Suto, 2020). However, our results highlight how important this area is for the reconstruction of the depositional environment influenced by sea ice cover, local sedimentary depocenter shifts, ocean influxes and bioproductivity, and their response to major climatic events (Fig. 12) (Hillenbrand et al., 2009; Close, 2010; Donges et al., 2011; Heywood et al., 2014; Dortmans et al., 2019; Florindo et al., 2022; Gales et al., 2023, and references therein).
Sediment core data are publicly available at https://doi.org/10.25919/5b7cf37d8ba76 (CSIRO et al., 2017).
The seismostratigraphic geophysical dataset, collected off the Sabrina Coast between 114 and 122° E, comprising Russian, Australian, and Japanese multichannel seismic profiles (MCS) are available through the Scientific Committee on Antarctic Research (SCAR) Seismic Data Library System (SDLS), in addition to the high-resolution MCS data acquired by the National Institute of Experimental Oceanography and Geophysics (OGS) in 2017 (Donda et al., 2020, 2023).
Magnetic susceptibility data for PC03 are kept at the ANU. The 11-point moving average inclinations and uncertainties used in Fig. 7 are available in Table_S1_Magnetic_Susceptibility_PC03.xls and Table_S2_Inclination results.xlsx.
Grain size data are archived in the Geoscience Australia Marine Sediments Database at http://dbforms.ga.gov.au/pls/www/npm.mars.search (Post, 2024).
Diatom data for PC03 and KC03 are archived with the Australian Antarctic Data Centre and can be accessed for PC03 at https://doi.org/10.26179/3f8v-tq32 (Tolotti and Leventer, 2022) and KC03 at https://doi.org/10.26179/5cad45a7cb140 (Leventer, 2022).
Contact Alix Post at Geoscience Australia, Canberra, ACT 2601, Australia (alix.post@ga.gov.au).
The supplement related to this article is available online at: https://doi.org/10.5194/jm-43-349-2024-supplement.
RT: investigation and writing (original draft preparation and review and editing). AL, FD, TN, XZ, DH, and AP: investigation and writing (review and editing). LA: conceptualization, funding acquisition, investigation, project administration, and supervision. PO: conceptualization, funding acquisition, investigation, supervision, and writing (review and editing). RR, AC, DC, and NC: investigation.
The contact author has declared that none of the authors has any competing interests.
Publisher’s note: Copernicus Publications remains neutral with regard to jurisdictional claims made in the text, published maps, institutional affiliations, or any other geographical representation in this paper. While Copernicus Publications makes every effort to include appropriate place names, the final responsibility lies with the authors.
This article is part of the special issue “Advances in Antarctic chronology, paleoenvironment, and paleoclimate using microfossils: Results from recent coring campaigns”. It is not associated with a conference.
We thank the Marine National Facility (MNF), the IN2017-V01 scientific party (led by chief scientists Leanne K. Armand and Phil E. O'Brien), MNF support staff, and ASP crew members (led by captain Mike Watson) for their help and support on board the R/V Investigator. We thank laboratory staff from Geoscience Australia for sediment grain size analysis. Alix Post publishes this work with the permission of the CEO, Geoscience Australia, under Creative Commons (CC BY 4.0). We are grateful to the Italian programma Nazionale di Ricerche in Antartide (PNRA), to the editors and to Reed Scherer, Laura De Santis, and Michele Rebesco for their scientific support.
This research has been supported by a grant of sea time on R/V Investigator from the CSIRO Marine National Facility, which is supported by the Australian Government's National Collaborative Research Infrastructure Strategy (NCRIS). This project has been supported through funding from the Australian Government through the Australian Research Council (grant nos. SR200100008 and DP170100557) and the Australian Government's Australian Antarctic Science Grant Program (grant nos. AAS 4333 and AAS 4419). Part of this study has also been supported by the Italian programma Nazionale di Ricerche in Antartide (PNRA) under the Totten Glacier dYnamics and Southern Ocean circulation impact on deposiTional processes since the mid-lAte CeNozoic project (TYTAN). Additional funding has been provided by the National Science Foundation Antarctic Integrated System Science Project (grant no. PLR-1143836).
This paper was edited by Masao Iwai and reviewed by Masao Iwai and one anonymous referee.
Abrantes, F., Gil, I., Lopes, C., and Castro, M.: Quantitative diatom analyses – a faster cleaning procedure, Deep-Sea Res. Pt. I, 52, 189–198, https://doi.org/10.1016/j.dsr.2004.05.012, 2005.
Aitken, A. R. A., Roberts J. L., van Ommen, T. D., Young, D. A., Golledge, N. R., Greenbaum, J. S., Blankenship, D. D., and Siegert, M. J.: Repeated large-scale retreat and advance of Totten Glacier indicated by inland bed erosion, Nature, 533, 385–389, https://doi.org/10.1038/nature17447, 2016.
Aitken, A. R. A., Li, L., Kulessa, B., Schroeder, D., Jordan, T. A., Whittaker, J. M., Anandakrishnan, S., Dawson, E. J., Wiens, D. A., Eisen, O., and Siegert, M. J.: Antarctic sedimentary basins and their influence on ice-sheet dynamics, Rev. Geophys., 61, e2021RG000767, https://doi.org/10.1029/2021RG000767, 2023.
Alves, T. M.: Submarine slide blocks and associated soft-sediment deformation in deep-water basins: A review, Mar. Petrol. Geol., 67, 262–285, https://doi.org/10.1016/j.marpetgeo.2015.05.010, 2015.
Amblas, D. and Dowdeswell, J. A.: Physiographic influences on dense shelf-water cascading down the Antarctic continental slope, Earth-Sci. Rev., 185, 887–900, https://doi.org/10.1016/j.earscirev.2018.07.014, 2018.
Amblas, D., Ceramicola, S., Gerber, T. P., Canals, M., Chiocci, F. L., Dowdeswell, J. A., Harris, P. T., Huvenne, V. A. I., Lai, S. Y. J., Lastras, G., Lo Iacono, C., Micallef, A., Mountjoy, J. J., Paull, C. K., Puig, P., and Sanchez-Vidal, A.: Submarine canyons and gullies, in: Submarine Geomorphology, edited by: Micallef, A., Krastel, S., and Savini, A., Springer Geology, ISBN 978-3-319-57851-4, 251–272, https://doi.org/10.1007/978-3-319-57852-1_14, 2017.
Akiba, F., Hiramatsu, C., and Yanagisawa, Y.: A Cenozoic Diatom Genus Cavitatus Williams; an Emended Description and Two New Biostratigraphically Useful Species, C. lanceolatus and C. rectus from Japan, Bull. Natn. Sci. Mus., Tohyo, Ser. C, 19, 11–39, 1993.
Allen, C., Peakall, J., Hodgson, D. M., Bradbury, W., and Booth, A. D.: Latitudinal changes in submarine channel-levee system evolution, architecture and flow processes, Front. Earth Sci., 10, 976852, https://doi.org/10.3389/feart.2022.976852, 2022.
Armand, L. K. and Zielinski, U.: Diatom species of the Genus Rhizosolenia from Southern Ocean sediments: distribution and taxonomic notes, Diatom Res., 16, 259–294, 2001.
Armand, L. K., Crosta, X., Romero, O., and Pichon, J. J.: The biogeography of major diatom taxa in Southern Ocean sediments: 1. Sea ice related species, Palaeogeogr. Palaeocl., 223, 93–126, https://doi.org/10.1016/j.palaeo.2005.02.015, 2005.
Armand, L., Ferry, A., and Leventer, A.: Advances in palaeo sea ice estimation, in: Sea Ice, 3rd Edn., edited by: Thomas, D. N., John Wiley and Sons, Ltd., ISBN 9781118778388, 2017.
Armand, L. K., O'Brien, P. E., and On-board Scientific Party: Interactions of the Totten Glacier with the Southern Ocean through multiple glacial cycles (IN2017-V01): Post-survey report, 14th January–5th March 2017, Res. School of Earth Sciences, College of Science, Australian National University, Canberra, https://doi.org/10.4225/13/5acea64c48693, 2018.
Barde, M. F.: Les Diatomées des sédiments actuels et du Quaternairesupérieur de l'Atlantique nord-oriental, Intérêt hydrologique et climatique, Bulletin dell'Institut de Géologie du Bassin de l'Aquitaine, 29, 85–111, 1981.
Barron, J. A., Fourtanier, E., and Bohaty, S. M.: Oligocene and earliest Miocene diatom biostratigraphy of ODP Leg 199 Site 1220, equatorial Pacific, in: Proc. ODP, edited by: Wilson, P. A., Lyle, M., Janecek, T. R., and Firth, J. V., Sci. Results, 199, 1–25, 2004.
Bart, P. J. and Iwai, M.: The overdeepening hypothesis: How erosional modification of the marine-scape during the early Pliocene altered glacial dynamics on the Antarctic Peninsula's Pacific margin, Palaeogeogr. Palaeocl., 335–336, 42–51, https://doi.org/10.1016/j.palaeo.2011.06.010, 2012.
Beltran, C., Golledge, N. R., Ohneiser, C., Kowalewski, D. E., Sicre, M. A., Hageman, K. J., Smith, R., Wilson, G. S., and Mainié, F.: Southern Ocean temperature records and ice-sheet models demonstrate rapid Antarctic ice sheet retreat under low atmospheric CO2 during Marine Isotope Stage 31, Quaternary Sci. Rev., 228, 106069, https://doi.org/10.1016/j.quascirev.2019.106069, 2020.
Bensi, M., Kovačević, V., Donda, F., O'Brien, P. E., Armbrecht, L., and Armand, L. K.: Water masses distribution offshore the Sabrina Coast (East Antarctica), Earth Syst. Sci. Data, 14, 65–78, https://doi.org/10.5194/essd-14-65-2022, 2022.
Berger, A. and Loutre, M. F.: Insolation Values for the Climate of the Last 10 Million Years, Quaternary Sci. Rev., 1, 297–317, https://doi.org/10.1016/0277-3791(91)90033-Q, 1991.
Beszteri, B., Allen, C., Almandoz, G. O., Armand, L., Bárcena, M. A, Cantzler, H., Crosta, X., Esper, O., Jordan, R. W, Kauer, G., Klaas, C., Kloster, M., Leventer, A., Pike, J., and Rigual Hernandez, A. S.: Quantitative comparison of taxa and taxonconcepts in the diatom Genus Fragilariopsis: a case study on using slide scanning, multiexpert image annotation, and image analysis in taxonomy, J. Phycol., 54, 703–719, https://doi.org/10.1111/jpy.12767, 2018.
Blum, J. D. and Erel, Y.: isotope systematics of a granitic soil chronosequence: The importance of biotite weathering, Geochim. Cosmochim. Ac., 61, 3193–3204, https://doi.org/10.1016/S0016-7037(97)00148-8, 1997.
Blott, S. J. and Pye, K.: Gradistat: A Grain Size Distribution and Statistics Package for the Analysis of Unconsolidated Sediments, Earth Surf. Proc. Land., 26, 1237–1248, https://doi.org/10.1002/esp.261, 2001.
Bodén, P.: Reproducibility in the random settling method for quantitativediatom analysis, Micropaleontology, 37, 313–319, 1991.
Bohaty, S. M., Wise Jr., S. W., Duncan, R. A., Moore, C. L., and Wallace, P. J.: Neogene diatom biostratigraphy, tephra stratigraphy, and chronology of ODP Hole 1138A, Kerguelen Plateau, in: Proc. ODP Sci. Results, edited by: Frey, F. A., Coffin, M. F., Wallace, P. J., and Quilty, P. G., 183, 1–53, http://www-odp.tamu.edu/publications/ (last access: 31 August 2024), 2003.
Colleoni, F., De Santis, L., Siddoway, C. S., Bergamasco, A., Golledge, N. R., Lohmann, G., Passchier S., and Siegert M. J.: Spatio-temporal variability of processes across Antarctic ice-bed–ocean interfaces, Nat. Commun., 9, 2289, https://doi.org/10.1038/s41467-018-04583-0, 2018.
Close, D. I.: Slope and fan deposition in deep-water turbidite systems, East Antarctica, Mar. Geol., 274, 21–31, https://doi.org/10.1016/j.margeo.2010.03.002, 2010.
Close, D. I., Stagg, H. M. J., and O'Brien, P. E.: Seismic stratigraphy and sediment distribution on the Wilkes Land and Terre Adélie margins, East Antarctica, Mar. Geol., 239, 33–57, https://doi.org/10.1016/j.margeo.2006.12.010, 2007.
Close, D. I., Watts, A. B., and Stagg, H. M. J.: A marine geophysical study of the Wilkes Land rifted continental margin, Antarctica, Geophys. J. Int., 177, 430–450, https://doi.org/10.1111/j.1365-246X.2008.04066.x, 2009.
Cody, R. D., Levy, R. H., Harwood, D. M., and Sadler, P. M.: Thinking out-side the zone: High-resolution quantitative diatom biochronology for theAntarctic Neogene, Palaeogeogr. Palaeocl., 260, 92–121, https://doi.org/10.1016/j.palaeo.2007.08.020, 2008.
Cook, C. P., van de Flierdt, T., Williams, T., Hemming, S. R., Iwai, M., Kobayashi, M., Jimenez-Espejo, F. J., Escutia, C., González, J. J., Khim, B. K., McKay, R. M., Passchier, S., Bohaty, S. M., Riesselman, C. R., Tauxe, L., Sugisaki, S., Lopez Galindo, A., Patterson, M. O., Sangiorgi, F., Pierce, E. L., Brinkhuis, H., and IODP Expedition 318 Scientists: Dynamic behaviour of the East Antarctic ice sheet during Pliocene warmth, Nat. Geosci., 6, 765–769, https://doi.org/10.1038/NGEO1889, 2013.
Cortese, G. and Gersonde, R.: Plio/Pleistocene changes in the main biogenic silica carrier in the Southern Ocean, Atlantic Sector, Mar. Geol., 252, 100–110, https://doi.org/10.1016/j.margeo.2008.03.015, 2008.
Cortese, G., Abelmann, A., and Gersonde, R.: The last five glacial-interglacial transitions: A high-resolution 450,000-year record from the subantarctic Atlantic, Paleoceanography, 22, PA4203, https://doi.org/10.1029/2007PA001457, 2007.
Crampton, J. S., Cody, R. D., Levy, R., Harwood, D., McKay, R., and Naish, T. R.: Southern Ocean phytoplankton turnover in response to stepwise Antarctic cooling over the past 15 million years, P. Natl. Acad. Sci. USA, 113, 6868–6873, https://doi.org/10.1073/pnas.1600318113, 2016.
Creac'h, L., Noble, T. L., Chase, Z., Charlier, B. L. A., Townsend, A. T., Perez-Tribouillier, H., and Dietz, C.: Unradiogenic reactive phase controls the εNd of authigenic phosphates in East Antarctic margin sediment, Geochim. Cosmochim. Ac., 344, 190–206, https://doi.org/10.1016/j.gca.2023.01.001, 2023.
Crosta, X., Romero, O., Armand, L. K., and Pichon, J. J.: The biogeography of major diatom taxa in Southern Ocean sediments: 2. Open ocean related species, Palaeogeogr. Palaeocl., 223, 66–92, https://doi.org/10.1016/j.palaeo.2005.03.028, 2005.
Crosta, X., Shukla, S. K., Ther, O., Ikehara, M., Yamane, M., and Yokoyama, Y.: Last Abundant Appearance Datum of Hemidiscus karstenii driven by climate change, Mar. Micropal., 157, 101861, https://doi.org/10.1016/j.marmicro.2020.101861, 2020.
CSIRO, Marine National Facility, Armand, L., O'Brien, P., Leventer, A., Domack, E., Donda, F., De Santis, L., Escutia Dotti, C., Post, A., and Opdyke, B.: RV Investigator Voyage IN2017_V01 End of Voyage (EOV) Archive, v1, CSIRO, Data Collection [data set], https://doi.org/10.25919/5b7cf37d8ba76, 2017.
Di Roberto, A., Colizza, E., Del Carlo, P., Petrelli, M., Finocchiaro, F., and Kuhn, G.: First marine cryptotephra in Antarctica found in sediments of the western Ross Sea correlates with englacial tephras and climate records, Sci. Rep., 9, 10628, https://doi.org/10.1038/s41598-019-47188-3, 2019.
Di Roberto, A., Scateni, B., Di Vincenzo, G., Petrelli, M., Fisauli, G., Barker, S. J., Del Carlo, P., Colleoni, F., Kulhanek, D. K., McKay, R., De Santis, L., and the IODP Expedition 374 Scientific Party: Tephrochronology and provenance of an early Pleistocene (Calabrian) tephra from IODP Expedition 374 Site U1524, Ross Sea (Antarctica), Geochem. Geophy. Geosy., 22, e2021GC009739, https://doi.org/10.1029/2021GC009739, 2021.
Donda, F., Brancolini, G., O'Brien, P. E., De Santis, L., and Escutia, C.: Sedimentary processes in the Wilkes Land margin: a record of the Cenozoic East Antarctic Ice Sheet evolution, J. Geol. Soc. Lond., 164, 243–256, 2007.
Donda, F., O'Brien, P. E., De Santis, L., Rebesco, M., and Brancolini, G.: Mass wasting processes in the Western Wilkes Land margin: Possible implications for East Antarctic glacial history, Palaeogeogr. Palaeocl., 260, 77–91, https://doi.org/10.1016/j.palaeo.2007.08.008, 2008.
Donda, F., Leitchenkov, G., Brancolini, G., Romeo, R., De Santis, L., Escutia, C., O'Brien, P., Armand, L., Caburlotto, A., and Cotterle, D.: The influence of Totten Glacier on the Late Cenozoic sedimentary record, Ant. Sci., 32, 288–300, https://doi.org/10.1017/S0954102020000188, 2020.
Donda, F., Romeo, R., Leitchenkov, G., Gei, D., Rosenthal, Y., Leventer, A., Lodolo, E., Noble, T. L., Post, A., O'Brien, P. E., Opdyke, B. N., and Olivo, E.: Evidence of the evolution of the East Antarctic Ice Sheet on the continental slope and rise sedimentary record: Insights from the Sabrina Coast, East Antarctica, Geol. Soc. Am. Bull., 135, 2868–2879, https://doi.org/10.1130/B36674.1, 2023.
Donda, F., Rebesco, M., Kovacevic, V., Silvano, A., Bensi, M., De Santis, L., Rosenthal, Y., Torricella, F., Baradello, L., Gei, D., Leventer, A., Post, A., Leitchenkov, G., Noble, T., Zgur, F., Cova, A., O’Brien, P., and Romeo, R.: Footprint of sustained poleward warm water flow within East Antarctic submarine Canyons, Nat. Commun., 15, 6028, https://doi.org/10.1038/s41467-024-50160-z, 2024.
Dowsett, H., Dolan, A., Rowley, D., Moucha, R., Forte, A. M., Mitrovica, J. X., Pound, M., Salzmann, U., Robinson, M., Chandler, M., Foley, K., and Haywood, A.: The PRISM4 (mid-Piacenzian) paleoenvironmental reconstruction, Clim. Past, 12, 1519–1538, https://doi.org/10.5194/cp-12-1519-2016, 2016.
Donges, J. F., Donner, R. V., Trauth, M. H., Marwan, N., Schellnhuber, H. J., and Kurths, J.: Nonlinear detection of paleoclimate-variability transitions possibly related to human evolution, P. Natl. Acad. Sci. USA, 108, 20422–20427, https://doi.org/10.1073/pnas.1117052108, 2011.
Dortmans, B., Langford, W. F., and Willms, A. R.: An energy balance model for paleoclimate transitions, Clim. Past, 15, 493–520, https://doi.org/10.5194/cp-15-493-2019, 2019.
Duffy, M. L., Tibbett, E. J., Smith, C., Warny, S., Feakins, S. J., Escarguel, G., Askin, R., Leventer, A., and Shevenell, A. E.: Snapshots of pre-glacial paleoenvironmental conditions along the Sabrina Coast, East Antarctica: new palynological and biomarker evidence, Geobios, 70, 1–16, https://doi.org/10.1016/j.geobios.2021.09.001, 2022.
Dumitru, O. A., Austermann, J., Polyak, V. J., Fornós, J. J., Asmerom, Y., Ginés, J., Ginés, A., and Onac, B. P.: Constraints on global mean sea level during Pliocene warmth, Nature, 574, 233–236, https://doi.org/10.1038/s41586-019-1543-2, 2019.
Egli, R.: Characterization of individual rock magnetic components by analysis of remanence curves, 1. Unmixing natural sediments, Stud. Geophys. Geod., 48, 391–446, https://doi.org/10.1023/B:SGEG.0000020839.45304.6d, 2004.
Egli, R., Florindo, F., and Roberts, A. P.: Introduction to 'Magnetic iron minerals in sediments and their relation to geologic processes, climate, and the geomagnetic field', Global Planet. Change, 110, 259–263, https://doi.org/10.1016/j.gloplacha.2013.10.009, 2013.
Escutia, C., Bárcena, M. A., Lucchi, R. G., Romero, O., Ballegeer, A. M., Gonzalez, J. J., and Harwood, D. M.: Circum-Antarctic warming events between 4 and 3.5 Ma recorded in marine sediments from the Prydz Bay (ODP Leg 188) and the Antarctic Peninsula (ODP Leg 178) margins, Global Planet. Change, 69, 170–184, https://doi.org/10.1016/j.gloplacha.2009.09.003, 2009.
Escutia, C., Brinkhuis, H., Klaus, A., and the IODP Expedition 318 Scientists: IODP Expedition 318: From Greenhouse to Icehouse at the Wilkes Land Antarctic Margin, Sci. Dril., 12, 15–23, https://doi.org/10.2204/iodp.sd.12.02.2011, 2011.
Fernandez, R., Gulick, S., Domack, E., Montelli, A., Leventer, A., Shevenell, A., Frederick, B., and the NBP1402 Science Party: Past ice stream and ice sheet changes on the continental shelf off the Sabrina Coast, East Antarctica, Geomorphology, 317, 10–22, https://doi.org/10.1016/j.geomorph.2018.05.020, 2018.
Florindo, F., Siegert, M., De Santis, L., and Naish, T. R.: Antarctic Climate Evolution, 2nd Edn., edited by: Florindo F., Siegert, M., De Santis, L., and Naish, T., Elsevier, 806, ISBN 978-0-12-819109-5, 2022.
Fraser, A. D., Massom, R. A., Michael, K. A., Galton-Fenzi, B. K., and Lieser, J. L.: East Antarctic Landfast Sea Ice Distribution and Variability, 2000–08, J. Climate, 25, 1137–1156, https://doi.org/10.1175/JCLI-D-10-05032.1, 2012.
Fretwell, P., Pritchard, H. D., Vaughan, D. G., Bamber, J. L., Barrand, N. E., Bell, R., Bianchi, C., Bingham, R. G., Blankenship, D. D., Casassa, G., Catania, G., Callens, D., Conway, H., Cook, A. J., Corr, H. F. J., Damaske, D., Damm, V., Ferraccioli, F., Forsberg, R., Fujita, S., Gim, Y., Gogineni, P., Griggs, J. A., Hindmarsh, R. C. A., Holmlund, P., Holt, J. W., Jacobel, R. W., Jenkins, A., Jokat, W., Jordan, T., King, E. C., Kohler, J., Krabill, W., Riger-Kusk, M., Langley, K. A., Leitchenkov, G., Leuschen, C., Luyendyk, B. P., Matsuoka, K., Mouginot, J., Nitsche, F. O., Nogi, Y., Nost, O. A., Popov, S. V., Rignot, E., Rippin, D. M., Rivera, A., Roberts, J., Ross, N., Siegert, M. J., Smith, A. M., Steinhage, D., Studinger, M., Sun, B., Tinto, B. K., Welch, B. C., Wilson, D., Young, D. A., Xiangbin, C., and Zirizzotti, A.: Bedmap2: improved ice bed, surface and thickness datasets for Antarctica, The Cryosphere, 7, 375–393, https://doi.org/10.5194/tc-7-375-2013, 2013.
Gales, J. A., McKay, R. M., De Santis, L., Rebesco, M., Laberg, J. S., Shevenell, A. E., Harwood, D., Leckie, R. M., Kulhanek D. K., King, M., Patterson, M., Lucchi, R. G., Kim, S., Kim, S., Dodd, J., Seidenstein, J., Prunella, C., Ferrante, G. M., and IODP Expedition 374 Scientists: Climate-controlled submarine landslides on the Antarctic continental margin, Nat. Commun., 14, 2714, https://doi.org/10.1038/s41467-023-38240-y, 2023.
Gardner, M.: Toward a Complete Kinematic Description of Hydraulic Plucking of Fractured Rock, PhD Thesis, in: J. Hydraul. Eng., ASCE, ISSN 0733-9429, 149, 7, 04023015, https://doi.org/10.1061/JHEND8.HYENG-13193, 2023.
Gatter, R., Clare, M. A., Kuhlmann, J., and Huhn, K.: Characterisation of weak layers, physical controls on their global distribution and their role in submarine landslide formation, Earth-Sci. Rev., 223, 103845, https://doi.org/10.1016/j.earscirev.2021.103845, 2021.
Gersonde, R. and Burckle, L. H.: Neogene Diatom Biostratigraphy of ODP Leg 113, Weddell Sea (Antarctic Ocean), in: Proceedings of the Ocean Drilling Program, Scientific Results, edited by: Barker, P. F., Kennett, J. P., O'Connell, S., and Pisias, N. G., 113, 761–789, ISSN 0884-5891, 1990.
Gersonde, R. and Bárcena, M. A.: Revision of the upper Pliocene-Pleistocene diatom biostratigraphy for the Northern belt of the Southern Ocean, Micropaleontology, 44, 84–98, 1998.
Giuliani, S., Capotondi, L., Maffioli, P., Langone, L., Giglio, F., Yam, R., Frignani, M., and Ravaioli, M.: Paleoenvironmental changes in the Pacific sector of the Southern Ocean (Antarctica) during the past 2.6 Ma, Global Planet. Change, 77, 34–48, https://doi.org/10.1016/j.gloplacha.2011.02.008, 2011.
Golynsky, A.V., Ivanov, S.V., Kazankov, A. J., Jokat, W., Masolov, V.N., von Frese, R.R.B. and the ADMAP Working Group: New continental margin magnetic anomalies of East Antarctica, Tectonophysics, 585, 172–184, https://doi.org/10.1016/j.tecto.2012.06.043, 2013.
Grant, G. R.: Pliocene-Pleistocene orbital cyclostratigraphy and glacial evolution of the East Antarctic Ice Sheet from continental rise IODP site U1361, Wilkes Land margin, East Antarctica, M. S. In Geology, Victoria University, Wellington, New Zealand, 143 pp., 2012.
Grant, G. R., Naish, T. R., Dunbar, G. B., Stocchi, P., Kominz, M. A., Kamp, P. J. J., Tapia, C. A., McKay, R. M., Levy, R. H., and Patterson, M. O.: The amplitude and origin of sea-level variability during the Pliocene epoch, Nature, 574, 237–241, https://doi.org/10.1038/s41586-019-1619-z, 2019.
Grant, G. R., Williams, J. H. T., Naeher, S., Seki, O., McClymont, E. L., Patterson, M. O., Haywood, A. M., Behrens, E., Yamamoto, M., and Johnson, K.: Amplified surface warming in the south-west Pacific during the mid-Pliocene (3.3–3.0 Ma) and future implications, Clim. Past, 19, 1359–1381, https://doi.org/10.5194/cp-19-1359-2023, 2023.
Greene, C. A., Blankenship, D. D., Gwyther, D. E., Silvano, A., and van Wijk, E.: Wind causes Totten Ice Shelf melt and acceleration, Sci. Adv., 3, https://doi.org/10.1126/sciadv.1701681, 2017.
Greenbaum, J. S., Blankenship, D. D., Young, D. A., Richter, T. G., Roberts, J. L., Aitken, A. R. A., Legresy, B., Schroeder, D. M., Warner, R. C., and van Ommen, T. D.: Ocean access to a cavity beneath Totten Glacier in East Antarctica, Nat. Geosci., 8, 294–298, https://doi.org/10.1038/ngeo2388, 2015.
Grigorov, I., Rigual-Hernandez, A. S., Honjo, S., Kemp, A. E. S., and Armand, L. K.: Settling fluxes of diatoms to the interior of the Antarctic circumpolar current along 170° W, Deep-Sea Res. Pt. I, 93, 1–13, https://doi.org/10.1016/j.dsr.2014.07.008, 2014.
Grützner, J., Hillenbrand, C. D., and Rebesco, M.: Terrigenous flux and biogenic silica deposition at the Antarctic continental rise during the late Miocene to early Pliocene: implications for ice sheet stability and sea ice coverage, Global Planet. Change, 45, 131–149, hdl:10013/epic.33012.d001, 2005.
Gulick, S. P. S., Shevenell, A. E., Montelli, A., Fernandez, R., Smith, C., Warny, S., Bohaty, S. M., Sjunneskog, C., Leventer, A., Frederick, B., and Blankenship, D. D.: Initiation and long-term instability of the East Antarctic Ice Sheet, Nature, 552, 225–232, https://doi.org/10.1038/nature25026, 2017.
Guyodo, Y., Acton, G. D., Brachfeld, S., and Channell, J. E. T.: A sedimentary paleomagnetic record of the Matuyama chron from the Western Antarctic margin (ODP Site 1101), Earth Planet. Sc. Lett., 191, 61–74, 2001.
Ha, S., Colizza, E., Torricella, F., Langone, L., Giglio F., Kuhn, G., Macrì, P., and Khim, B. K.: Glaciomarine sediment deposition on the continental slope and rise of the central Ross Sea since the Last Glacial Maximum, Mar. Geol., 445, 106752, https://doi.org/10.1016/j.margeo.2022.106752, 2022.
Haneda, Y., Okada, M., Suganuma, Y., and Kitamura, T.: A full sequence of the Matuyama–Brunhes geomagnetic reversal in the Chiba composite section, Central Japan, Prog. Earth Planet. Sci., 7, 44, https://doi.org/10.1186/s40645-020-00354-y, 2020.
Hayakawa, H., Shibuya, K., Aoyama, Y., Nogi, Y., and Doi, K.: Ocean bottom pressure variability in the Antarctic Divergence Zone off Lützow-Holm Bay, East Antarctica, Deep-Sea Res. Pt. I, 60, 22–31, https://doi.org/10.1016/j.dsr.2011.09.005, 2012.
Harwood, D. M. and Bohaty, S. M.: Early Oligocene Siliceous Microfossil Biostratigraphy of Cape Roberts Project Core CRP-3, Victoria Land Basin, Antarctica, Terra Antartica, 8, 315–338, 2001.
Head, M. J., Zalasiewicz, J., Bertini, A., and Zhou, L.: The Mid-Brunhes Event: a second stage for the Middle Pleistocene Subseries?, EGU General Assembly 2021, online, 19–30 Apr 2021, EGU21-6900, https://doi.org/10.5194/egusphere-egu21-6900, 2021.
Heaton, T. J., Köhler, P., Butzin, M., Bard, E., Reimer, R. W., Austin, W. E. N., Ramsey, C. B., Grootes, P. M., Hughen, K. A., Kromer, B., Reimer, P. J., Adkins, J. F., Burke, A., Cook, M. S., Olsen, J., and Skinner, L. C.: Marine20 – the marine radiocarbon age calibration curve (0–55,000 cal BP), simulated data for IntCal20, PANGAEA [data set], https://doi.org/10.1594/PANGAEA.914500, 2020.
Hernández-Molina, F. J., Wåhlin, A., Bruno, M., Ercilla, G., Llave, E., Serra, N., Rosón, G., Puig, P., Rebesco, M., Van Rooij, D., Roque, D., González-Pola, C., Sánchez, F., Gómez, M., Preu, B., Schwenk, T., Hanebuth, T. J. J., Sánchez Leal, R. F., García-Lafuente, J., Brackenridge, R. E., Juan, C., Stow, D. A. V., and Sánchez-González, J. M.: Oceanographic processes and morphosedimentary products along the Iberian margins: A new multidisciplinary approach, Mar. Geol., 378, 127–156, https://doi.org/10.1016/j.margeo.2015.12.008, 2016.
Heslop, D. and Roberts, A. P.: Analyzing paleomagnetic data: To anchor or not to anchor?, J. Geophys. Res.-Sol. Ea., 121, 7742–7753, https://doi.org/10.1002/2016JB013387, 2016.
Heywood, K. J., Schmidtko, S., Heuzé, C., Kaiser, J., Jickells, T. D., Queste, B. Y., Stevens, D. P., Wadley, M., Thompson, A. F., Fielding, S., Guihen, D., Creed, E., Ridley, J. K., and Smith, W.: Ocean processes at the Antarctic continental slope, Philos. T. R. Soc. A, 372, 20130047, https://doi.org/10.1098/rsta.2013.0047, 2014.
Hillenbrand, C. D. and Fütterer, D. K.: Neogene to Quaternary deposition of opal on the continental rise west of the Antarctic Peninsula, ODP Leg 178, Sites 1095, 1096, and 1101, in: Proc. ODP Sci. Results, Vol. 178, edited by: Barker, P. F., Camerlenghi, A., Acton, G. D., and Ramsay, A. T. S., Ocean Drilling Program, College Station, TX, 1–33, https://pdfs.semanticscholar.org/1a2c/5284d4d9a09b1d37bc527ca65f88c9a49eea.pdf (last access: 31 August 2024), 2001.
Hillenbrand, C. D., Kuhn, G., and Frederichs, T.: Record of a Mid-Pleistocene depositional anomaly in West Antarctic continental margin sediments: an indicator for ice-sheet collapse?, Quaternary Sci. Rev., 28, 1147–1159, https://doi.org/10.1016/j.quascirev.2008.12.010, 2009.
Hirano, D., Mizobata, K., Sasaki, H., Murase, H., Tamura, T., and Aoki, S.: Poleward eddy-induced warm water transport across a shelf break off Totten Ice Shelf: East Antarctica, Nat. Commun., 2, 1–8, https://doi.org/10.1038/s43247-021-00217-4, 2021.
Hirano, D., Tamura, T., Kusahara, K., Fujii, M. K., Yamazaki, K., Nakayama, Y., Ono, K., Itaki, T., Aoyama, Y., Simizu, D., Mizobata, K., Ohshima, K. I., Nogi, Y., Rintoul, S. R., van Wijk, E., Greenbaum, J. S., Blankenship, D. D., Saito, K., and Aoki, S.: On-shelf circulation of warm water toward the Totten Ice Shelf in East Antarctica, Nat Commun., 14, 4955, https://doi.org/10.1038/s41467-023-39764-z, 2023.
Hodell, D. A. and Venz-Curtis, K. A.: Late Neogene history of deepwater ventilation in the Southern Ocean, Geochem. Geophy. Geosy., 7, Q09001, https://doi.org/10.1029/2005GC001211, 2006.
Holder, L., Duffy, M., Opdyke, B., Leventer, A., Post, A., O'Brien, P., and Armand, L. K.: Controls since the mid-Pleistocene transition on sedimentation and primary productivity downslope of Totten Glacier, East Antarctica, Paleoceanogr. Paleocl., 35, e2020PA003981, https://doi.org/10.1029/2020PA003981, 2020.
Howat, I. M., Porter, C., Smith, B. E., Noh, M.-J., and Morin, P.: The Reference Elevation Model of Antarctica, The Cryosphere, 13, 665–674, https://doi.org/10.5194/tc-13-665-2019, 2019.
Ishino, S. and Suto, I.: Late Pliocene sea-ice expansion and its influence on diatom species turnover in the Southern Ocean, Mar. Micropaleontol., 160, 101895, https://doi.org/10.1016/j.marmicro.2020.101895, 2020.
Jacobs, S. S.: On the nature and significance of the Antarctic Slope Front, Mar. Chem., 35, 9–24, 1991.
Jansen, J. H., Kuijpers, A., and Troelstra, S. R.: A Mid-Brunhes Climatic Event: Long-Term Changes in Global Athmosphere and Ocean Circulation, Science, 232, 619–622, 1986.
Jimenez-Espejo, F. J., Presti, M., Kuhn, G., Mckay, R., Crosta, X., Escutia, C., Lucchi, R. G., Tolotti, R., Yoshimura, T., Ortega Huertas, M., Macrì, P., Caburlotto, A., and De Santis, L.: Late Pleistocene oceanographic and depositional variations along the Wilkes Land margin (East Antarctica) reconstructed with geochemical proxies in deep-sea sediments, Global Planet. Change, 184, 103045, https://doi.org/10.1016/j.gloplacha.2019.103045, 2020.
Jordan, R. W. and Stickley, C. E.: Diatoms as indicators of paleoceanographic events, in: The Diatoms: Applications for the Environmental and Earth Sciences, edited by: Smol, J. P. and Stoermer, E. F., Cambridge University Press, II, 667, ISBN-13 978-0-521-50996-1, 2010.
Justino, F., Lindemann, D., Kucharski, F., Wilson, A., Bromwich, D., and Stordal, F.: Oceanic response to changes in the WAIS and astronomical forcing during the MIS31 superinterglacial, Clim. Past, 13, 1081–1095, https://doi.org/10.5194/cp-13-1081-2017, 2017.
Khazendar, A., Schodlok, M. P., Fenty, I., Ligtenberg, S. R. M., Rignot, E., and van den Broeke, M. R.: Observed thinning of Totten Glacier is linked to coastal polynya variability, Nat. Commun., 4, 2857, https://doi.org/10.1038/ncomms3857, 2013.
Khokhlov, A. and Hulot, G.: Principal component analysis of palaeomagnetic directions: converting a Maximum Angular Deviation (MAD) into an α95 angle, Geophys. J. Int., 204, 274–291, https://doi.org/10.1093/gji/ggv451, 2016.
Kirschvink, J. L.: The Least Squares Line and Plane Analysis of Palaeomagnetic Data, Geophys. J. Int., 62, 699–718, https://doi.org/10.1111/j.1365-246X.1980.tb02601.x, 1980.
Konfirst, M. A., Scherer, R. P., Hillenbrand, C. D., and Kuhn, G.: A marine diatom record from the Amundsen Sea – Insights into oceanographic and climatic response to the Mid-Pleistocene Transition in the West Antarctic sector of the Southern Ocean, Mar. Micropaleontol., 92–93, 40–51, https://doi.org/10.1016/j.marmicro.2012.05.001, 2012.
Laake, A. and Wolfe, Z.: Geohazards in Green Canyon, Gulf of Mexico Challenges and mapping technology based on seismic data, Abstract, AAPG Annual Conference & Exhibition, Denver, CO, 2015.
Laake, A. and Hernandez-Molina, J.: Contourites – A Paleovelocity Meter from Geologic Analogues Created from 3D Seismic Data, Conference Paper, 84th EAGE Annual Conference & Exhibition, Vienna, Austria, 5 pp., https://doi.org/10.3997/2214-4609.202310255, 2023.
Larter, R. D., Hogan, K. A., and Dowdeswell, J. A.: Large sediment drifts on the upper continental rise west of Antarctic Peninsula, in: Atlas of Submarine Glacial Landforms: Modern, Quaternary and Ancient, edited by: Dowdeswell, J. A., Canals, M., Jakobsson, M., Todd, B. J., Dowdeswell, E. K., and Hogan, K. A., Geol. Soc., London, Memoirs, 46, 401–402, https://doi.org/10.1144/M46.132, 2016.
Legrain, E., Parrenin, F., and Capron, E.: A gradual change is more likely to have caused the Mid-Pleistocene Transition than an abrupt event, Com. Earth Environ., 4, 90, https://doi.org/10.1038/s43247-023-00754-0, 2023.
Leventer, A.: Quantitative Diatom data collected from the 2017 RV Investigator voyage, IN2017_V01, Ver. 1, Australian Antarctic Data Centre [data set], https://doi.org/10.26179/5cad45a7cb140, 2022.
Li, X., Rignot, E., Morlighem, M., Mouginot, J., and Scheuchl, B.: Grounding line retreat of Totten Glacier, East Antarctica, 1996 to 2013, Geophys. Res. Lett., 42, 8049–8056, https://doi.org/10.1002/2015GL065701, 2015.
Lisiecki, L. E. and Raymo, M. E.: A Pliocene-Pleistocene stack of 57 globally distributed benthic δ18O records, Paleoceanography, 20, PA1003, https://doi.org/10.1029/2004PA001071, 2005.
Liu, C., Wang, Z., Cheng, C., Xia, R., Li, B., and Xie, Z.: Modeling modified Circumpolar Deep Water intrusions onto the Prydz Bay continental shelf, East Antarctica, J. Geophys. Res.-Oceans, 122, 5198–5217, https://doi.org/10.1002/2016JC012336, 2017.
Lougheed, B. C. and Obrochta, S. P.: MatCal: Open Source Bayesian 14C Age Calibration in MatLab, Journal of Open Research Software, 4, e42, https://doi.org/10.5334/jors.130, 2016.
Lucchi, R. G. and Rebesco, M.: Glacial contourites on the Antarctic Peninsula margin: insight for palaeoenvironmental and palaeoclimatic conditions, in: Economic and Palaeoceanographic Significance of Contourite Deposits, edited by: Viana, A. R. and Rebesco, M., Geological Society, London, Special Publications, 276, 111–127, ISBN 978-1-86239-226-7, 2007.
Mahood, A. D. and Barron, J. A.: Late Pliocene diatoms in a diatomite from Prydz Bay, East Antarctica, USGS Staff, Published Research, 265, https://digitalcommons.unl.edu/usgsstaffpub/265 (last access: 31 August 2024), 1996.
Macrì, P., Sagnotti, L., Dinarès-Turell, J., and Caburlotto, A.: A composite record of Late Pleistocene relative geomagnetic paleointensity from the Wilkes Land Basin (Antarctica), Physics of the Earth and Planetary Interiors, 151, 223–242, https://doi.org/10.1016/j.pepi.2005.03.004, 2005.
Massom, R., Reid, P., Stammerjohn, S., Raymond, B., Fraser, A., and Ushio, S.: Change and Variability in East Antarctic Sea Ice Seasonality, 1979/80–2009/10, PLOS ONE, 8, e64756, https://doi.org/10.1371/journal.pone.0064756, 2013.
Massom, R. A. and Stammerjohn, S. E.: Antarctic sea ice change and variability e Physical and ecological implications, Polar Sci., 4, 149–186, https://doi.org/10.1016/j.polar.2010.05.001, 2010.
McCave, I. N. and Andrews, J. T.: Distinguishing current effects in sediments delivered to the ocean by ice, Principles, methods and examples, Quaternary Sci. Rev., 212, 92–107, 2019.
McCave, I. N. and Hall, I. R.: Size sorting in marine muds: Processes, pitfalls, and prospects for paleoflow-speed proxies, Geochem. Geophy. Geosy., 7, 10, https://doi.org/10.1029/2006GC001284, 2006.
McCave, I. N., Crowhurst, S. C., Kuhn, G., Hillenbrand, C. D., and Meredith, M. P.: Minimal change in Antarctic Circumpolar Current flow speed between the last glacial and Holocene, Nat. Geosci., 7, 113–116, https://doi.org/10.1038/ngeo2037, 2014.
McCave, I. N., Thornalley, D. J. R., and Hall, I. R.: Relation of sortable silt grain-size to deep-sea current speeds: Calibration of the “Mud Current Meter”, Deep-Sea Res. Pt. I, 127, 1–12, https://doi.org/10.1016/j.dsr.2017.07.003, 2017.
McCormack, F. S., Roberts, J. L., Kulessa, B., Aitken, A., Dow, C. F., Bird, L., Galton-Fenzi, B. K., Hochmuth, K., Jones, R. S., Mackintosh, A. N., and McArthur, K.: Assessing the potential for ice flow piracy between the Totten and Vanderford glaciers, East Antarctica, The Cryosphere, 17, 4549–4569, https://doi.org/10.5194/tc-17-4549-2023, 2023.
McKay, R., Naish, T., Carter, L., Riesselman, C., Dunbar, R., Sjunneskog, C., Winter, D., Sangiorgi, F., Warren, C., Pagani, M., Schouten, S., Willmott, V., Levy, R., DeConto, R., and Powell, R. D.: Antarctic and Southern Ocean influences on Late Pliocene global cooling, P. Natl. Acad. Sci. USA, 109, 6423–6428, https://doi.org/10.1073/pnas.1112248109, 2012.
McKay, R. M., Escutia, C., De Santis, L., Donda, F., Duncan, B., Gohl, K., Gulick, S., Hernández-Molina, J., Hillenbrand, C. D., Hochmuth, K., Kim, S., Kuhn, G., Larter, R., Leitchenkov, G., Levy, R. H., Naish, T. R., O'Brien, P., Pérez, L. F., Shevenell, A. E., and Williams, T.: Cenozoic history of Antarctic glaciation and climate from onshore and offshore studies, in: Antarctic Climate Evolution, 2nd Edn., edited by: Florindo, F., Siegert, M., De Santis, L., and Naish, T., Elsevier Ed., ISBN 978-0-12-819109-5, 2022.
Mohajerani, Y., Velicogna, I., and Rignot, E.: Mass loss of Totten and Moscow University glaciers, East Antarctica, using regionally optimized GRACE mascons, Geophys. Res. Lett., 45, 7010–7018, https://doi.org/10.1029/2018GL078173, 2018.
Montelli, A., Gulick, S., Fernandez-Vasquez, R., Frederick, B., Shevenell, A., Leventer, A., and Blankenship, D.: Seismic stratigraphy of the Sabrina Coast shelf, East Antarctica: history of early dynamic glaciations, GSA Bull., 132, 545–561, https://doi.org/10.1130/B35100.1, 2020.
Morlighem, M., Rignot, E., Binder, T., Blankenship, D., Drews, R., Eagles, G., Eisen, O., Ferraccioli, F., Forsberg, R., Fretwell, P., Goel, V., Greenbaum, J. S., Gudmundsson, H., Guo, J., Helm, V., Hofstede, C., Howat, I., Humbert, A., Jokat, W., Karlsson, N. B., Lee, W. S., Matsuoka, K., Millan, R., Mouginot, J., Paden, J., Pattyn, F., Roberts, J., Rosier, S., Ruppel, A., Seroussi, H., Smith, E. C., Steinhage, D., Sun, B., van den Broeke, M. R., van Ommen, T. D., van Wessem, M., and Young, D. A.: Deep glacial troughs and stabilizing ridges unveiled beneath the margins of the Antarctic ice sheet, Nature Geosc., 13, 132–137, https://doi.org/10.1038/s41561-019-0510-8, 2020.
Mudelsee, M. and Schulz, M.: The Mid-Pleistocene climate transition: onset of 100 ka cycle lags ice volume build-up by 280 ka, Earth Planet. Sc. Lett., 151, 117–123, 1997.
Naish, T., Carter, L., Wolff, E., Pollard, D., and Powell, R.: Late Pliocene–Pleistocene Antarctic Climate Variability at Orbital and Suborbital Scale: Ice Sheet, Ocean and Atmospheric Interactions, in: Developments in Earth & Environmental Sciences, edited by: Florindo, F. and Siegert, M., Elsevier Ed., https://doi.org/10.1016/S1571-9197(08)00011-6, 2009.
Nitsche, F. O., Porter, D., Williams, G., Cougnon, E. A., Fraser, A. D., Correia, R., and Guerrero, R.: Bathymetric control of warm ocean water access along the East Antarctic Margin, Geophys. Res. Lett., 44, 8936–8944, https://doi.org/10.1002/2017GL074433, 2017.
Nitsche, F. O., Porter, D., Williams, G., Cougnon, E. A., Fraser, A. D., Correia, R., and Guerrero, R.: Bathymetric control of warm ocean water access along the East Antarctic Margin, Geophys. Res. Lett., 44, 8936–8944, https://doi.org/10.1002/2017GL074433, 2018.
O'Brien, P., Pérez, L. F., Shevenell, A. E., Williams, T.: Cenozoic history of Antarctic glaciation and climate from onshore and offshore studies, in: Antarctic Climate Evolution, 2nd Edn., edited by: Florindo, F., Siegert, M., De Santis, L., and Naish, T., Elsevier Ed., ISBN 978-0-12-819109-5, 2022.
O'Brien, P. E., Post, A. L., Edwards, S., Martin, T., Caburlotto, A., Donda, F., Leitchenkov, G., Romeo, R., Duffy, M., Evangelinos, D., Holder, L., Leventer, A., López-Quirós, A., Opdyke, B. N., and Armand, L. K.: Continental slope and rise geomorphology seaward of the Totten Glacier, East Antarctica (112° E–122° E), Mar. Geol., 427, https://doi.org/10.1016/j.margeo.2020.106221, 2020.
Ogg, J. G.: Geomagnetic Polarity Time Scale, in: Geologic Time Scale, 1, Elsevier, Amsterdam, edited by: Gradstein, F. M., Ogg, J. G., Schmitz, M. D., and Ogg, G. M., 159–192, https://doi.org/10.1016/B978-0-12-824360-2.00005-X, 2020.
Orsi, A. H. and Webb, C. J.: Impact of sea ice production off Sabrina Coast, east Antarctica, Geophy. Res. Lett., 49, e2021GL095613, https://doi.org/10.1029/2021GL095613, 2022.
Passchier, S.: Linkages between East Antarctic Ice Sheet extent and Southern Ocean temperatures based on a Pliocene high-resolution record of ice-rafted debris off Prydz Bay, East Antarctica, Paleoceanography, 26, PA4204, https://doi.org/10.1029/2010PA002061, 2011.
Peck, V. L., Weber, M. E., Raymo, M. E., Williams, T., Armbrecht, L. H., Bailey, I., Brachfeld, S. A., Cardillo, F. G., Du, Z., Fauth, G., García, M., Glüder, A., Guitard, M. E., Gutjahr, M., Hemming, S. R., Hernández-Almeida, I., Hoem, F. S., Hwang, J.-H., Iizuka, M., Kato, Y., Kenlee, B., Martos, Y. M., O'Connell, S., Pérez, L. F., Reilly, B. T., Ronge, T. A., Seki, O., Tauxe, L., Tripathi, S., Warnock, J. P., and Zheng, X.: Site U1535, in: Iceberg Alley and Subantarctic Ice and Ocean Dynamics, edited by: Weber, M. E., Raymo, M. E., Peck, V. L., Williams, T., and the Expedition 382 Scientists, Proc. of the Int. Ocean Discovery Program, 382, College Station, TX, https://doi.org/10.14379/iodp.proc.382.104.2021, 2021.
Pelle, T., Morlighem, M., and Roberts, J. L.: Aurora Basin, the weak underbelly of East Antarctica, Geophys. Res. Lett., 47, e2019GL086821, https://doi.org/10.1029/2019GL086821, 2020.
Peña-Molino, B., McCartney, M. S., and Rintoul, S. R.: Direct observations of the Antarctic Slope Current transport at 113° E, J. Geophys. Res.-Oceans, 121, 7390–7407, https://doi.org/10.1002/2015JC011594, 2016.
Pinkernell, S. and Beszteri, B.: Potential effects of climate change on the distribution range of the main silicate sinker of the Southern Ocean, Ecol. Evol., 4, 3147–3161, https://epic.awi.de/id/eprint/35830/ (last access: 31 August 2024), 2014.
Pompilio, M., Kyle, P., Wilch, T., Dunbar, N., and ANDRILL-MIS Project Science Team: The volcanic record in the ANDRILL McMurdo Ice Shelf AND-1B drill core, in: 10th International Symposium on Antarctic Sciences, U.S., Geological Survey and The National Academies, USGS OF-2007-1047, Extended Abstract 199, 26 August–1 September 2007, Santa Barbara CA, ISBN 978-0-309-11854-5, 2007.
Post, A.: Interactions of the Totten Glacier through multiple glacial cycles, http://dbforms.ga.gov.au/pls/www/npm.mars.search, last access: 3 September 2024.
Post, A. L., Lavoie, C., Domack, E. W., Leventer, A., Shevenell, A., Fraser, A. D., and NBP 14-02 Science Team: Environmental drivers of benthic communities and habitat heterogeneity on an East Antarctic shelf, Ant. Sci., 29, 17–32, https://doi.org/10.1017/S0954102016000468, 2017.
Post, A. L., O'Brien, P. E., Edwards, S., Carroll, A. G., Malakoff, K., and Armand, L. K.: Upper slope processes and seafloor ecosystems on the Sabrina continental slope, East Antarctica, Mar. Geol., 422, 106091, https://doi.org/10.1016/j.margeo.2019.106091, 2020.
Potapova, M., Veselá, J., Smith, C., Minerovic, A., and Aycock, L.: Diatom New Taxon File at the Academy of Natural Sciences (DNTF-ANS), Academy of Natural Sciences [data set], http://dh.ansp.org/dntf (last access: 31 August 2024), 2023.
Prentice, M., Pittari, A., Lowe, D. J., Kilgour, G., Kamp, P. J. J., and Namaliu, M.: Linking proximal ignimbrites and coeval distal tephra deposits to establish a record of voluminous Early Quaternary (2.4–1.9 Ma) volcanism of the Tauranga Volcanic Centre, New Zealand, J. Volcanol. Geoth. Res., 429, 107595, https://doi.org/10.1016/j.jvolgeores.2022.107595, 2022.
Presti, M., Barbara, L., Denis, D., Schmidt, S., De Santis, L., and Crosta, X.: Sediment delivery and depositional patterns off Adélie Land (East Antarctica) in relation to late Quaternary climatic cycles, Mar. Geol., 284, 96–113, https://doi.org/10.1016/j.margeo.2011.03.012, 2011.
R Core Team: R: language and environment for statistical computing, R Fondation for Statistical Computing, Wien, Austria, https://www.R-project.org/ (last access: 31 August 2024), 2021.
Rebesco, M. and Camerlenghi, A.: Late Pliocene margin development and mega debris flow deposits on the Antarctic continental margins: Evidence of the onset of the modern Antarctic Ice Sheet?, Palaeogeogr. Palaeocl., 260, 149–167, https://doi.org/10.1016/j.palaeo.2007.08.009, 2008.
Rebesco, M., Pudsey, C. J., Canals, M., Camerlenghi, A., Barker, P. F., Estrada, F., and Giorgetti, A.: Sediment drifts and deep-sea channel systems, Antarctic Peninsula Pacific Margin, Geol. Soc. Lond. Mem., 22, 353–371, https://doi.org/10.1144/GSL.MEM.2002.022.01.25, 2002.
Rebesco, M., Hernández-Molina, F. J., Van Rooij, D., and Wåhlin, A.: Contourites and associated sediments controlled by deep-water circulation processes: State-of-the-art and future considerations, Mar. Geol., 352, 111–154, https://doi.org/10.1016/j.margeo.2014.03.011, 2014.
Rignot, E., Mouginot, J., Scheuchl, B., van den Broeked, M., van Wessemd, M. J., and Morlighem, M.: Four decades of Antarctic Ice Sheet mass balance from 1979–2017, P. Natl. Acad. Sci. USA, 116, 1095–1103, https://doi.org/10.1073/pnas.1812883116, 2019.
Rintoul, S. R.: On the Origin and Influence of Adélie Land Bottom Water, in: Ocean, Ice, and Atmosphere: Interactions at the Antarctic Continental Margin, edited by: Jacobs, S. S. and Weiss, R. F., https://doi.org/10.1029/AR075p0151, 1985.
Rintoul, S. R., Silvano, A., Pena-Molino, B., van Wijk, E., Rosenberg, M., Greenbaum, J. S., and Blankenship, D. D.: Ocean heat drives rapid basal melt of the Totten Ice Shelf, Sci. Adv., 2, 1–5, https://doi.org/10.1126/sciadv.1601610, 2016.
Roberts, J. L., Warner, R. C., Young, D., Wright, A., van Ommen, T. D., Blankenship, D. D., Siegert, M., Young, N. W., Tabacco, I. E., Forieri, A., Passerini, A., Zirizzotti, A., and Frezzotti, M.: Refined broad-scale sub-glacial morphology of Aurora Subglacial Basin, East Antarctica derived by an ice-dynamics-based interpolation scheme, The Cryosphere, 5, 551–560, https://doi.org/10.5194/tc-5-551-2011, 2011.
Rodriguez, S., Hernández-Molina, F. J., Larter, R. D., Rebesco, M., Hillenbrand, C.-D., Lucchi, R. G., and Rodríguez-Tovar, F. J.: Sedimentary model for mixed depositional systems along the Pacific margin of the Antarctic Peninsula: Decoding the interplay of deep-water processes, Mar. Geol., 445, 106754, https://doi.org/10.1016/j.margeo.2022.106754, 2022.
Sadatzki, H., Opdyke, B., Menviel, L., Leventer, A., Hope, J. M., Brocks, J. J., Fallon, S., Post, A. L., O'Brien, P. E., Grant, K., and Armand, L.: Early sea ice decline off East Antarctica at the last glacial-interglacial climate transition. Sci. Adv., 9, eadh9513, https://doi.org/10.1126/sciadv.adh9513, 2023.
Salabarnada, A., Escutia, C., Röhl, U., Nelson, C. H., McKay, R., Jiménez-Espejo, F. J., Bijl, P. K., Hartman, J. D., Strother, S. L., Salzmann, U., Evangelinos, D., López-Quirós, A., Flores, J. A., Sangiorgi, F., Ikehara, M., and Brinkhuis, H.: Paleoceanography and ice sheet variability offshore Wilkes Land, Antarctica – Part 1: Insights from late Oligocene astronomically paced contourite sedimentation, Clim. Past, 14, 991–1014, https://doi.org/10.5194/cp-14-991-2018, 2018.
Saxby, J., Rust, A., Beckett, F., Cashman, K., and Rodger, H.: Estimating the 3D shape of volcanic ash to better understandsedimentation processes and improve atmospheric dispersion modelling, Earth Planet. Sc. Lett., 534, 116075, https://doi.org/10.1016/j.epsl.2020.116075, 2020.
Scherer, R., DeConto, R., Pollard, D., and Alley, R. B.: Windblown Pliocene diatoms and East Antarctic Ice Sheet retreat, Nat. Commun., 7, 12957, https://doi.org/10.1038/ncomms12957, 2016.
Scherer, R. P., Gladenkov, A. Y., and Barron, J. A.: Methods and Applications of Cenozoic Marine Diatom Biostratigraphy, in: Pond Scum to Carbon Sink: Geological and Environmental Applications of the Diatoms, Paleontol. Soc. Short Course, Paleontol. Society Papers, 13, 61–83, edited by: Starratt, S., https://doi.org/10.1017/S1089332600001467, 2007.
Schrader, H. and Gersonde, R.: Diatoms and silicoflagellates, in: Microplaeontological counting methods and techniques – an excercise on an eight metres section of the lower Pliocene of Capo Rossello, Sicily, edited by: Zachariasse, W. J. et al., OCLC, 604485615, Utrecht Micropal. Bull., 17, 129–176, 1978.
Shen, Q., Wang, H., Shum, C. K., Jiang, L., Hsu, H. T., and Dong, J.: Recent high-resolution Antarctic ice velocity maps reveal increate mass loss in Wilkes Land, East Antarctica, Nat. Sci. Rep., 8, 4477, https://doi.org/10.1038/s41598-018-22765-0, 2018.
Shukla, S. K. and Romero, O. E.: Glacial valve size variation of the Southern Ocean diatom Fragilariopsis kerguelensis preserved in the Benguela Upwelling System, southeastern Atlantic, Palaeogeogr. Palaeocl., 499, 112–122, https://doi.org/10.1016/j.palaeo.2018.03.023, 2018.
Siegert, M. J., Barrett, P., DeConto, R., Dunbar, R., O'Cofaigh, C., Passchier, S., and Naish, T.: Review Recent advances in understanding Antarctic climate evolution, Antarct. Sci., 20, 313–325, https://doi.org/10.1017/S0954102008000941, 2008.
Siegert, M. J., Bentley, M. J., Atkinson, A., Bracegirdle, T. J., Convey, P., Davies, B., Downie, R., Hogg, A. E., Holmes, C., Hughes, K. A., Meredith, M. P., Ross, N., Rumble, J., and Wilkinson, J.: Antarctic extreme events, Front. Environ. Sci., 11, 1229283, https://doi.org/10.3389/fenvs.2023.1229283, 2023.
Silvano, A., Rintoul, S. R., and Herraiz-Borreguero, L.: Ocean-ice shelf interaction in East Antarctica, Oceanography, 29, 130–143, https://doi.org/10.5670/oceanog.2016.105, 2016.
Silvano, A., Rintoul, S. R., Peña-Molino, B., and Williams, G. D.: Distribution of water masses and meltwater on the continental shelf near the Totten and Moscow University ice shelves, J. Geophys. Res.-Oceans, 122, 2050–2068, https://doi.org/10.1002/2016JC012115, 2017.
Silvano, A., Rintoul, S. R., Peña-Molino, B., Hobbs, W. R., van Wijk, E., Aoki, S., Tamura, T., and Williams, G. D.: Freshening by glacial meltwater enhance melting of ice shelves and reduces formation of Antarctic Bottom Water, Sci. Adv., 4, eaap9467, https://doi.org/10.1126/sciadv.aap9467, 2018.
Sjunneskog, C., Riesselman, C., Winter D., and Scherer. R.: Fragilariopsis diatom evolution in Pliocene and Pleistocene Antarctic shelf sediments, Micropaleontology, 58, 273–289, 2012.
Skinner, L. C., Muschitiello, F., and Scrivner, A. E.: Marine reservoir age variability over the last deglaciation: implications for marine carbon cycling and prospects for regional radiocarbon calibrations, Paleoceanogr. Paleocl., 34, 1807–1815, https://doi.org/10.1029/2019PA003667, 2019.
Smethie, W. and Jacobs, S.: Circulation and melting under the Ross Ice Shelf: estimates from evolving CFC, salinity and temperature fields in the Ross Sea, Deep-Sea Res. Pt. II, 52, 959–978, https://doi.org/10.1016/j.dsr.2004.11.016, 2005.
Smith, J. A., Graham, A. G. C., Post, A. L., Hillenbrand, C. D., Bart, P. J., and Powell, R. D.: The marine geological imprint of Antarctic ice shelves, Nat. Commun., 10, 5635, https://doi.org/10.1038/s41467-019-13496-5, 2019.
Stow, D. and Smillie, Z.: Distinguishing between Deep-Water Sediment Facies: Turbidites, Contourites and Hemipelagites, Geosciences, 10, 68, https://doi.org/10.3390/geosciences10020068, 2020.
Tachikawa, K., Rapuc, W., Dubois-Dauphin, Q., Guihou, A., and Skonieczny, C.: Reconstruction of ocean circulation based on Neodymium isotopic composition – Potential Limitations and Application to the Mid-Pleistocene Transition, Oceanography, 33, 80–87, https://doi.org/10.5670/oceanog.2020.205, 2020.
Taylor-Silva, B. I. and Riesselman, C. R.: Polar Frontal Migration in the Warm Late Pliocene: Diatom Evidence from the Wilkes Land Margin, East Antarctica, Paleoceanogr. Paleocl., 33, 76–92, https://doi.org/10.1002/2017PA003225, 2018.
Tangunan, D., Berke, M. A., Cartagena-Sierra, A., Flores, J. A., Gruetzner, J., Jiménez-Espejo, F., LeVay, L. J., Baumann, K. H., Romero, O., Saavedra-Pellitero, M., Coenen, J. J., Starr, A., Hemming, S. R., Hall, I. R., and Expedition 361 Science Party: Strong glacial-interglacial variability in upper ocean hydrodynamics, biogeochemistry, and productivity in the southern Indian Ocean, Comm. Earth Environ., 2, 80, https://doi.org/10.1038/s43247-021-00148-0, 2021.
Tauxe, L. and Kent, D. V.: A simplified statistical model for the geomagnetic field and the detection of shallow bias in paleomagnetic inclinations: Was the ancient field dipolar?, in: Timescales of the Paleomagnetic Field, Geoph. Monograph Series, 145, 101–115, American Geophysical Union, https://doi.org/10.1029/145GM08, 2004.
Tauxe, L., Banerjee, S. K., Butler, R. F., and van der Voo, R.: Essentials of paleomagnetism, University of California Press, 489 pp., ISBN 978-0520260313, 2010.
Tauxe, L., Stickley C. E., Sugisaki, S., Bijl, P. K., Bohaty, S. M., Brinkhuis, H., Escutia, C., Flores, J. A., Houben, A. J. P., Iwai, M. Jiménez-Espejo, F. McKay, R., Passchier, S., Pross, J., Riesselman, C. R., Röhl, U., Sangiorgi, F., Welsh, K., Klaus, A., Fehr, A., Bendle, J. A. P., Dunbar, R., Gonzàlez, J., Hayden, T., Katsuki, K., Olney, M. P., Pekar, S. F., Shrivastava, P. K., van de Flierdt, T., Williams, T., and Yamane, M.: Chronostratigraphic framework for the IODP Expedition 318 cores from the Wilkes Land Margin: Constraints for paleoceanographic reconstruction, Paleoceanography, 27, PA2214, https://doi.org/10.1029/2012PA002308, 2012.
Thompson, A. F., Stewart, A. L., Spence, P., and Heywood, K. J.: The Antarctic Slope Current in a Changing Climate, Rev. Geophys., 56, 741–770, https://doi.org/10.1029/2018RG000624, 2018.
Tolotti, R. and Leventer, A.: Diatom data from voyage 1 of the Investigator, 2017 – PC03 analysis, Ver. 1, Australian Antarctic Data Centre [data set], https://doi.org/10.26179/3f8v-tq32, 2022.
Tolotti, R., Bárcena, M. A., Macrì, P., Caburlotto, A., Bonci, M. C., De Santis, L., Donda, F., Corradi, N., and Crosta, X.: Wilkes Land Late Pleistocene Diatom Age Model: from Bio-Events to Quantitative Biostratigraphy, Revue de Micropaleontologìe, 61, 81–96, https://doi.org/10.1016/j.revmic.2018.05.001, 2018.
Tolotti, R., Duffy, M., Isabel, D., Kendall, M., Donda, F., Romeo, R., Geletti, R., Caburlotto, A., Armand, L., O'Brien, P., Leventer, A., De Santis, L., and Corradi, N.: Sabrina Coast (East Antarctica) depositional processes highlighted through stratigraphic and paleoenvironmental diatom analysis, Geophys. Res. Abstr., EGU2019-16970, EGU General Assembly 2019, Vienna, Austria, 2019.
Touchard, Y. and Rochette, P.: Determining tephra fall deposit thickness in sedimentary record from magnetic susceptibility curve: Example of four Ethiopian tephras, Geochem. Geophy. Geosy., 5, Q01009, https://doi.org/10.1029/2003GC000628, 2004.
Urlaub, M., Talling, P. J., Zervos, A., and Masson, D.: What causes large submarine landslides on low gradient (<2°) continental slopes with slow (∼ 0.15 m/kyr) sediment accumulation?, J. Geophys. Res.-Sol. Ea., 120, 6722–6739, https://doi.org/10.1002/2015JB012347, 2015.
Urlaub, M., Geersen, J., Krastel, S., and Schwenk, T.: Diatom ooze: Crucial for the generation of submarine mega-slides?, Geology, 46, 331–334, https://doi.org/10.1130/G39892.1, 2018.
van der Bilt, W., Cederstrøm, J. M., Støren, E., Berben, S., and Rutledal, S.: Rapid Tephra Identification in Geological Archives with Computed Tomography: Experimental Results and Natural Applications, Front. Earth Sci., 8, 622386, https://doi.org/10.3389/feart.2020.622386, 2021.
Volpi, V., Camerlenghi, A., Hillenbrand, C. D., Rebesco, M., and Ivaldi, R.: Effects of biogenic silica on sediment compaction and slope stability on the Pacific margin of the Antarctic Peninsula, Basin Res., 15, 339–363, http://hdl.handle.net/10013/epic.19737 (last access: 31 August 2024), 2003.
Warnock, J. and Scherer, R.: A revised method for determining the absolute abundance of diatoms, J. Paleolimnol., 53, 157–163, https://doi.org/10.1007/s10933-014-9808-0, 2015.
Wakatsuchi, M., Ohshima, K. I., Hishida, M., and Naganobu, M.: Observations of a street of cyclonic eddies in the Indian Ocean sector of the Antarctic Divergence, J. Geophys. Res.-Oceans, 99, 20417–20426, https://doi.org/10.1029/94JC01478, 1994.
Whitehead, J. M., Quilty, P. G., McKelvey, B. C., and O'Brien, P. E.: A review of the Cenozoic stratigraphy and glacial history of the Lambert Graben–Prydz Bay region, East Antarctica, Antarct. Sci., 18, 83–99, https://doi.org/10.1017/S0954102006000083, 2006.
Whiting, M. and Schrader, H.: Actinocyclus ingens Rattray: Reinvestigation of a Polymorphic Species, Micropaleontology, 31, 68–75, https://doi.org/10.2307/1485582, 1985.
Whitworth, T., Orsi, A., Kim, S. J., Nowlin, W., and Locarnini, R.: Water masses and mixing near the Antarctic Slope Front, in: Ocean, Ice, and atmosphere: Interactions at the Antarctic continental margin, edited by: Stanley, S., Jacobs, R., and Weiss, F., American Geophysical Union, Antarctic Research Series, 1–27, https://doi.org/10.1029/AR075, 1998.
Wiemer, G. and Kopf, A.: Altered marine tephra deposits as potential slope failure planes?, Geo-Mar. Lett., 35, 305–314, https://doi.org/10.1007/s00367-015-0408-4, 2015.
Williams, G., Herraiz-Borreguero, L., Roquet, F., Tamura, T., Ohshima, K. I., Fukamachi, Y., Fraser, A. D., Gao, L., Chen, H., McMahon, C. R., Harcourt, R., and Hindell, M.: The suppression of Antarctic bottom water formation by melting ice shelves in Prydz Bay, Nat. Commun., 7, 12577, https://doi.org/10.1038/ncomms12577, 2016.
Williams, G. D., Meijers, A. J. S., Poole, A., Mathiot, P., Tamura, T., and Klocker, A.: Late winter oceanography off the Sabrina and BANZARE coast (117–128° E), East Antarctica, Deep-Sea Res. Pt. II, 58, 1194–1210, https://doi.org/10.1016/j.dsr2.2010.10.035, 2011.
Wilson, D. J., van de Flierdt, T., McKay, R. M., and Naish, T. R.: Pleistocene Antarctic climate variability: ice sheet, ocean and climate interactions, in: Antarctic Climate Evolution, 2nd Edn., edited by: Florindo, F., Siegert, M., De Santis, L., and Naish, T., Elsevier, ISBN 978-0-12-819109-5, 2022.
Winckler, G., Lamy, F., Alvarez Zarikian, C. A., Arz, H. W., Basak, C., Brombacher, A., Esper, O. M., Farmer, J. R., Gottschalk, J., Herbert, L. C., Iwasaki, S., Lawson, V. J., Lembke-Jene, L., Lo, L., Malinverno, E., Michel, E., Middleton, J. L., Moretti, S., Moy, C. M., Ravelo, A. C., Riesselman, C. R., Saavedra-Pellitero, M., Seo, I., Singh, R. K., Smith, R. A., Souza, A. L., Stoner, J. S., Venancio, I. M., Wan, S., Zhao, X., and Foucher McColl, N.: Site U1541, in: Dynamics of the Pacific Antarctic Circumpolar Current, edited by: Lamy, F., Winckler, G., Alvarez Zarikian, C. A., and the Expedition 383 Scientists, Proceedings of the Inter. Ocean Discovery Program, 383, College Station, TX, https://doi.org/10.14379/iodp.proc.383.105.2021, 2021.
Winter, D., Sjunneskog, C., Scherer, R., Maffoli, P., Riesselman, C., and Harwood, D.: Pliocene-Pleistocene diatom biostratigraphy of nearshore Antarctica from the AND-1B drillcore, McMurdo Sound, Global Planet. Change, 96–97, 59–74, https://doi.org/10.1016/j.gloplacha.2010.04.004, 2012.
Witkowski, J., Bohaty, S. M., Edgar, K. M., and Harwood, D. M.: Rapid fluctuations in mid-latitude siliceous plankton production during the Middle Eocene Climatic Optimum (ODP Site 1051, Western North Atlantic), Mar. Micropaleontol., 106, 110–129, https://doi.org/10.1016/j.marmicro.2014.01.001, 2014.
Wu, L., Wilson, D. J., Wang, R., Yin, X., Chen, Z., Xiao, W., and Huang, M.: Evaluating ratio from XRF scanning as an indicator of Grain-Size variations of glaciomarine sediments in the Southern Ocean, Geochem. Geophy. Geosy., 21, e2020GC009350, https://doi.org/10.1029/2020GC009350, 2020.
Xiaoling, T., Fengyin, L., Liming, H., Reed, A. H., Furukawa, Y., and Guoping, Z.: Evaluation of the particle sizes of four clay minerals, Appl. Clay Sci., 135, 313–324, https://doi.org/10.1016/j.clay.2016.10.012, 2017.
Xuan, C., Jin, Y., Sugisaki, S., Satoguchi, Y., and Nagahashi, Y.: Integrated Pliocene-Pleistocene magnetostratigraphy and tephrostratigraphy of deep-sea sediments at IODP Site U1424 (Yamato Basin, Japan Sea), Prog. Earth Planet. Sci., 7, 60, https://doi.org/10.1186/s40645-020-00373-9, 2020.
Yanagisawa, Y. and Akiba F.: Taxonomy and phylogeny of the tree marine diatom genera, Crucidenticula, Denticulopsis and Neodenticula, Bull. Geol. Surv. Japan, 41, 197–301, 1990.
Yin, Q. Z. and Berger, A.: Interglacial analogues of the Holocene and its natural near future, Quaternary Sci. Rev., 120, 28–46, https://doi.org/10.1016/j.quascirev.2015.04.008, 2015.
Young, D. A., Wright, A. P., Roberts, J. L., Warner, R. C., Young, N. W., Greenbaum, J. S., Schroeder, D. M., Holt, J. W., Sugden, D. E., Blankenship, D. D., Van Ommen, T. D., and Seigert, M. J.: A dynamic early East Antarctic Ice Sheet suggested by ice covered fjord landscapes, Nature, 474, 72–75, https://doi.org/10.1038/nature10114, 2011.
Yuming, L., Xingxing, L., and Youbin, S.: QGrain: An ope-source and easy-to-use software for the comprehensive analysis of grain size distributions, Sediment. Geol., 423, 105980, https://doi.org/10.1016/j.sedgeo.2021.105980, 2021.
Zhang, Z., Nisancioglu, K., and Ninnemann, U.: Increased ventilation of Antarctic deep water during the warm mid-Pliocene, Nat. Commun., 4, 1499, https://doi.org/10.1038/ncomms2521, 2013.
Zielinski, U. and Gersonde, R.: Plio-Pleistocene diatom biostratigraphy from ODP Leg 177, Atlantic sector of the Southern Ocean, Mar. Micropaleontol., 45, 225–268, https://doi.org/10.1016/S0377-8398(02)00031-2, 2002.
Zijderveld, J. D. A.: A. C. demagnetization in rocks: Analysis of results, in: Methods in Paleomagnetism, edited by: Collinson, D. W., Creer, K. M., and Runcorn, S. K., Elsevier, 254–286, https://doi.org/10.1016/B978-1-4832-2894-5.50049-5, 1967.