the Creative Commons Attribution 4.0 License.
the Creative Commons Attribution 4.0 License.
 | 16 Mar 2026
Unraveling Southern Ocean diatom diversity across the Eocene–Oligocene transition
Volkan Özen
Johan Renaudie
David Lazarus
The Eocene–Oligocene transition (EOT) was a critical interval of global cooling and circulation change that reshaped marine ecosystems. However, current knowledge of diatom diversity and community dynamics during this interval relies mainly on biostratigraphic compilations, which largely document common species and thus likely underestimate true diversity. This study provides a more complete picture of Southern Ocean diatom communities across the EOT by using comprehensive quantitative surveys from four sites spanning the Atlantic and Indian Ocean sectors. Results reveal a consistent pattern across sites, with two major shifts in community composition around 37–36 and 34 Ma, linked to major environmental change. Following a prolonged interval of diversification without substantial extinction in the late Eocene, we identify a pronounced extinction event approximately 1 Myr after the Eocene–Oligocene boundary (E–O, ∼33.9 Ma). This suggests that significant changes in surface ocean conditions lagged the boundary and varied across the Southern Ocean. These findings highlight the interplay between global climate changes and local environmental factors in shaping diatom communities. By capturing detailed patterns of diatom diversity and extinction, our study improves our understanding of past ecological responses.
- Article
(16243 KB) - Full-text XML
-
Supplement
(4423 KB) - BibTeX
- EndNote


Marine diatoms are photosynthetic algae that build their shells from silica. They contribute about a quarter of global marine productivity, export roughly 40 % of the organic carbon from surface waters to the deep ocean, and are the main exporters of silica (Falkowski et al., 1998; Tréguer et al., 2018; Behrenfeld et al., 2021). Dominating both primary productivity and silica export, diatoms link together the carbon and silica cycles while sustaining the vast oceanic biome across seasonal cycles. The position of diatoms at the intersection of the bio- and geospheres makes the geological record of their evolution and abundance particularly significant. Today, diatom communities are being reshaped by broad, overlapping stressors, including warmer surface waters, stronger water column stratification, shifts in upwelling, ocean acidification, and patterns of sea ice and wind (e.g., Marinov et al., 2010; Hinder et al., 2012; Bach and Taucher, 2019; Henson et al., 2021). Understanding how such pressures influence community dynamics is therefore critical. The geological record of diatoms allows us to trace past interactions between climate drivers and diatom communities (e.g., Crampton et al., 2016), particularly where changes in ocean circulation, sea surface temperature, and nutrient availability were pronounced. Insights across the Eocene–Oligocene boundary (E–O, ∼33.9 Ma), when these drivers shifted dramatically, can help to predict how modern diatom communities may respond to ongoing environmental change.
The transition from the late Eocene to early Oligocene (EOT; here referring to the broader Myr interval spanning both epochs) marks a major reorganization in diatom communities, characterized by increased diversity and abundance (Lazarus et al., 2014; Barron et al., 2015; Renaudie, 2016). During this interval, opal sedimentation in the southern high latitudes suggests the development of a modern-like diatom belt, similar to that associated with the present-day Antarctic Circumpolar Current (ACC) (Renaudie, 2016). These changes broadly align with high-latitude cooling and the E–O. This was the largest climatic state-shift of the Cenozoic, a transition to a “coldhouse” climate with the establishment of the permanent Antarctic ice sheet, likely driven by crossing an atmospheric pCO2 threshold and changing circulation patterns (DeConto and Pollard, 2003; Kennett, 1977; Pagani et al., 2005; Shackleton and Kennett, 1975). The proto-Antarctic Circumpolar Current (proto-ACC) also developed during this time and potentially contributed to Antarctic glaciation by enhancing the thermal isolation of Antarctica (Kennett, 1977; Scher and Martin, 2006; Toumoulin et al., 2020). A stronger circulation system may also have enhanced nutrient upwelling, and stimulated diatom productivity, community change and carbon export (e.g., Diester-Haass and Zahn, 1996; Salamy and Zachos, 1999; Egan et al., 2013; Rodrigues De Faria et al., 2024). Previous studies have suggested that diatoms not only diversified but may have contributed to cooling through CO2 sequestration (e.g., Egan et al., 2013). Yet the extent of diatom diversity and timing of community composition change across the EOT remains poorly constrained, relying mainly on diversity-incomplete biostratigraphical compilations (Lazarus et al., 2014), which underscores the need for more comprehensive species-level data.
We present a comprehensive record of Southern Ocean diatom diversity across the EOT from approximately 40 to 30 Ma from sites in both the Atlantic and Indian sectors. Previous studies have often underestimated diatom diversity in these regions due to reliance on biostratigraphic data, which have mainly focused on stratigraphically important species while not recording full community diversity (e.g., Gombos and Ciesielski, 1983; Barron et al., 2014). To address this gap, we conducted an exhaustive survey by counting nearly all preserved species, allowing for a more accurate and detailed understanding of diatom diversity and community evolution. The new data reveal much higher diversity and previously unrecognized shifts in diatom assemblages. Our results deepen the understanding of diatom response to changes in climate during the EOT, refine projections of future adaptability, and fill a key gap in the marine plankton fossil record.
2.1 Site selection rationale
We targeted two sub-Antarctic sites, DSDP 511 (Falkland Plateau) and ODP 1090B (Agulhas Ridge), because they retain continuous diatom record across the Eocene–early Oligocene and record large shifts in biogenic opal that track the development of Southern Ocean (SO) fronts and the emerging ACC (Anderson and Delaney, 2005; Plancq et al., 2014; Renaudie, 2016; see Fig. 1). To contrast these archives, we also focused on ODP sites 689D (Maud Rise) and 748B (Kerguelen Plateau), which are closer to the Antarctic continent and show low diatom abundance throughout most of the late Eocene. However, both record a pronounced shift in biogenic opal deposition near the E–O (e.g., Diester-Haass and Zahn, 1996; Salamy and Zachos, 1999; Fig. 1). These Antarctic-proximal sites allow us to explore how glacial and oceanographic reorganizations near the continent influenced diatom communities. Taken together, the four sites span key latitudinal and environmental gradients, enabling comparison of regional diatom responses to EOT climate change.
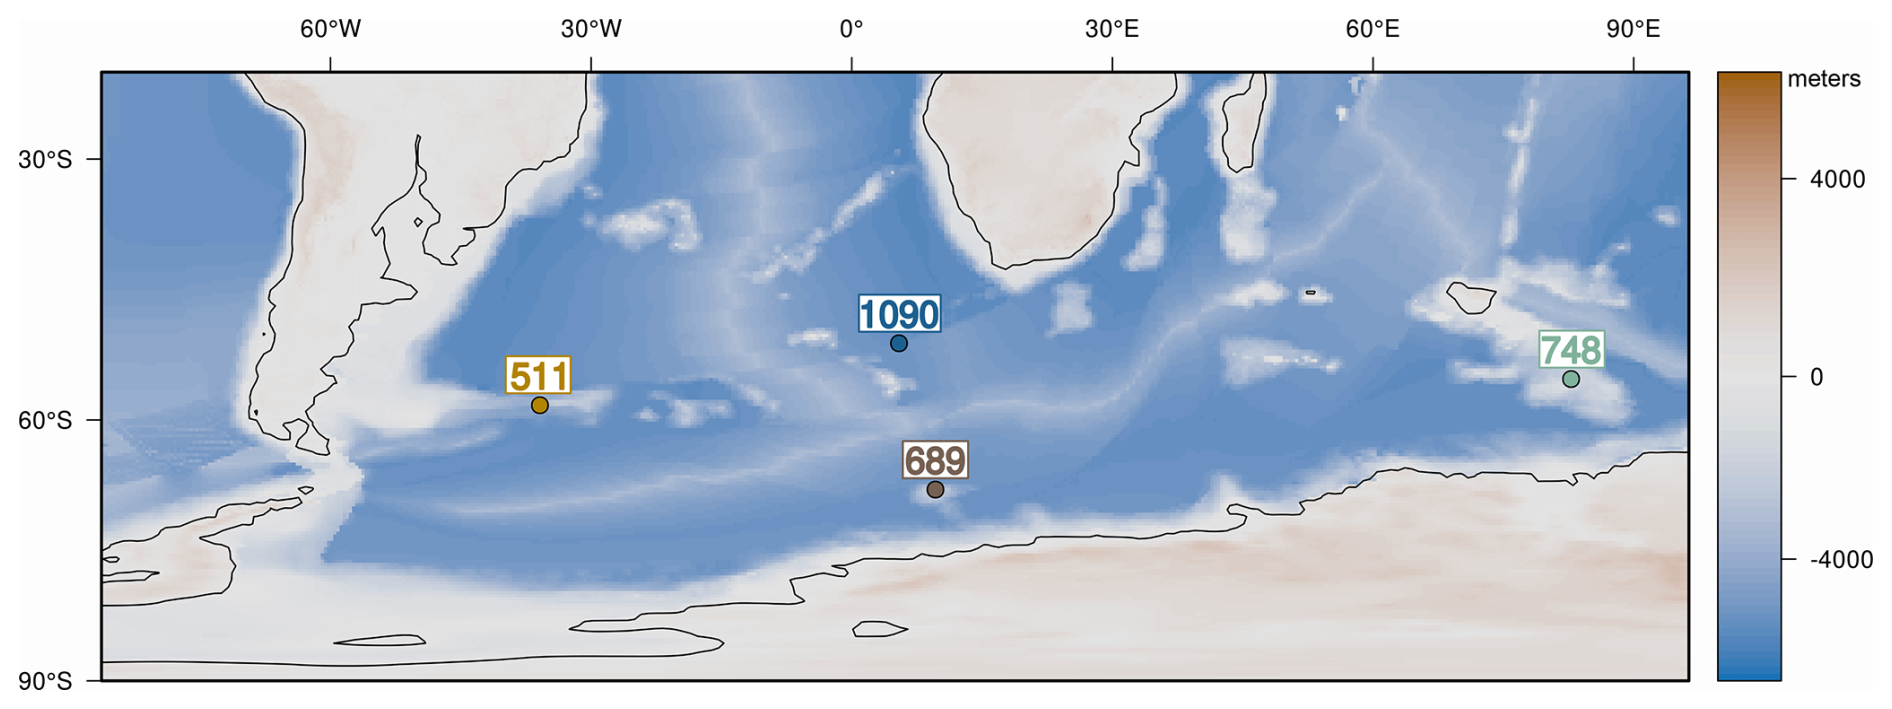
Figure 1(a) Site map with late-Eocene continental configuration in the Southern Ocean. (b) Paleodepth and paleolatitude profile of studied sites during the late Eocene. The estimated paleodepths for the studied sites are as follows: site 1090: ∼3000–3300 m (Pusz et al., 2011), DSDP 511: ∼2000–2500 m (Basov and Krasheninikov, 1983), ODP 689: ∼1500 m (Diester-Haass and Zahn, 1996), and ODP 748: ∼1200 m (Wright et al., 2018). The paleogeographic and paleobathymetry are derived from the reconstructions of Straume et al. (2022).
2.2 Material
We analyzed 61 samples from sites in the Atlantic and Indian ocean sectors of the SO (Fig. 1). Sampling density was determined by balancing the need for capturing meaningful diversity trends with the time-consuming nature of performing detailed diatom diversity surveys for each site. We specifically targeted the intervals that offered the best opportunities for meaningful analysis, prioritizing well-preserved sections where available while also including sections with less optimal preservation to ensure adequate temporal coverage. These intervals span the late Eocene to the earliest Oligocene, as well as the middle- to late-Eocene transition – also a critical phase in the history of SO plankton and productivity (e.g., Diester-Haass and Zahn; 1996; Pascher et al., 2015; Rodrigues De Faria et al., 2024). Variations in sedimentation rates, preservation quality, presence of hiatuses, and sample availability, particularly at DSDP 511 and ODP 1090 in the earliest Oligocene, influenced the differing age ranges at each site.
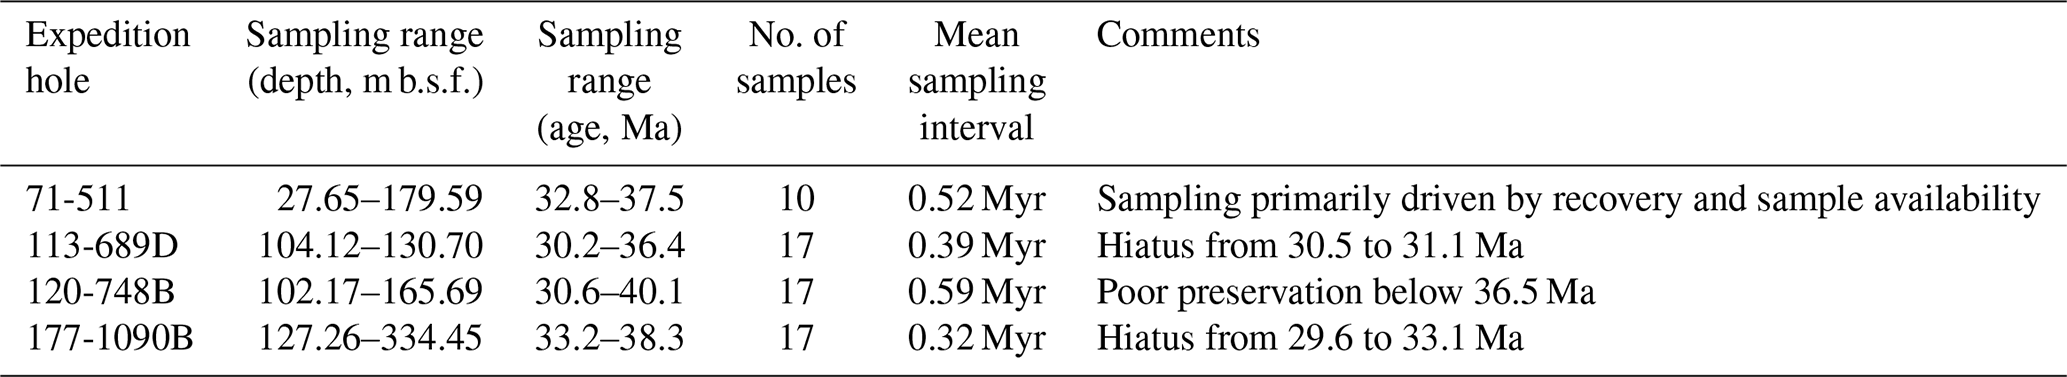
Qualitative preservation assessments were conducted for all samples, accounting for preserved fine morphological features, intact valves, and the absence of dissolution relicts. Each sample was classified into one of three categories: poor, fair, or good (see Fig. S1 in the Supplement for individual assessments). We note that site 511 is the only site in our study not primarily recovered with modern drilling methods (drill string heave compensator, hydraulic piston core, and/or XPC), and the initial core descriptions show the typical disturbance of fine-scale sediment structure by heave-uncompensated rotary drilling. However, at the between-core resolution of our sampling, we have not noted any drilling-related distortion of the stratigraphic record. The stratigraphic integrity of the studied interval has also been documented in prior detailed biostratigraphic studies of this site (e.g., Gombos and Ciesielski, 1983). Table 1 provides an overview of the sampled intervals, age ranges, and key site-specific details, while stratigraphic sections and sampled horizons for each site are shown in Fig. S1.
Table 1Summary of samples studied here. Mean sampling pace corresponds to the mean age difference between two consecutive samples.
Age models
All age models were updated and revised as part of this research. Detailed descriptions of the updated age models are available in Rodrigues De Faria et al. (2024) and can also be accessed through the Neptune database (Renaudie et al., 2020, 2023). Ages are calculated using the 2012 version of the Geomagnetic Polarity Time Scale (GPTS) (Gradstein et al., 2012).
2.3 Sample preparation
Microscope slides were prepared following a version of the procedures described by Moore (1973) and Lazarus (1994) for radiolarian analysis but modified for diatoms. A measured quantity of dry sediments, approximately 0.5 to 1 g, was treated with hydrogen peroxide (H2O2) and pentasodium triphosphate (Na5P3O10) over low heat, followed by treatment with hydrochloric acid (HCl). The resulting solution was then sieved through a 10 µm sieve. A measured portion of the residues was then carefully settled over three coverslips at the bottom of a beaker. Our method ensures the random settling of the residue material over the coverslips, preventing the possible biases that might arise during the species enumeration phase (see Lazarus, 1994, for the detailed procedure).
2.4 Diatom species diversity and its analyses
2.4.1 Species-level diversity
In both ecological and evolutionary research, the concept of diversity can have multiple meanings depending on the context of the study. In this paper, we define diversity as total species richness. Evenness, often also used as a component of diversity metrics, is here treated as a separate variable. To reconstruct SO diatom diversity across four different SO sites – DSDP 511 and ODP sites 1090B, 748B, and 689D – we analyzed 61 samples in which a total of 51 302 individual diatom valves were counted (see Fig. S1). Our methodology follows a simplified version of a previously established protocol (Renaudie and Lazarus, 2013), where specimens were identified and counted at the species level whenever possible. Counting continued until the species accumulation curve began to flatten, typically around 1000 or more specimens, although this threshold varied significantly based on diatom abundance. In cases where the total diatom abundance was too low in a given sample to achieve a flattened species accumulation curve, all specimens were counted exhaustively.
Raw diversity values almost always underestimate the true total diversity due to differences in sampling effort. To address these differences, we calculated Chao1 diversity estimators (Chao, 1984) based on raw diversity values, along with 95 % confidence intervals for each estimate. This approach allowed us to provide a more accurate representation of diatom diversity at each site, accounting for variations in sample coverage and ensuring a more robust comparison of diversity both spatially and temporally.
2.4.2 Taxonomy
As many of the specimens encountered were not known to have been named, or have published descriptions, informal counting categories were established as needed, and documented with images and short keyword differential diagnoses. A full list of the counting groups is available on Zenodo (https://doi.org/10.5281/zenodo.14608178, Özen et al., 2025).
2.4.3 Community similarity
Analyzing community similarity can often be a complex task due to the theoretical assumptions and opaque premises that underlie many of the metrics used. While straightforward presence–absence matrices can provide basic comparisons between samples, they often fail to capture the full dynamics of community structure. More complex metrics offer deeper insights, but they come with increased complexity that can obscure interpretations of the results. In the study of diatom communities, understanding the abundance and dominance of specific species over time is crucial for revealing changes in community dynamics.
To capture these nuances, we computed the Morisita–Horn index (Magurran, 2004; p. 176) to assess self-similarity among our samples. The Morisita–Horn index is commonly used to measure the similarity between two communities, with values ranging from 0 (no similarity) to 1 (complete similarity). This index allows us to track the evolution of diatom communities by analyzing both variations in species diversity and relative abundances over time. The Morisita–Horn index is particularly suitable for our study because it is minimally affected by sample size (Wolda, 1981; Magurran, 2004, p. 176), making it a reliable metric for examining community similarity across our SO samples.
2.4.4 Diversity dynamics
Our species-level diversity data provide a unique opportunity to elucidate the diversity dynamics of SO diatoms. However, observed stratigraphic ranges of diatom species often underestimate the actual taxon ranges, complicating the detection of true extinction horizons. To address this evidence-of-absence versus absence-of-evidence dichotomy, we first estimated the possible ranges of species based on gaps in their occurrences. Gaps in taxon occurrences in stratigraphic series have been shown to be a useful source of information to estimate true taxon first and last occurrences (Marshall, 1997). Specifically, we calculated the median (50th percentile) of the gaps in each species' range, regardless of whether these gaps were due to sampling limitations or true absences. This median gap was then added to the first appearance datums (FADs) and last appearance datums (LADs) of each species to provide more accurate estimates of their stratigraphic ranges. Although there is no definitive method to eliminate potential biases in detecting true FADs and LADs, decades of micropaleontological research suggest that this straightforward yet effective protocol minimizes potential pitfalls (Marshall, 1997).
Based on these estimated stratigraphic ranges, we calculated Foote's boundary-crosser extinction rates (per lineage million years; Foote, 2000) by dividing the taxon ranges into equal 0.5 Myr intervals, hereafter referred to as “time bin(s)”. Binning helps to avoid overly noisy signals and maintains a certain level of precision in the case of our SO samples. However, despite our effort to mitigate potential biases, uncertainties in taxon ranges can significantly affect the extinction rates seen in the samples and/or time bins closer to the observed and estimated ends of taxon ranges. This is often termed the edge effect – that extinction and/or origination rates can show artificially high values in the last and first samples, respectively.
To achieve a more comprehensive understanding of SO diatom diversity dynamics, we focused on species that are either shared across all studied sites or within specific subsets of sites, such as those common to DSDP 511 and ODP 689D. This approach is particularly valuable given the significant gaps in the early Oligocene sequences at the sub-Antarctic sites DSDP 511 and ODP 1090B, which limit our ability to track diatom community changes across the E–O. In contrast, the Antarctic sites provide a continuous stratigraphic record through the E–O, with samples extending to younger intervals, approximately dated to 30 Ma, thereby enabling a more consistent analysis of diatom diversity throughout this transition. By concentrating on species shared across these different oceanographic settings, we also aim to present a broader, SO-wide perspective on diatom evolution, reducing the influence of site-specific environmental variabilities in our interpretations.
The metrics and analyses described were calculated using scripts written in Python (Python Software Foundation, version 3.11, available at http://www.python.org, last access: 11 March 2026) or Julia (version 1.10; Bezanson et al., 2012, available at: https://julialang.org/, last access: 11 March 2026). The functions developed for these are publicly available in the GitHub repository at https://github.com/oezenvolkan/Oezenetal2025 (last access: 11 March 2026).
2.4.5 Literature-based diversity estimates
For the sake of comparison with prior knowledge on EOT Southern Ocean diatoms, we also computed diversity and extinction rates for diatoms based on what is recorded in the Neptune database (hereafter NSB; Renaudie et al., 2020, 2023). We selected only those records whose paleolatitude during the time bin of interest fell below 45° S. Sites with poor or very poor age models were discarded. The diversity reported from NSB is the literal number of species encountered per 1 Myr bins. while the extinction rate was calculated using Foote (2000) metrics on SQS subsampled data (with a quota of 0.7 over 100 trials; Alroy, 2010).
3.1 Overall diatom diversity and prior works
Observed and estimated species diversity for each site is summarized in Fig. 2, with approximately 280 diatom species recorded in total. Chao1 estimates (see Sect. 2.4.1) suggest the actual diversity may be even higher (Fig. 2). Our new diversity findings reveal a substantially greater diversity in the southern high latitudes compared to previous studies. For example, the widely used NSB database, which is often referenced in paleo-micropaleontological studies, documents only around 50 species across the EOT in the SO between 40 and 30 Ma (Fig. 2b).
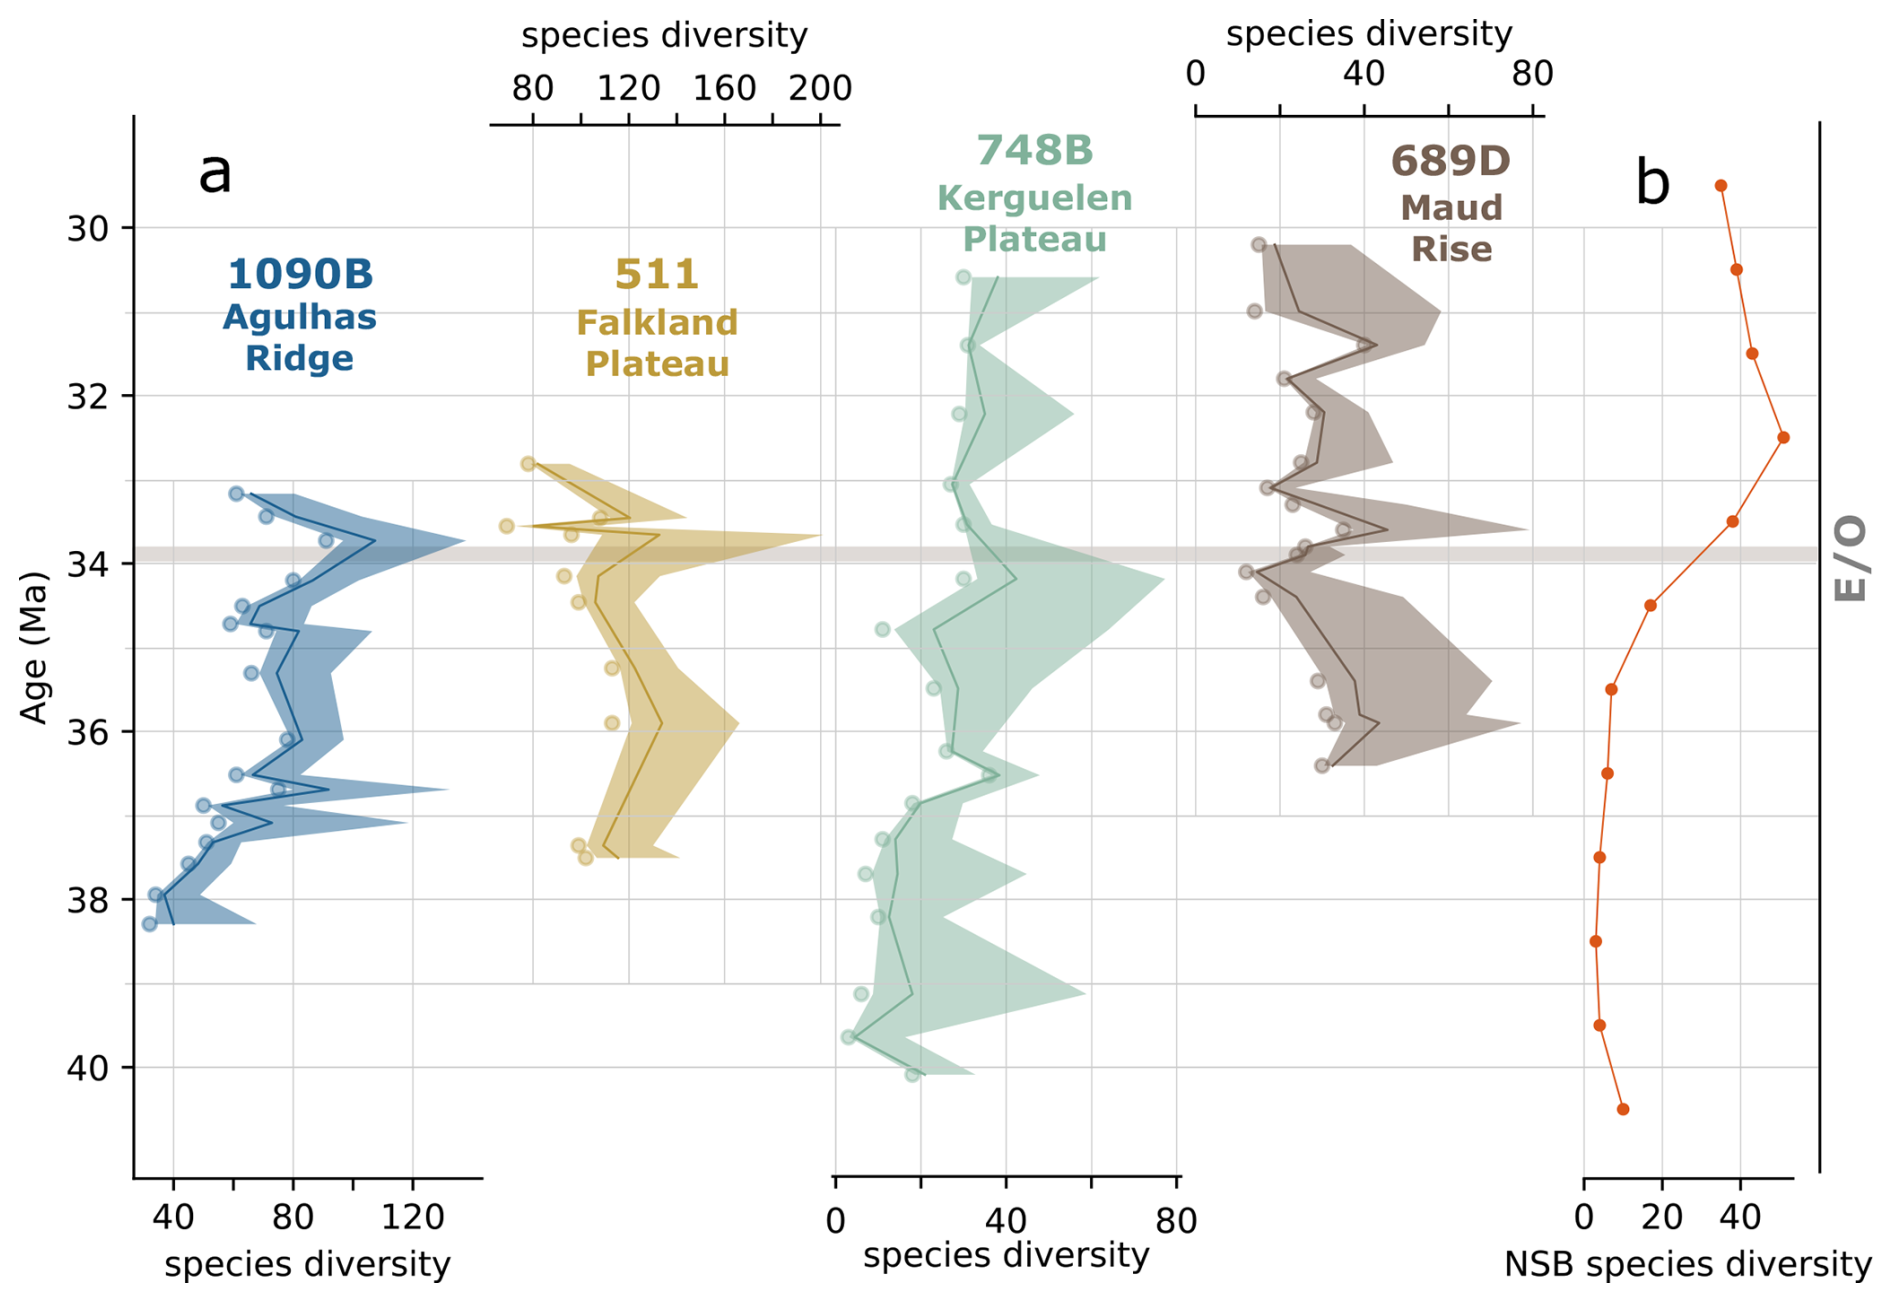
Figure 2(a) Observed diversity (scatter points) and Chao1 diversity estimates with 95 % confidence interval of each site. (b) NSB species diversity for the southern high latitudes. Sites are identified in this and subsequent figures by color: blue for 1090B, green for 748B, yellow for DSDP 511, and brown for 689D. The horizontal gray line marks the Eocene–Oligocene boundary (E–O).
Our results, focused specifically on the southern high latitudes, show at least 3-times-higher diversity than previous studies that have discussed and inferred diatom species diversity and turnover rates on a global scale (e.g., Renaudie et al., 2018). This discrepancy highlights the importance of comprehensive species-level diversity surveys for reconstructing diatom diversity, rather than relying solely on biostratigraphic work-based diversity compilations.
Furthermore, diversity values clearly differ among our studied sites. Sub-Antarctic Atlantic sites (DSDP 511 and ODP 1090) exhibit significantly higher species diversity compared to the Antarctic sites (ODP 689 and 748; Fig. 2a). Here, we focus on the overall trends in species diversity across each site and on composite species diversity representing those shared by all studied sites (Fig. 3a and b), rather than overinterpreting results from individual samples. Exact diversity values and Chao1 estimates are presented in Supplement S1.
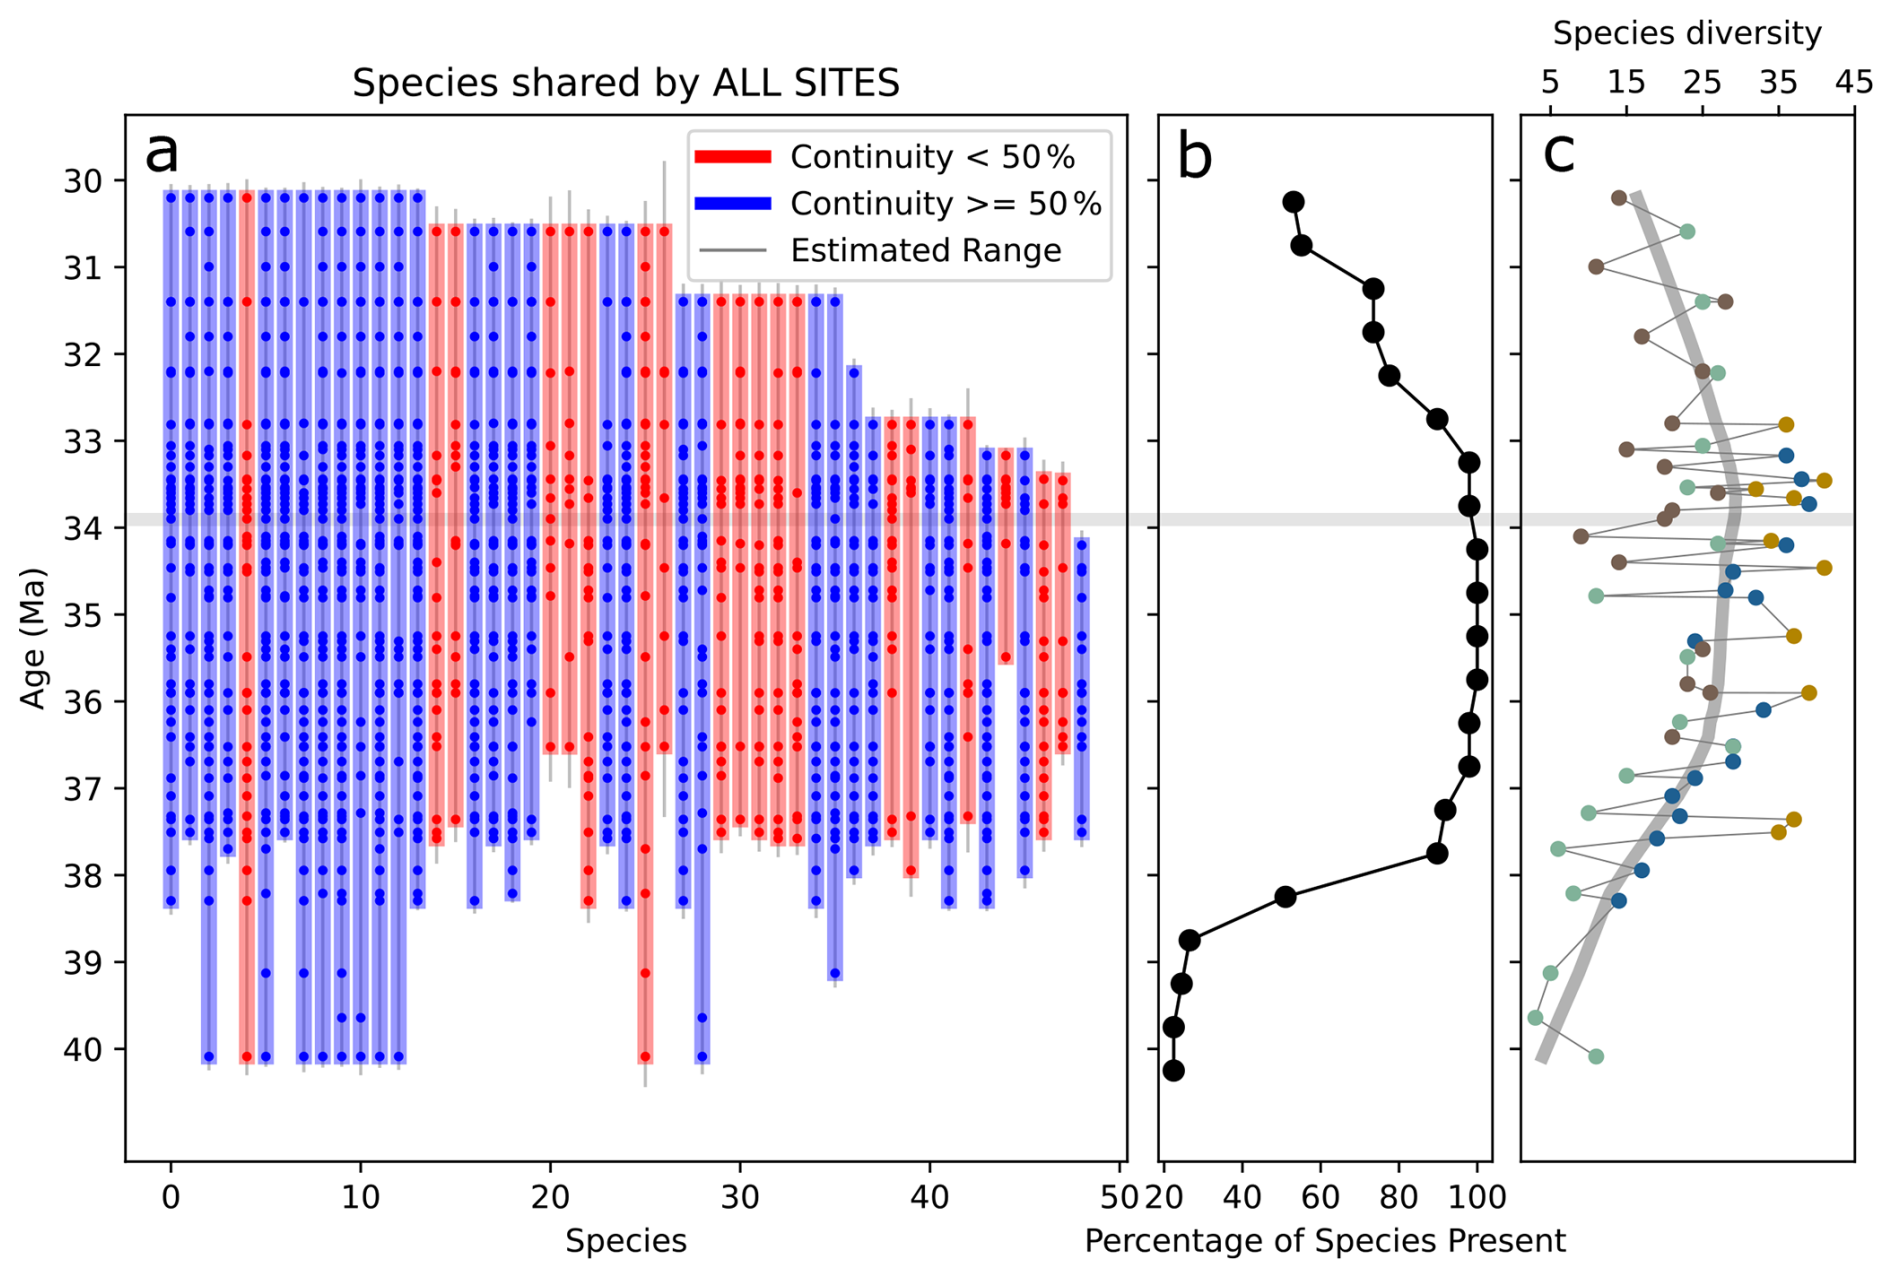
Figure 3(a) Vertical bars show the stratigraphic ranges of diatom species observed at all four Southern Ocean sites. Each bar (blue or red) represents the range of a single species, defined by its first and last occurrences. Dots within the bars mark sampled horizons where the species is present. The color of each vertical bar reflects the proportion of sampled horizons within the species' range in which it is observed: blue bars indicate species occurring in more than 50 % of the horizons they span and red bars otherwise. Thin vertical gray lines show gap-corrected range estimates for each species (see Sect. 2.4.4). The horizontal gray line marks the Eocene–Oligocene boundary (∼33.9 Ma). (b) Percentage of species presence in each 0.5 Myr time bin. (c) Observed species diversity filtered by species shared by all sites. The colors of each data point represent from which site that specific diversity data came from; and the color code follows Fig. 2, with blue for 1090B, green for 748B, yellow for DSDP 511, and brown for 689D.
3.2 Patterns of species diversity change
Across the four SO sites, we identified about 280 diatom species, but only roughly 50 occur consistently at all sites, highlighting strong regional differentiation. The sub-Antarctic sites DSDP 511 and ODP 1090 exhibit higher diversity, each showing two clear richness peaks at ∼36–36.5 Ma and again at ∼33.7 Ma, separated by a marked decline. The Antarctic sites ODP 689 and ODP 748 have lower diversity throughout the studied interval, especially in late-Eocene samples. At ODP site 689, diversity falls in the latest Eocene and then rises to a peak at 33.6 Ma, synchronous with the second peaks at sites DSDP 511 and ODP 1090. ODP site 748 follows a similar pattern, reaching a minimum in the latest Eocene at 34.7 Ma and shows an increase following the E–O. Taken together, the records show a consistent sequence: diversity climbs in the late Eocene (∼36.5–36 Ma), falls between 34.5 and 34 Ma, and rises again around the EOT. Composite species diversity, which combines observations from all sites, reveals broader trends that might otherwise be obscured by site-specific variability (Fig. 3c). This composite record clearly shows an increase in species diversity leading up to the E–O, making a turning point after which diversity begins to decline.
3.3 Diversity dynamics (extinctions)
Extinction rates calculated from updated stratigraphic ranges (see Sect. 2.4.4; Figs. 4 and 5a) show no extinctions during the late Eocene or within the 34–33.5 Ma interval spanning the E–O (Fig. 6a). However, extinction rates consistently increase shortly afterward, peaking within the 33–32.5 Ma interval (Fig. 6a). This peak is evident across all sites combinations analyzed, including the approximately 50 species common to all four sites. The exact values of extinction rates are presented in Supplement S2.
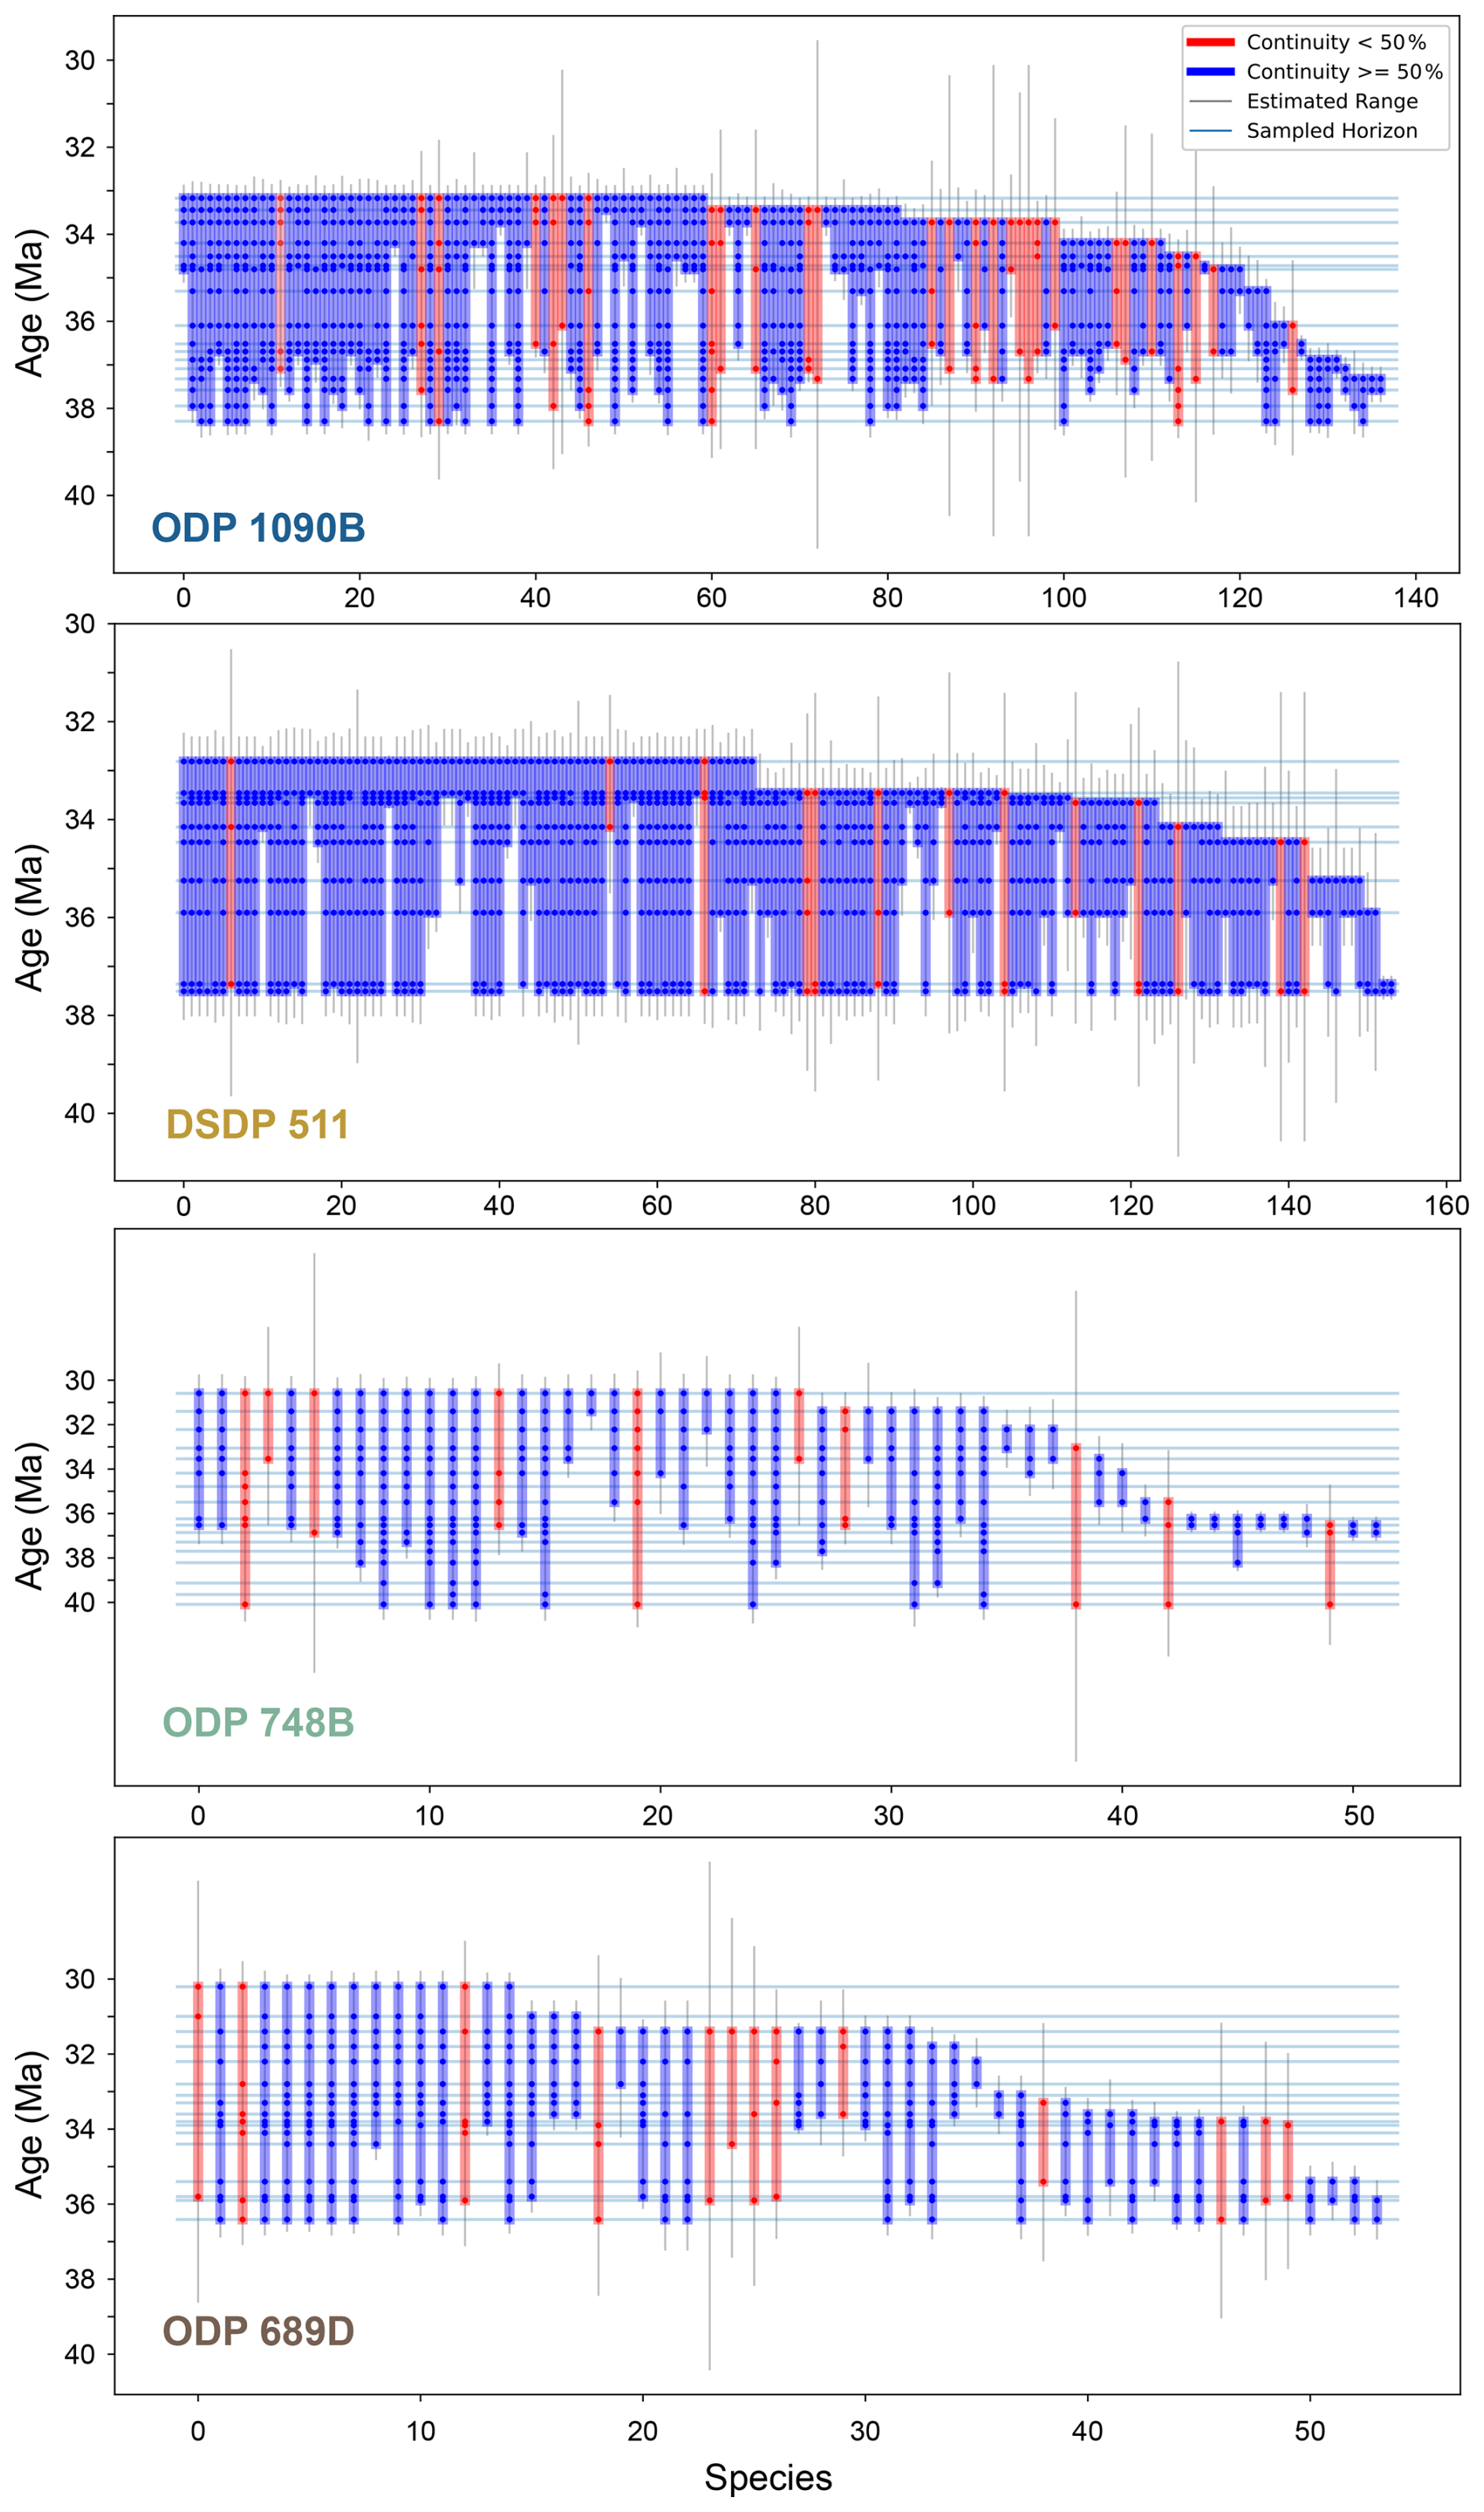
Figure 4Stratigraphic ranges of diatom species at each study site. Each vertical bar (blue or red) represents the observed stratigraphic range of a single species, defined by its first and last occurrences at the corresponding site. The thin horizontal blue lines indicate all sampled horizons. A dot is plotted at the intersection of a species' range and a sampled horizon if the species is present in that sample. The color of each vertical bar reflects the proportion of sampled horizons within the species' range in which it is observed. Blue bars indicate if the species occurs in more than 50 % of the horizons it spans, with red otherwise. Thin vertical gray lines show gap-corrected range estimates for each species (see Sect. 2.4.4). Species recorded in only a single horizon are not shown, as stratigraphic continuity cannot be assessed for single-occurrence taxa.
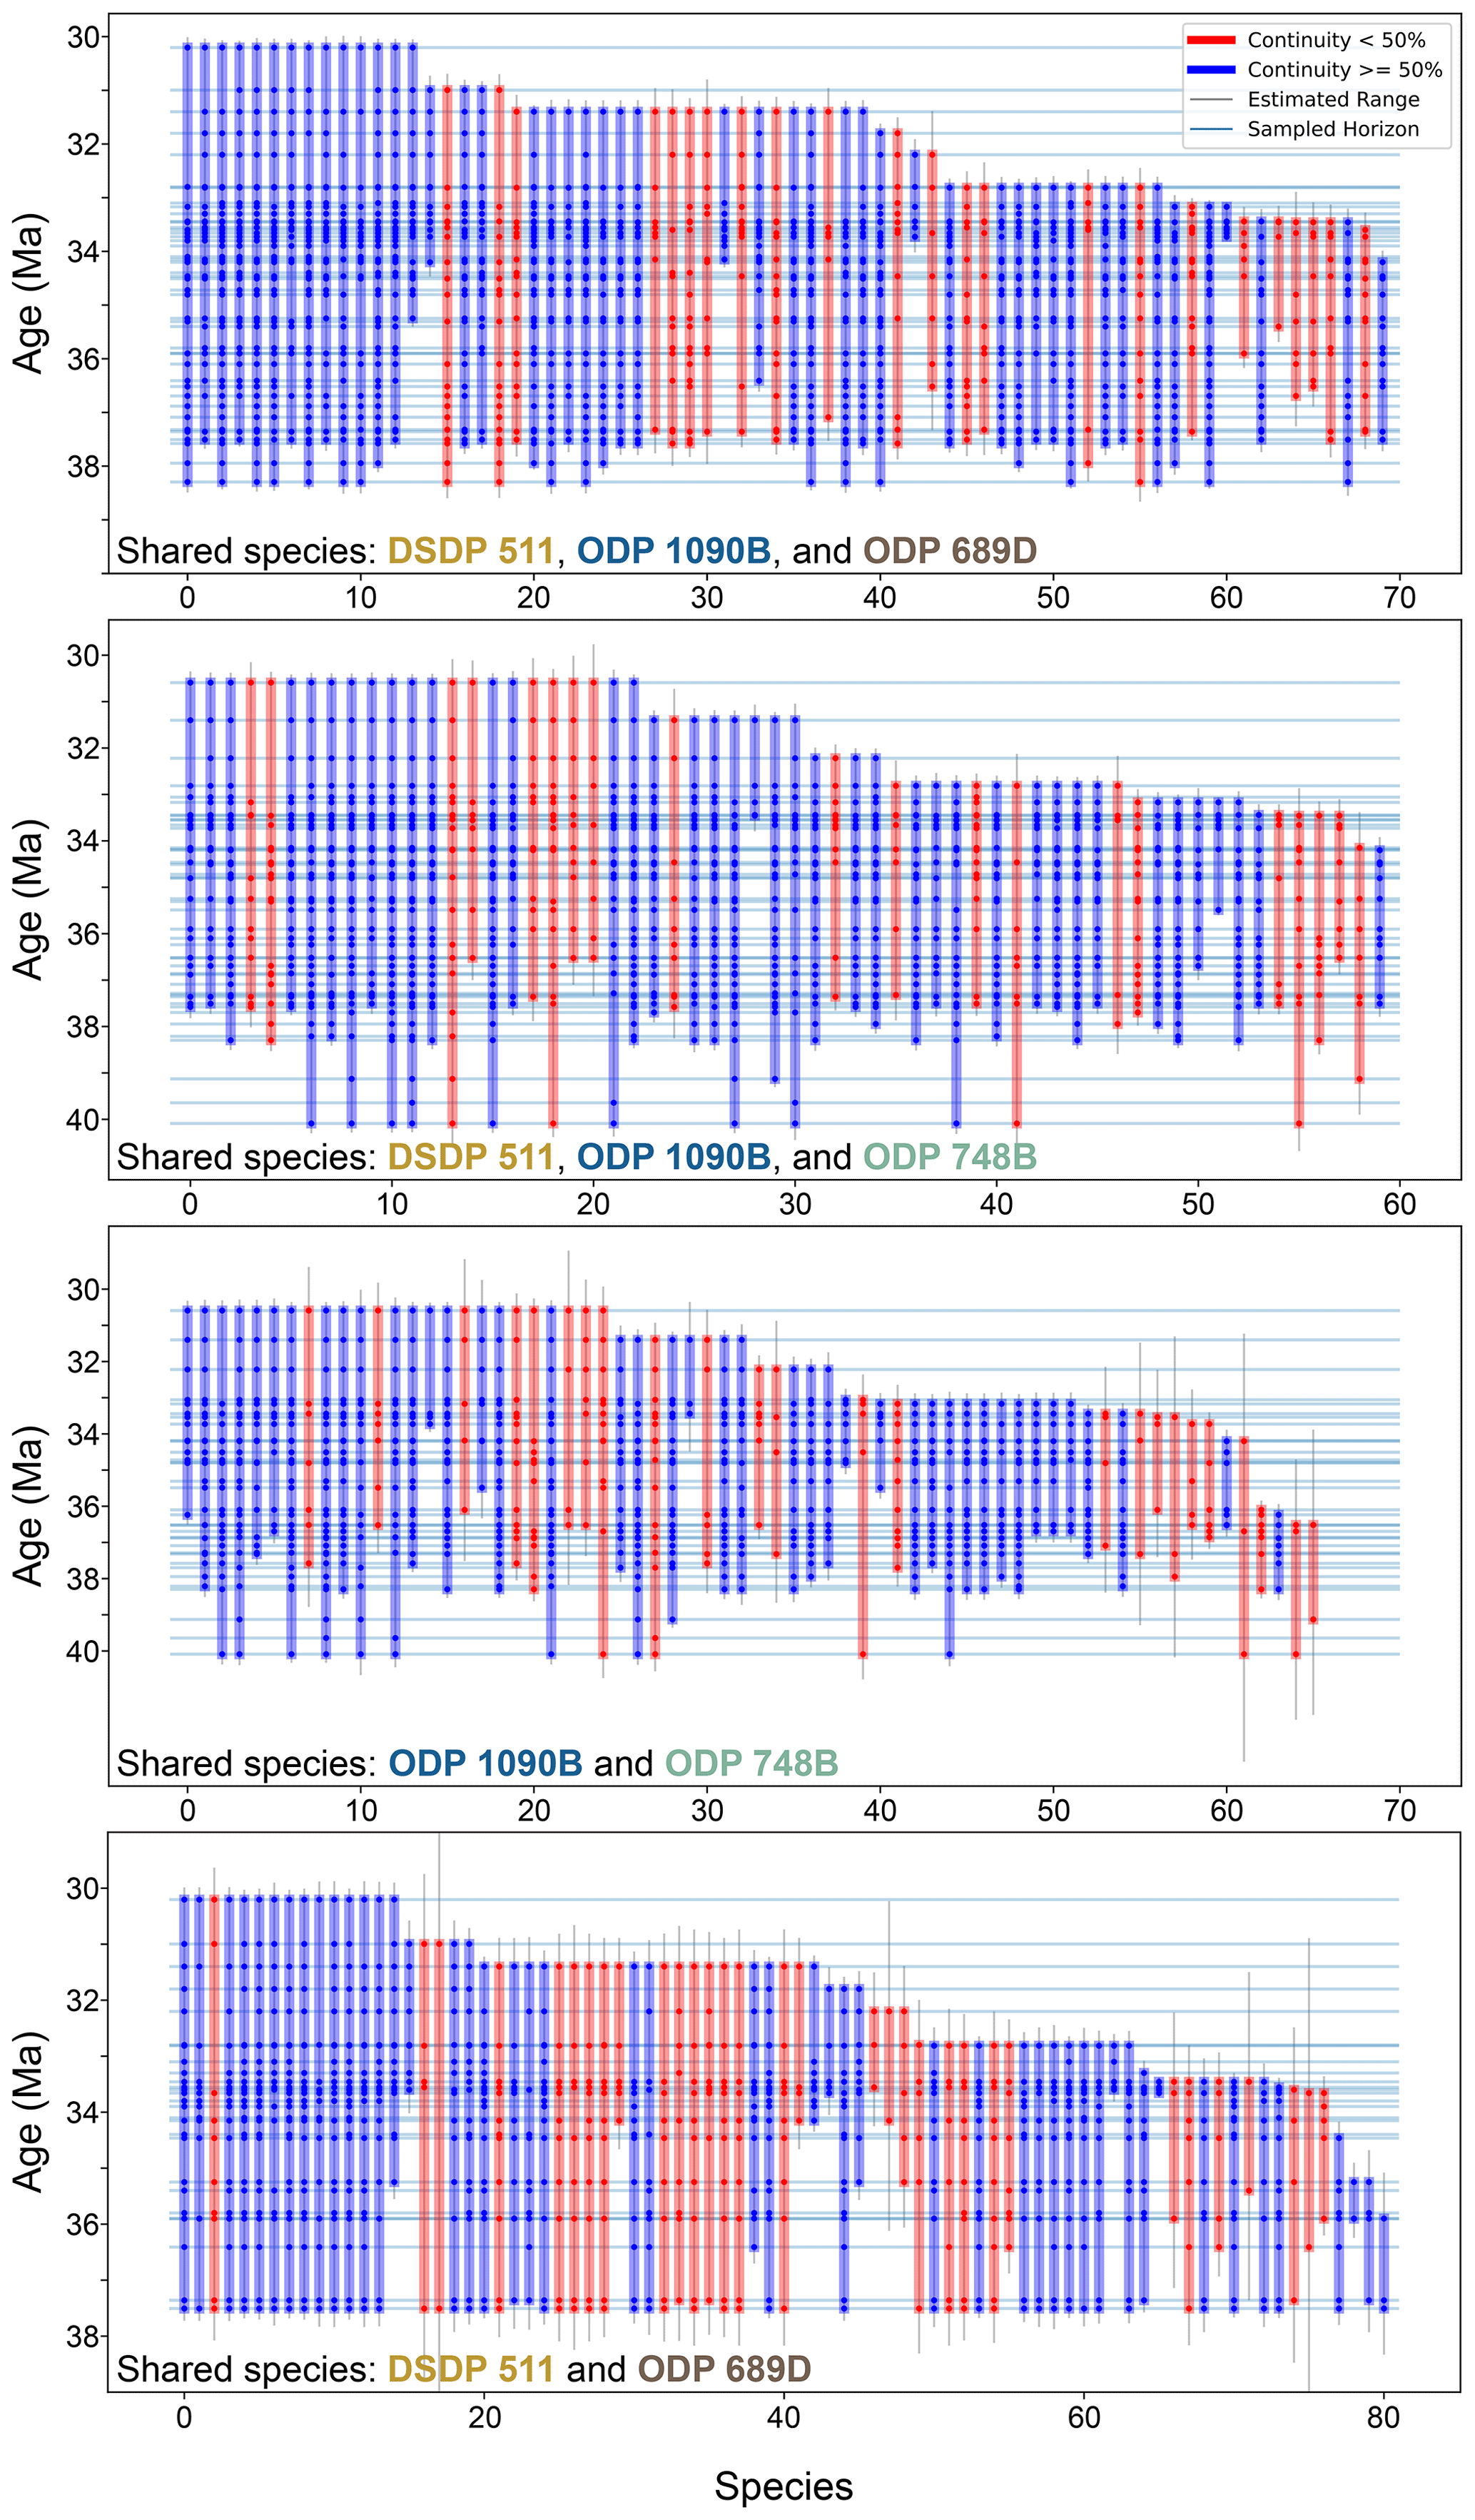
Figure 5Stratigraphic ranges of diatom species shared across study sites. This plot follows the same format and visual convention as Fig. 4 but includes only those species that are observed at more than one site. For an explanation of bar colors, sampling horizons, and continuity calculation, refer to the caption of Fig. 4.
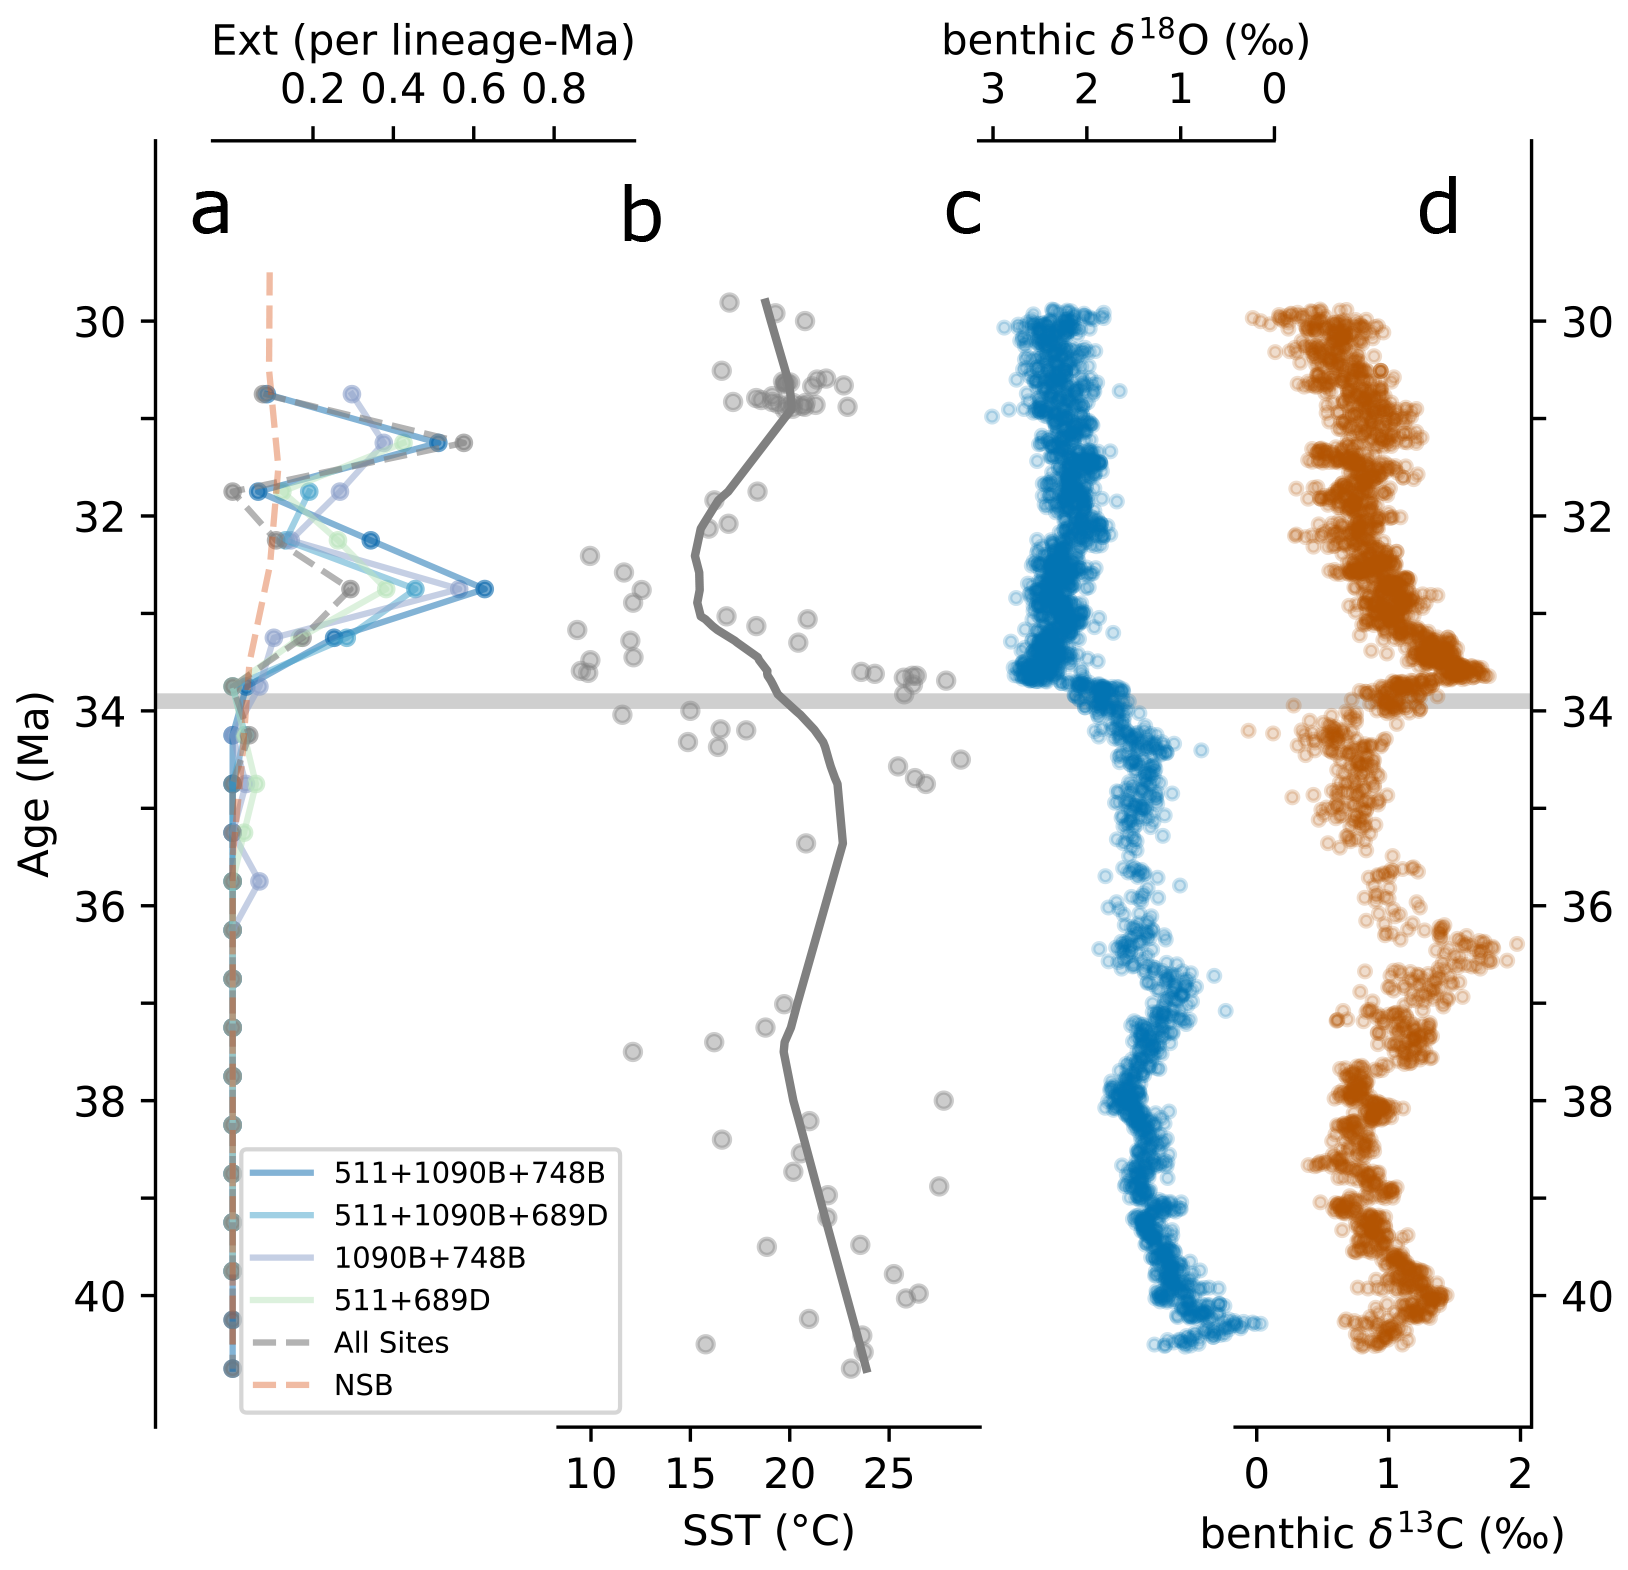
Figure 6(a) Foote boundary-crosser extinction rates and (b) southern high-latitude Sea Surface Temperature (SST) compilation from Auderset et al. (2022), with the trend line generated using the Lowess function from Python's statsmodels module (Seabold and Perktold, 2010). (c) Global composite benthic δ18O and (d) δ13C from Westerhold et al. (2020). The horizontal gray line marks the Eocene–Oligocene (E–O) boundary.
Between ODP sites 1090B and 748B, 14 of the 58 shared species present in the 33–32.5 Ma time bin went extinct by the end of this time bin. Similarly, between DSDP 511 and ODP 689, 12 out of 69 shared species went extinct within the same interval. Subgroup analyses involving combinations of three sites (DSDP 511–ODP 1090–ODP 689 and DSDP 511–ODP 1090–ODP 748; Figs. 5 and 6a) reinforce this finding, consistently identifying the 33–32.5 Ma interval as a robust extinction peak. Extinction rates calculated for younger intervals beyond 32.5 Ma may call for caution due to potential edge effects related to fewer available samples. Overall, there is a consistent extinction event across the SO sites within the 33–32.5 Ma interval, approximately 1 Myr after the E–O.
3.4 Community changes
To identify intervals of community turnover and compositional stability, we calculated Morisita–Horn similarity values for each site (see Sect. 2.3.4 and Supplement S3). This analysis sheds light on the timings of community transitions, including relative abundances and their relation to species diversity patterns (Fig. 7). At DSDP site 511, sample similarities remain above 0.6 throughout most of the studied interval, indicating stable species composition and relative abundances (Fig. 7a). A marked drop in similarity appears around 35 Ma, separating older and younger sample clusters. Following this transition, values remain cyclic but relatively high, and Oligocene samples return to higher self-similarity levels.
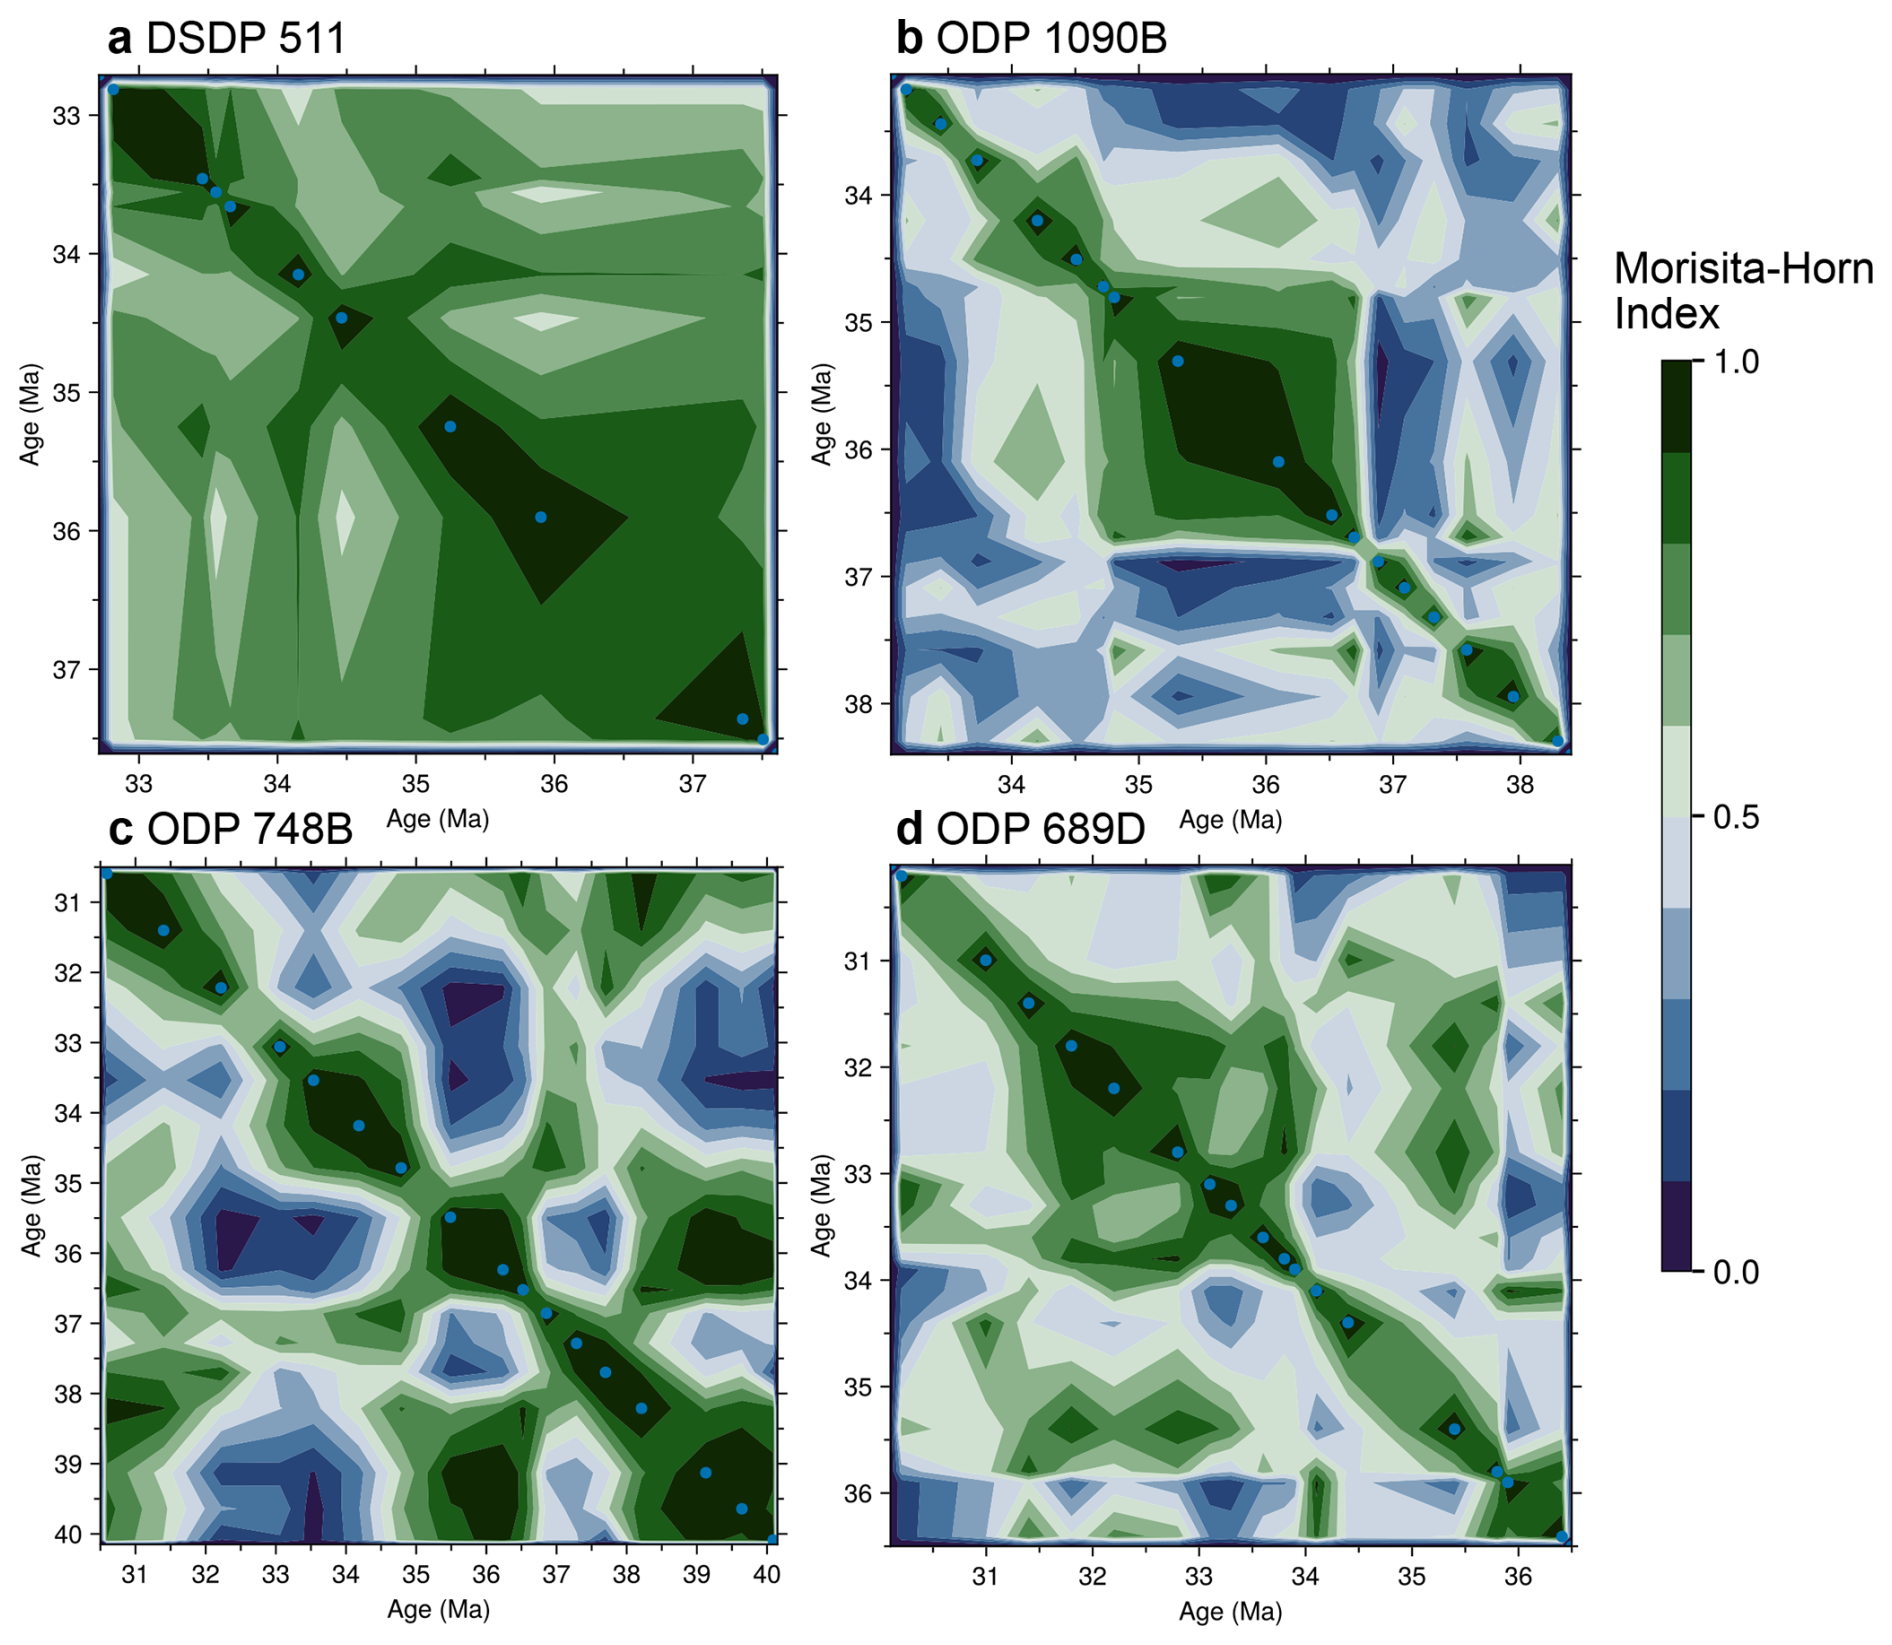
Figure 7Temporal self-similarity of diatom assemblages at four SO sites. Contour plots give pairwise Morisita–Horn similarity values for all sample combinations at each site. In each panel, both axes are sample age (Ma), points on the main diagonal are therefore comparing a sample with itself (similarity = 1) The color code for similarity values ranges from dark-green (high similarity, nearly identical communities) through to dark-blue (low similarity, distinct communities), as indicated by the scale bar common to all panels. Blue dots mark the positions of the analyzed samples, and the surrounding contours are interpolated between these empirical points. Continuous green zones therefore denote intervals of higher similarity, while abrupt color changes highlight rapid compositional shifts; for example, ODP 1090B exhibits a relatively stable interval between about 37 and 34.5 Ma, bounded by sharp transitions. Pairwise Morisita–Horn similarity values for each site are provided in Supplement S3.
At ODP site 1090, changes in community composition occur more sharply (Fig. 7b). The first pulse of species richness around 36.7 Ma marks a sharp transition, with dominance (near 25 %) of the Eocene genus Pyxilla. This genus dominated blooms for an extended period between approximately 36.7 and 34.7 Ma (Fig. 7b, see also Fig. S2 for Pyxilla relative abundance). Similarity values at ODP 1090 reveal higher self-similarity across this interval. At the end of this self-similar unit, another sharp transition in community composition occurs around 34.7 Ma, where similarity values sharply decrease. At ODP 748, similarity values fluctuate without forming coherent clusters. No sustained intervals of community stability are identified (Fig. 7c). In contrast, ODP site 689 shows two sharp transitions, including a pronounced decrease in similarity between 35.9 and 35.8 Ma (Fig. 7d). Both Antarctic sites show cyclic similarity patterns across the studied interval.
4.1 Spatial and temporal trends in Southern Ocean diatom diversity
Our updated record documents approximately 280 diatom species from the SO across the late Eocene–early Oligocene (∼40–30 Ma), significantly exceeding previous estimates. For comparison, the Neptune database (Renaudie et al., 2020, 2023), essentially a compilation of biostratigraphic studies extensively used in plankton evolution studies (e.g., Allen et al., 2006; Liow and Stenseth, 2007; Cermeño and Falkowski, 2009; Lazarus et al., 2014; Rineau et al., 2022), records approximately 50 species (including open nomenclature) for the same interval. The full species richness of SO diatoms from this interval is approximately 6 times higher than previously compiled diversity, with an estimated range most plausibly between 300 and 470, revealing far greater complexity and richness than previously recognized. We acknowledge that species boundaries in some groups remain challenging, and while, our identifications follow consistent light microscopy criteria, future SEM-based revisions may refine or combine some of these morphospecies.
Despite overall high diversity, considerable variation exists among the studied sites. This regional diversity contrasts likely reflect a combination of local settings and paleo-circulation. Each site differs in water depth and distance from the continent – factors that can modulate nutrient supply and preservation. Additionally, the distinct late-Eocene oceanographic regime, characterized by partially open Drake Passage and Tasmanian gateways (e.g., Hodel et al., 2021; Evangelinos et al., 2022, 2024), would have produced strong regional hydrographic contrasts. During this time, the SO circulation likely consisted of large subpolar gyres, such as the Ross and Weddell gyres, recirculating water within individual basins rather than circulating around Antarctica (Sauermilch et al., 2021). In modern SO, ACC, and its fronts, mixes surface-water around Antarctica and thus smooths east–west gradients in temperature, nutrients, and plankton composition (e.g., Freeman et al., 2019). The absence of such a continuous current during the late Eocene would have fostered sharp regional gradients, influencing diatom assemblage compositions. Indeed, dominant species compositions differ significantly among sites (see Fig. S3), indicating local environmental control.
A striking example is provided by the genus Pyxilla. At sub-Antarctic ODP site 1090, Pyxilla dominates, forming nearly one-third of the assemblage (Figs. S2 and S3). In contrast, it is almost absent at Antarctic-proximal sites ODP 689 and 748. At DSDP site 511, genus Pyxilla exhibits high morphological variability (Gombos and Ciesielski, 1983), further underscoring regional differences. Although its ecological preferences and taxonomic limits remain uncertain (e.g., Strelnikova and Vasilyev, 1993), the record of Pyxilla stands out as one of the most distinctive features of the diatom assemblages across the EOT in the Atlantic. In addition to its dominance in the latest Eocene SO (this study; Figs. S2 and S3), similar peaks have been reported from the North Atlantic across the E–O, where Pyxilla dominates the Labrador Sea assemblages (ODP site 647; Bohrmann and Stein, 1989). We refrain from speculating further on the drivers of this “E–O Pyxilla event” here. We note, however, that the morphological variability at DSDP site 511 may point to a link between silicic acid availability and valve morphology, although further work is needed to decipher the signals preserved in this group's remarkable record.
Toward the latest Eocene and early Oligocene, Cestodiscus species increased markedly at all sites, becoming particularly dominant at Antarctic-adjacent sites (Fig. S3). This widespread rise suggests an emerging common ecological response across the SO, even as regional differences in dominant species composition remain prominent. Although Cestodiscus has been associated with surface cooling (e.g., Fenner, 1986), a similar increase in abundance occurs in the equatorial Atlantic (Fenner, 1981, 1986), where sea surface cooling is not evident (Pearson et al., 2007; Liu et al., 2009; Cramwinckel et al., 2018). This suggests that other factors, such as changes in silica supply and/or nutrient stoichiometry (e.g., Goldenberg et al., 2022), may also be at play. Importantly, this coherent rise in Cestodiscus is not mirrored by productivity trends inferred from recent paleoproductivity studies, which highlight divergent trajectories among SO sites during the E–O (Bryłka et al., 2024; Rodrigues De Faria et al., 2024).
Across all studied SO sites, diatom diversity follows a broadly similar sequence: a rise between ∼36.5 and 36 Ma, a decline toward the E–O (∼34–34.5 Ma), and a second rise around the boundary. Comparable shifts are evident in SO productivity and opal accumulation records (Anderson and Delaney, 2005; Diekmann et al., 2004; Diester-Haass and Zahn, 1996; Rodrigues De Faria et al., 2024; Özen, 2025). At ODP site 1090, for example, pulses in opal productivity (Anderson and Delaney, 2005; Diekmann et al., 2004) and biogenic barium (bio-ba) accumulation (Rodrigues De Faria et al., 2024) at ∼37 and ∼34 Ma show close correspondence with our diversity record (see Özen, 2025). Similar timing is evident in radiolarian records from the southwest Pacific, where Pascher et al. (2015) documented prominent increases in abundance and diversity around the middle-to-late-Eocene transition, closely tied to the Priabonian oxygen maximum (PrOM; Scher et al., 2014) event at ∼37 Ma, and again across the E–O. They attributed these shifts to cooling and regional circulation reorganization under evolving climatic and Tasmanian Gateway conditions. Although their study is regionally focused, the temporal alignment with our diatom record suggests a broader SO reorganization. The establishment and episodic intensification of the proto-ACC (Rodrigues De Faria et al., 2024) provides a plausible mechanism linking these parallel signals, with a common response across siliceous plankton despite regional variation in assemblage composition. Thus, diatom diversity during the EOT appears to have been shaped by both local environmental factors and large-scale oceanographic changes (e.g., Houben et al., 2019; Sarkar et al., 2019; Rodrigues De Faria et al., 2024), highlighting the dynamic interplay between regional conditions and SO-wide processes.
While spatial patterns in assemblage composition provide ecological context, interpreting diversity trends across the EOT also requires careful consideration of opal preservation. Water depth is often considered a key factor in biogenic opal preservation, as biogenic silica remains exposed to the silica-undersaturated water column. Despite this, DSDP 511 and ODP 1090, which record significantly greater paleo-water depths relative to the shallower ODP sites 689 and 748 (Fig. 1), show better diatom preservation, particularly in the late Eocene (Fig. S1). This inverse relationship between diatom preservation and paleodepth points to the sedimentation rate as the more influential factor in biogenic opal preservation in these sites during the EOT, rather than water depth alone. The variability in diatom preservation across the studied sites, influenced by differing oceanographic conditions, reflects the inherent dynamics of diatom preservation, where physical oceanographic factors are critical (e.g., Ragueneau et al., 2000; Warnock and Scherer, 2016). Diatom productivity and community abundance also play significant roles, as communities must reach a threshold density to form aggregates, initiating effective sequestration (Kiørboe, 1993; Jackson, 2001).
4.2 Changes in community compositions and its implications across the Eocene–Oligocene transition
Patterns of community similarity reveal a gradient in ecological stability across the SO during the EOT (Fig. 7). The sub-Antarctic DSDP site 511 shows a persistently stable community structure; ODP site 1090 records an intermediate regime marked by phases of stability, punctuated by community reorganizations; and the Antarctic-proximal ODP sites 689 and 748 display the highest temporal variability. These site-to-site contrasts likely reflect the combined influence of changing SO circulation dynamics (e.g., Diester-Haass and Zahn, 1996; Houben et al., 2019; Sarkar et al., 2019; Sauermilch et al., 2021), evolving water mass structure (e.g., Langton et al., 2016; Wright et al., 2018), nutrient regimes influenced by upwelling intensity (Diester-Haass and Zahn, 1996; Diekmann et al., 2004; Bryłka et al., 2024; Rodrigues De Faria et al., 2024), and surface ocean and water column temperature changes (Liu et al., 2009; Bohaty et al., 2012; Douglas et al., 2014; Tibbett et al., 2023) during the EOT. Taken together, these factors appear to have shaped a gradient from relatively stable sub-Antarctic environments to more variable Antarctic-proximal conditions.
At DSDP 511, similarity values remain high throughout the late Eocene and earliest Oligocene, indicating persistent community stability under consistent sub-Antarctic conditions. This stability, supported by uniform evenness and good preservation (Figs. S1 and S4), likely reflects a steady nutrient regime, consistent with mesocosm experiments showing that high Si upwelling systems promote greater evenness in diatom communities (Goldenberg et al., 2022). These conditions probably sustained the highest diatom diversity among all studied sites (Fig. 2a; see Sect. 3.1), suggesting that a relatively constant nutrient supply maintained a high ecological carrying capacity and enabled the long-term coexistence of diverse taxa. This pattern is further consistent with recent work (Hatton et al., 2024) demonstrating that higher diversity can enhance community stability.
ODP site 1090 occupies an intermediate position between the stable sub-Antarctic assemblages at DSDP 511 and the more variable Antarctic sites. Between ∼36.8 and ∼34.5, community similarity values remain high (Fig. 7), indicating relative stability, and diversity likewise shows little variation across this interval (Fig. 2a). However, sharp compositional shifts occur near these times, coinciding with peaks in biogenic opal and bio-ba accumulation (Diekmann et al., 2004; Rodrigues De Faria et al., 2024; Özen, 2025). These productivity pulses have been interpreted as episodes of intensified proto-ACC and enhanced nutrient upwelling as SO gateways deepened (e.g., Rodrigues De Faria et al., 2024). Numerical simulations further suggest that the proto-ACC initiated by the Drake Passage deepening directly influenced the ODP site 1090 region (Toumoulin et al., 2020), consistent with proxy-based evidence for increasing productivity at this site. Furthermore, the timing of the ∼38 Ma onset of diatom dominance at this site (see Fig. 2a, ODP 1090) closely matches independent geochemical evidence for the initial strengthening of the proto-ACC (Borrelli, et al., 2014). Community similarity shifts at ODP 1090 therefore likely record ecological responses to these circulation reorganizations, characterized by sharp phase transitions without a major loss of diversity. The developing current system appears to have increased nutrient delivery and productivity while intermittently disturbing community structure. In this sense, ODP site 1090 likely preserves the biological imprint of evolving SO circulation, recording the ecological counterpart of the opal and bio-ba pulses that mark late-Eocene productivity events.
Community dynamics at ODP 1090 provide additional context for interpreting the silicon isotope record at this site. A key empirical evidence for the hypothesis that diatoms contributed to EOT cooling through enhanced productivity and carbon sequestration (Salamy and Zachos, 1999; Scher and Martin, 2006; Rabosky and Sorhannus, 2009) is the shifts in diatom-based silicon isotope values at ODP 1090 (Egan et al., 2013). These shifts have been interpreted as increased silicic acid utilization, suggesting greater diatom-driven export production and, by extension, intensified CO2 drawdown (Egan et al., 2013). However, caution is needed because silicon isotope values can be highly species specific, with up to 70 % of the variance attributable to community composition (Sutton et al., 2013). The temporal correspondence between shifts in isotopic values and community reorganizations (Fig. 8) suggests that part of the δ30Si signal may reflect ecological turnover rather than a uniform rise in nutrient utilization. Our results at ODP 1090 therefore provide essential context for interpreting the silicon isotope proxy across the EOT.
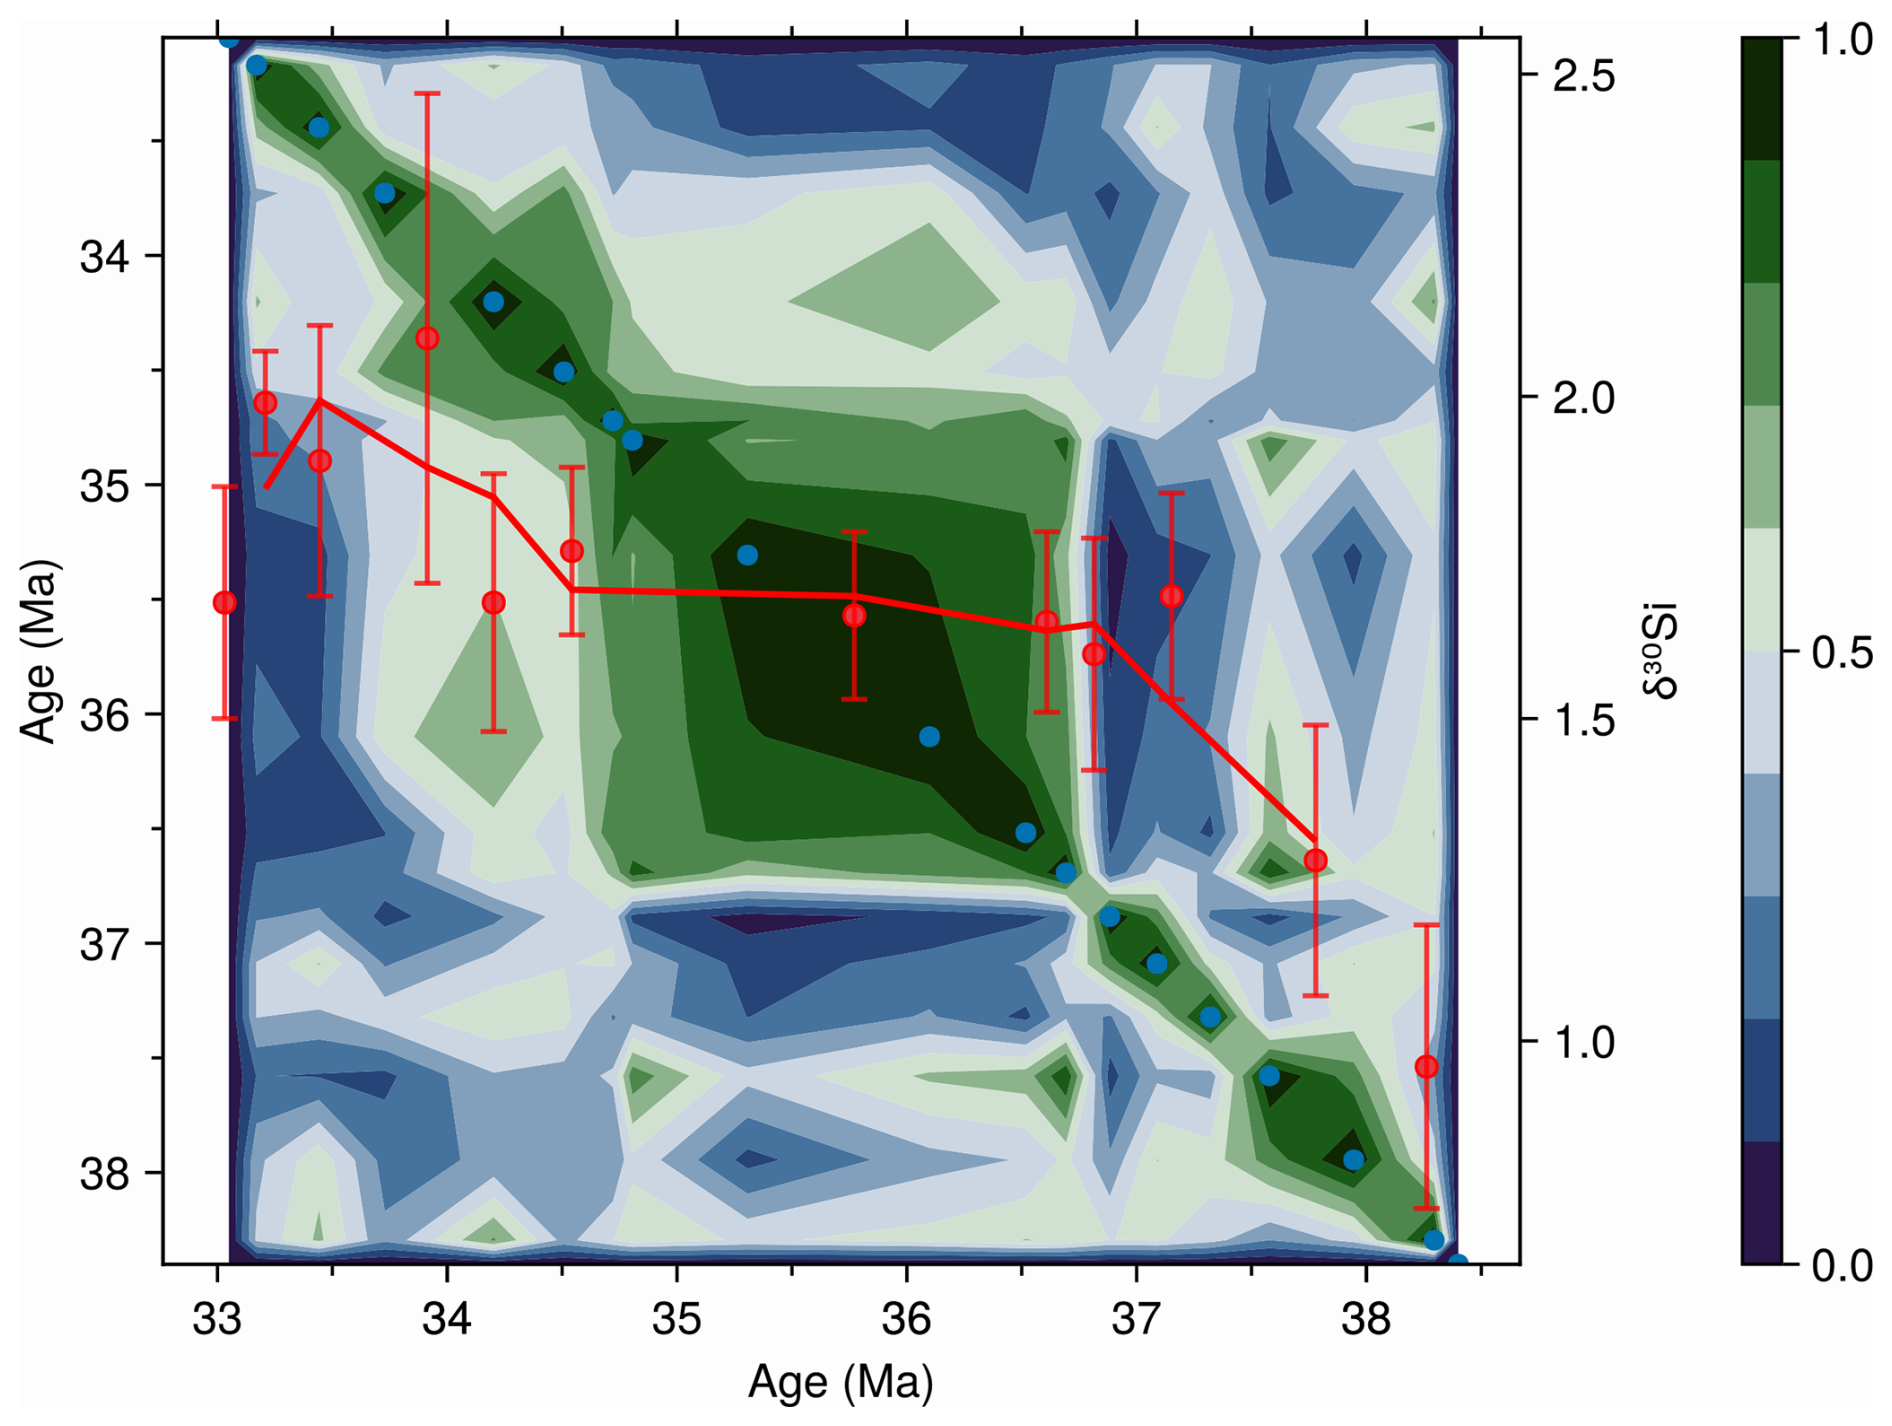
Figure 8Morisita–Horn community similarity contour plot for ODP site 1090 with diatom-based silicon isotope values (δ30Si; Egan et al., 2013) overlaid. See Fig. 7 for guidance on reading the similarity contour and scale bar (right; 1 = identical community composition, 0 = no similarity). Red points show individual δ30Si measurements with 2 SD error bars, and the solid red line represents a three-point running average trend. Note how the δ30Si trend curve bends through intervals changing community composition, like light refracting through media of differing densities. Both the δ30Si record and the diatom assemblage data underlying the similarity contours are based on the >10 µm diatom size fraction.
Antarctic-proximal ODP sites 689D and 748B exhibit much broader variability in community similarity than the sub-Antarctic sites (Figs. 7c, d and S4). Part of this variation reflects taphonomy, as horizons with few specimens show lower similarity to other levels, inflating apparent turnover. However, substantial fluctuations also occur among well-preserved, high-count samples, demonstrating that the observed variability is not solely a taphonomic artifact, but instead reflects community response. Although overall diversity patterns remain comparable among sites (see Sect. 4.1), the much stronger community variability in these Antarctic-proximal regions suggests that local forcing, rather than basin-scale SO circulation dynamics, may have dominated diatom community dynamics. Sedimentological evidence from these regions indeed indicates a growing influence of Antarctic cryospheric activity during the late Eocene and early Oligocene (Ehrmann and Mackensen, 1992). The suspected ephemeral East Antarctic glaciation and related continental discharge during the PrOM event (∼37 Ma; Scher et al., 2014) has been linked to changing productivity across the Kerguelen Plateau region (Rodrigues De Faria et al., 2024; Özen, 2025). Across the E–O, in the same region, the Nd isotope record interpreted as a glacial discharge signal (Scher et al., 2011) aligns closely with the opal productivity in the region (Özen, 2025). Together, the balance of evidence suggests a close coupling between Antarctic climatic dynamics and biotic responses at Maud Rise and the Kerguelen Plateau. We therefore speculate that high community similarity fluctuations at these regions reflect the influence of continental cryospheric processes across the EOT, which episodically altered water column stratification (via freshening) and nutrient delivery (e.g., Scher et al., 2011). These perturbations could have opened and closed transient ecological windows favoring different community compositions. Our results do not allow detailed mechanistic interpretations but suggest that local Antarctic forcing may have strongly influenced community dynamics in these regions.
In the Antarctic-proximal regions, the overall diatom diversity changes little across the E–O, despite large shifts in community composition. At site 748B, diversity remains nearly constant, with early Oligocene values closely matching those of the late Eocene, while at site 689D diversity fluctuates in the early Oligocene but overall remains comparable to Eocene levels. These stable patterns contrast with the opal accumulation records from both sites, which show a pronounced rise at the E–O, reaching levels similar to those at the sub-Antarctic sites (e.g., Bryłka et al., 2024; Özen, 2025). Yet this increase in opal deposition is not accompanied by a comparable rise in diatom diversity, suggesting a decoupling between species richness and opal accumulation rates in these Antarctic-proximal sites. The mechanisms behind this divergence are explored in detail in Özen. (2025), and here we emphasize only that the diversity record at 689D and 748B captures a distinct evolutionary signal that cannot be reduced to accumulation trends alone.
4.3 Diatom extinction in the early Oligocene
Despite the variations observed across the studied sites, there is a unifying event within the time bin 33–32.5 Ma, where all subsets of the shared species show a persistent extinction event (Fig. 6a). This event is particularly robust against the edge effect, a common challenge in the fossil record where the true last occurrences of species may be obscured by sampling limitations. In our case, the subsequent five time bins of nearly two dozen samples following the 33–32.5 Ma interval, and the use of only geographically widespread species, provide a solid control. The continued absence of these species over a 2.5 Myr span, until ∼30 Ma, reinforces the conclusion that the 33–32.5 Ma interval marks an extinction event. Although extinction rates remain high in our records following the E–O, the values after the 33–32.5 Ma bin may be affected by edge effect. We therefore treat these post-33–32.5 Ma values with caution and exclude them from further analyses and interpretations.
Diatom extinction rates remain low across the E–O itself (Fig. 6a), consistent with limited sea surface cooling in regions such as the Falkland Plateau and Maud Rise (∼1 °C; Tibbett et al., 2023), and with southern high-latitude SST compilations showing relative stability across the boundary (Fig. 6b; Auderset et al., 2022). Extinction rates begin to rise within the 33.5–33 Ma range and peak between 33 and 32.5 Ma, coinciding with the lowest SSTs of the interval and a ∼6 °C decline from late-Eocene values ( °C to ∼15 °C, see Fig. 6b). A comparable threshold appears in radiolarians, where major turnover follows temperature changes of a similar magnitude (e.g., a ∼6 °C threshold is observed by Trubovitz et al., 2020). The close pacing of these patterns suggests that diatoms crossed an environmental threshold. However, we caution attributing this loss solely to the direct effects of SST, as it is likely that SST change paralleled a complex reorganization of the SO surface water environment and ecosystem.
By the early Oligocene, the SO was continuing to evolve. The deepening of the SO gateways likely initiated a proto-ACC, reshaping circulation, upwelling, and nutrient distribution (e.g., Diester-Haass and Zahn, 1996; Scher and Martin, 2006; Sarkar et al., 2019; Rodrigues De Faria et al., 2024; Özen, 2025). While the details remain debated, these circulation changes probably contributed to Antarctic cooling and eventually the establishment of a permanent ice sheet. In this evolving system, separating cause and effect is difficult. Our results suggest that the first major expansion of the East Antarctic ice sheet, recorded in global isotope compilations, coincides with the onset of elevated extinction rates (Fig. 6a–c), hinting at a link between Antarctic glaciation and SO plankton restructuring. The development of a stronger circumpolar flow and intensified latitudinal temperature gradients (e.g., Hoem et al., 2022) would have promoted seasonal sea ice formation. Houben et al. (2013) proposed that this sea ice development played a central role in reorganizing plankton communities, although its precise ecological pathway remains uncertain. Acting in concert with progressive sea surface cooling, these shifts likely fragmented habitats along north–south transects, reducing connectivity and compressing ecological ranges, thereby increasing the vulnerability of many species (e.g., Maurer and Nott, 1998). Because extinction rates are derived from species shared across multiple sites (see Sect. 2.4.4), the true disruption was probably greater than recorded, as widespread taxa generally resist extinction (e.g., McKinney, 1997). These patterns reinforce the broader view, consistent with Crampton et al. (2016), that SO diatom communities were resilient to short-term variability but vulnerable to large-scale shifts in mean climate state. Although the precise sequence of drivers cannot yet be resolved, the balance of evidence suggests that diatoms reached an ecological threshold in the early Oligocene, under increasing thermal stress, seasonality, and habitat divergence in the SO.
The mechanisms discussed above also help to explain why elevated extinction coincided with increased opal accumulation. An extinction pattern comparable to ours might also be expected if SO productivity had collapsed during the earliest Oligocene. However, evidence from Antarctic-proximal sites, which provide the majority of our Oligocene samples, shows the opposite (e.g., Salamy and Zachos, 1999; Bryłka et al., 2024; Rodrigues De Faria et al., 2024; Özen, 2025). The persistence of high productivity alongside elevated extinction implies that nutrient supply remained strong but that plankton communities underwent structural change. Comparable trends in calcareous nannoplankton across the E–O, where eutrophic assemblages expanded while species diversity declined (Persico and Villa, 2004; Villa et al., 2014), point to nutrient-rich yet ecologically stressed surface waters. The growing prominence of diatoms may itself have contributed to this restructuring by altering nutrient utilization and competitive balance among primary producers (e.g., Hendry et al., 2018). Together, these lines of evidence indicate that the 33–32.5 Ma extinction event marked a reorganization of SO ecosystems that remained productive yet had become increasingly fragile as cooling, stronger seasonality, and changing circulation patterns transformed the balance among plankton groups.
Our study presents a comprehensive analysis of diatom diversity and community evolution across the Atlantic and Indian ocean sectors of the SO during the late Eocene to early Oligocene interval. Using newly generated species-level diversity data, we explore the previously undocumented diversity of SO diatoms, offering new insights into late-Paleogene diatom ecosystems. Despite representing distinct oceanographic settings and depositional characteristics, all studied sites exhibit a shared pattern in diatom community composition shifts, with notable intervals around 37–36 and 34 Ma, suggesting the influence of large-scale environmental changes affecting siliceous plankton. Across the SO, a unifying rise and fall in diatom diversity is evident through the late Eocene and early Oligocene. Yet, site-to-site differences in community composition and diversity reflect the interplay between global shifts (such as sea surface temperature and ocean circulation) and regional factors (including upwelling intensity, nutrient supply, and preservation conditions). These findings remind us that even global patterns in Earth's history are woven from finely tuned regional dynamics and ecological responses in communities across the SO.
The data reveal a significant extinction event among SO diatom communities approximately 1 Myr after the E–O. This event coincides with the lowest SSTs recorded in the southern high-latitude compilations during the EOT, marked by a cooling of ∼6 °C compared to the preceding late-Eocene average. A shift of similar magnitude has been linked to extinction response in Neogene radiolarian communities (Trubovitz et al., 2020), suggesting a broadly applicable thermal threshold for marine plankton. While diatoms initially persisted through the relatively stable conditions at the E–O, this subsequent cooling appears to have suppressed the thermal tolerance of even widespread and previously resilient taxa. The absence of a notable decline in opal productivity during the earliest Oligocene further supports the interpretation that thermal stress, rather than nutrient limitation or preservational bias, was the primary driver of extinction. Our findings thus highlight the critical role of changing SSTs in shaping plankton fitness, showing that boundary conditions for biodiversity are intimately tied to the physical constraints of the climate system.
All raw data are provided in the supplements to this paper, and the associated taxonomic appendix is publicly available via Zenodo (https://doi.org/10.5281/zenodo.14608178; Özen et al., 2025). The functions used for all analyses are publicly available via Zenodo (https://doi.org/10.5281/zenodo.14605790; Özen, 2025) as well as on GitHub (https://github.com/oezenvolkan/Oezenetal2025).
The supplement related to this article is available online at https://doi.org/10.5194/jm-45-177-2026-supplement.
VÖ collected and analyzed the diversity data, and drafted the paper. All authors contributed to revising and editing the paper.
The contact author has declared that none of the authors has any competing interests.
Publisher's note: Copernicus Publications remains neutral with regard to jurisdictional claims made in the text, published maps, institutional affiliations, or any other geographical representation in this paper. The authors bear the ultimate responsibility for providing appropriate place names. Views expressed in the text are those of the authors and do not necessarily reflect the views of the publisher.
We thank Sylvia Dietze (MfN Berlin) for her assistance with sample preparation and Jakub Witkowski (University of Szczecin) for his valuable insights and support with diatom taxonomy. We also thank the journal editor, Francesca Sangiorgi, and the handling editor, Christina Riesselman. We are also grateful to the reviewers, Jason Coenen, and an anonymous reviewer for their constructive feedback, which significantly improved the final paper.
This research has been supported by the Bundesministerium für Forschung, Technologie und Raumfahrt (grant no. 57429681).
The article processing charges for this open-access publication were covered by the Freie Universität Berlin.
This paper was edited by Christina Riesselman and reviewed by Jason Coenen and one anonymous referee.
Allen, A. P., Gillooly, J. F., Savage, V. M., and Brown, J. H.: Kinetic effects of temperature on rates of genetic divergence and speciation, P. Natl. Acad. Sci. USA, 103, 9130–9135, https://doi.org/10.1073/pnas.0603587103, 2006.
Alroy, J.: Geographical, environmental and intrinsic biotic controls on Phanerozoic marine diversification: Controls on phanerozoic marine diversification, Palaeontology, 53, 1211–1235, https://doi.org/10.1111/j.1475-4983.2010.01011.x, 2010.
Anderson, L. D. and Delaney, M. L.: Middle Eocene to early Oligocene paleoceanography from Agulhas Ridge, Southern Ocean (Ocean Drilling Program Leg 177, Site 1090), Paleoceanography, 20, 2004PA001043, https://doi.org/10.1029/2004PA001043, 2005.
Auderset, A., Moretti, S., Taphorn, B., Ebner, P.-R., Kast, E., Wang, X. T., Schiebel, R., Sigman, D. M., Haug, G. H., and Martínez-García, A.: Enhanced ocean oxygenation during Cenozoic warm periods, Nature, 609, 77–82, https://doi.org/10.1038/s41586-022-05017-0, 2022.
Bach, L. T. and Taucher, J.: CO2 effects on diatoms: a synthesis of more than a decade of ocean acidification experiments with natural communities, Ocean Sci., 15, 1159–1175, https://doi.org/10.5194/os-15-1159-2019, 2019.
Barron, J., Bukry, D., and Gersonde, R.: Diatom and silicoflagellate biostratigraphy for the late Eocene: ODP 1090 (sub-Antarctic Atlantic), in: Diatom research over time and space Morphology, taxonomy, ecology and distribution of diatoms – from fossil to recent, marine to freshwater, established species and genera to new ones, Nova Hedwigia, Beihefte, ISSN 0078-2238; 143, editecd by: Kociolek, J., Kulikovskiy, M., Witkowski, J., and Harwood, D., Cramer in der Gebr. Borntraeger Verlagsbuchhandlung, Stuttgart, Germany, p. 518, ISBN 978-3-443-51065-7, 2014.
Barron, J., Stickley, C. E., and Bukry, D.: Paleoceanographic, and paleoclimatic constraints on the global Eocene diatom and silicoflagellate record, Palaeogeogr. Palaeoclim. Palaeoecol., 422, 85–100, https://doi.org/10.1016/j.palaeo.2015.01.015, 2015.
Basov, I. A. and Krasheninikov, V. A.: Benthic foraminifers in Mesozoic and Cenozoic sediments of the Southwestern Atlantic as an indicator of paleoenvironment, Deep Sea Drilling Project Leg 71., in: Init. Repts. DSDP, vol. 71, edited by: Ludwig, W. J., Krasheninnikov, V. A., Basov, I. A., Bayer, U., Bloemendal, J., Bronhold, B., Cieselski, P. F., Goldstein, E. H., Robert, C., Sallowy, J., Usher, J. L., von der Dick, H., Wever, F. M., and Wise Jr., S. W., US Govt. Printing Office, Washington, 739–787, https://doi.org/10.2973/dsdp.proc.71.128.1983, 1983.
Behrenfeld, M. J., Halsey, K. H., Boss, E., Karp Boss, L., Milligan, A. J., and Peers, G.: Thoughts on the evolution and ecological niche of diatoms, Ecol. Monogr., 91, e01457, https://doi.org/10.1002/ecm.1457, 2021.
Bezanson, J., Karpinski, S., Shah, V. B., and Edelman, A.: Julia: A fast dynamic language for technical computing, arXiv [preprint], arXiv:1209.5145, https://doi.org/10.48550/arXiv.1209.5145, 2012.
Bohaty, S. M., Zachos, J. C., and Delaney, M. L.: Foraminiferal Mg/Ca evidence for Southern Ocean cooling across the Eocene–Oligocene transition, Earth Planet. Sc. Lett., 317, 251–261, https://doi.org/10.1016/j.epsl.2011.11.037, 2012.
Bohrmann, G. and Stein, R.: Biogenic Silica at ODP Site 647 in the Southern Labrador Sea: Occurrence, Diagenesis, and Paleoceanographic Implications, Proceedings of the Ocean Drilling Program, 105 Scientific Results, edited by: Srivasava, S. P., Arthur, M. A., Clement, B., Aksu, A., Baldauf, J., Bohrmann, G., Busch, W., Cederberg, T., Cremer, M., Dadey, K., de Vermal, A., Firth, J., Hal, F., Head, M., Hiscott, R., Jarrard, R., Kaminski, M., Lazarus, D., Monjanel, A.-L., Nielsen, O. B., Stein, R., Thiebaut, F., Zachos, J., and Zimmerman, H., Ocean Drilling Program, https://doi.org/10.2973/odp.proc.sr.105.1989, 1989.
Bryłka, K., Witkowski, J., and Bohaty, S. M.: Biogenic silica accumulation and diatom assemblage variations through the Eocene–Oligocene Transition: A Southern Indian Ocean versus South Atlantic perspective, Palaeogeogr. Palaeoclim. Palaeoecol., 636, 111971, https://doi.org/10.1016/j.palaeo.2023.111971, 2024.
Cermeño, P. and Falkowski, P. G.: Controls on Diatom Biogeography in the Ocean, Science, 325, 1539–1541, https://doi.org/10.1126/science.1174159, 2009.
Chao, A.: Nonparametric estimation of the number of classes in a population, Scand. J. Stat., 11, 265–270, 1984.
Crampton, J. S., Cody, R. D., Levy, R., Harwood, D., McKay, R., and Naish, T. R.: Southern Ocean phytoplankton turnover in response to stepwise Antarctic cooling over the past 15 million years, P. Natl. Acad. Sci. USA, 113, 6868–6873, https://doi.org/10.1073/pnas.1600318113, 2016.
Cramwinckel, M. J., Huber, M., Kocken, I. J., Agnini, C., Bijl, P. K., Bohaty, S. M., Frieling, J., Goldner, A., Hilgen, F. J., Kip, E. L., Peterse, F., Van Der Ploeg, R., Röhl, U., Schouten, S., and Sluijs, A.: Synchronous tropical and polar temperature evolution in the Eocene, Nature, 559, 382–386, https://doi.org/10.1038/s41586-018-0272-2, 2018.
DeConto, R. M. and Pollard, D.: Rapid Cenozoic glaciation of Antarctica induced by declining atmospheric CO2, Nature, 421, 245–249, https://doi.org/10.1038/nature01290, 2003.
Diekmann, B., Kuhn, G., Gersonde, R., and Mackensen, A.: Middle Eocene to early Miocene environmental changes in the sub-Antarctic Southern Ocean: evidence from biogenic and terrigenous depositional patterns at ODP Site 1090, Global Planet. Change, 40, 295–313, https://doi.org/10.1016/j.gloplacha.2003.09.001, 2004.
Diester-Haass, L. and Zahn, R.: Eocene–Oligocene transition in the Southern Ocean: History of water mass circulation and biological productivity, Geology, 24, 163, https://doi.org/10.1130/0091-7613(1996)024<0163:EOTITS>2.3.CO;2, 1996.
Douglas, P. M., Affek, H. P., Ivany, L. C., Houben, A. J., Sijp, W. P., Sluijs, A., Schouten, S., and Pagani, M.: Pronounced zonal heterogeneity in Eocene southern high-latitude sea surface temperatures, P. Natl. Acad. Sci. USA, 111, 6582–6587, https://doi.org/10.1073/pnas.1321441111, 2014.
Egan, K. E., Rickaby, R. E. M., Hendry, K. R., and Halliday, A. N.: Opening the gateways for diatoms primes Earth for Antarctic glaciation, Earth Planet. Sc. Lett., 375, 34–43, https://doi.org/10.1016/j.epsl.2013.04.030, 2013.
Ehrmann, W. U. and Mackensen, A.: Sedimentological evidence for the formation of an East Antarctic ice sheet in Eocene/Oligocene time, Palaeogeogr. Palaeoclim. Palaeoecol., 93, 85–112, https://doi.org/10.1016/0031-0182(92)90185-8, 1992.
Evangelinos, D., Escutia, C., Van De Flierdt, T., Valero, L., Flores, J.-A., Harwood, D. M., Hoem, F. S., Bijl, P., Etourneau, J., Kreissig, K., Nilsson-Kerr, K., Holder, L., López-Quirós, A., and Salabarnada, A.: Absence of a strong, deep-reaching Antarctic Circumpolar Current zonal flow across the Tasmanian gateway during the Oligocene to early Miocene, Global Planet. Change, 208, 103718, https://doi.org/10.1016/j.gloplacha.2021.103718, 2022.
Evangelinos, D., Etourneau, J., Van De Flierdt, T., Crosta, X., Jeandel, C., Flores, J.-A., Harwood, D. M., Valero, L., Ducassou, E., Sauermilch, I., Klocker, A., Cacho, I., Pena, L. D., Kreissig, K., Benoit, M., Belhadj, M., Paredes, E., Garcia-Solsona, E., López-Quirós, A., Salabarnada, A., and Escutia, C.: Late Miocene onset of the modern Antarctic Circumpolar Current, Nat. Geosci., 17, 165–170, https://doi.org/10.1038/s41561-023-01356-3, 2024.
Falkowski, P. G., Barber, R. T., and Smetacek, V.: Biogeochemical Controls and Feedbacks on Ocean Primary Production, Science, 281, 200–206, https://doi.org/10.1126/science.281.5374.200, 1998.
Fenner, J.: Diatoms in the Eocene and Oligocene sediments off NW-Africa: their stratigraphic and paleogeographic occurrences, Diss., Christian-Albrechts-Universität zu Kiel, Kiel, 1981.
Fenner, J.: Information from Diatom Analysis Concerning the Eocene–Oligocene Boundary, in: Developments in Palaeontology and Stratigraphy, Elsevier, 283–287, https://doi.org/10.1016/s0920-5446(08)70131-6, 1986.
Foote, M.: Origination and extinction components of taxonomic diversity: General problems, Paleobiology, 26, 74–102, https://doi.org/10.1017/S0094837300026890, 2000.
Freeman, N. M., Munro, D. R., Sprintall, J., Mazloff, M. R., Purkey, S., Rosso, I., DeRanek, C. A., and Sweeney, C.: The Observed Seasonal Cycle of Macronutrients in Drake Passage: Relationship to Fronts and Utility as a Model Metric, J. Geophys. Res.-Oceans, 124, 4763–4783, https://doi.org/10.1029/2019JC015052, 2019.
Goldenberg, S. U., Taucher, J., Fernández-Méndez, M., Ludwig, A., Arístegui, J., Baumann, M., Ortiz, J., Stuhr, A., and Riebesell, U.: Nutrient composition (Si:N) as driver of plankton communities during artificial upwelling, Front. Mar. Sci., 9, https://doi.org/10.3389/fmars.2022.1015188, 2022.
Gombos Jr. A. M. and Ciesielski, P. F.: Late Eocene to early Miocene diatoms from the Southwest Atlantic, in: Initial Reports of the Deep Sea Drilling Project, US Government Printing Office, Washington, D.C., 583–634, https://doi.org/10.2973/dsdp.proc.71.124.1983, 1983.
Gradstein, F. M., Ogg, J. G., Schmitz, M. D., and Ogg, G. M.: The geologic time scale 2012, in: 1st Edn., Elsevier, Amsterdam, ISBN 978-0-444-59425-9, 2012.
Hatton, I. A., Mazzarisi, O., Altieri, A., and Smerlak, M.: Diversity begets stability: Sublinear growth and competitive coexistence across ecosystems, Science, 383, eadg8488, https://doi.org/10.1126/science.adg8488, 2024.
Hendry, K. R., Marron, A. O., Vincent, F., Conley, D. J., Gehlen, M., Ibarbalz, F. M., Quéguiner, B., and Bowler, C.: Competition between silicifiers and non-silicifiers in the past and present ocean and its evolutionary impacts, Front. Mar. Sci., 5, 22, https://doi.org/10.3389/fmars.2018.00022, 2018.
Henson, S. A., Cael, B. B., Allen, S. R., and Dutkiewicz, S.: Future phytoplankton diversity in a changing climate, Nat. Commun., 12, https://doi.org/10.1038/s41467-021-25699-w, 2021.
Hinder, S. L., Hays, G. C., Edwards, M., Roberts, E. C., Walne, A. W., and Gravenor, M. B.: Changes in marine dinoflagellate and diatom abundance under climate change, Nat. Clim. Change, 2, 271–275, https://doi.org/10.1038/nclimate1388, 2012.
Hodel, F., Grespan, R., De Rafélis, M., Dera, G., Lezin, C., Nardin, E., Rouby, D., Aretz, M., Steinnman, M., Buatier, M., Lacan, F., Jeandel, C., and Chavagnac, V.: Drake Passage gateway opening and Antarctic Circumpolar Current onset 31 Ma ago: The message of foraminifera and reconsideration of the Neodymium isotope record, Chem. Geol., 570, 120171, https://doi.org/10.1016/j.chemgeo.2021.120171, 2021.
Hoem, F. S., Sauermilch, I., Aleksinski, A. K., Huber, M., Peterse, F., Sangiorgi, F., and Bijl, P. K.: Strength and variability of the Oligocene Southern Ocean surface temperature gradient, Commun. Earth Environ., 3, 322, https://doi.org/10.1038/s43247-022-00666-5, 2022.
Houben, A. J. P., Bijl, P. K., Pross, J., Bohaty, S. M., Passchier, S., Stickley, C. E., Röhl, U., Sugisaki, S., Tauxe, L., Van De Flierdt, T., Olney, M., Sangiorgi, F., Sluijs, A., Escutia, C., Brinkhuis, H., and the Expedition 318 Scientists: Reorganization of Southern Ocean Plankton Ecosystem at the Onset of Antarctic Glaciation, Science, 340, 341–344, https://doi.org/10.1126/science.1223646, 2013.
Houben, A. J. P., Bijl, P. K., Sluijs, A., Schouten, S., and Brinkhuis, H.: Late Eocene Southern Ocean Cooling and Invigoration of Circulation Preconditioned Antarctica for Full-Scale Glaciation, Geochem. Geophy. Geosy., 20, 2214–2234, https://doi.org/10.1029/2019GC008182, 2019.
Jackson, G. A.: Effect of coagulation on a model planktonic food web, Deep-Sea Res. Pt. I, 48, 95–123, https://doi.org/10.1016/S0967-0637(00)00040-6, 2001.
Kennett, J. P.: Cenozoic evolution of Antarctic glaciation, the circum-Antarctic Ocean, and their impact on global paleoceanography, J. Geophys. Res., 82, 3843–3860, https://doi.org/10.1029/JC082i027p03843, 1977.
Kiørboe, T.: Turbulence, Phytoplankton Cell Size, and the Structure of Pelagic Food Webs, in: Advances in Marine Biology, vol. 29, Elsevier, 1–72, https://doi.org/10.1016/S0065-2881(08)60129-7, 1993.
Langton, S. J., Rabideaux, N. M., Borrelli, C., and Katz, M. E.: Southeastern Atlantic deep-water evolution during the late-middle Eocene to earliest Oligocene (Ocean Drilling program site 1263 and Deep Sea Drilling project site 366), Geosphere, 12, 1032–1047, https://doi.org/10.1130/GES01268.1, 2016.
Lazarus, D.: An improved cover-slip holder for preparing microslides of randomly distributed particles, J. Sediment. Res., 64, 686–0, https://doi.org/10.2110/jsr.64.686, 1994.
Lazarus, D., Barron, J., Renaudie, J., Diver, P., and Türke, A.: Cenozoic Planktonic Marine Diatom Diversity and Correlation to Climate Change, PLoS ONE, 9, e84857, https://doi.org/10.1371/journal.pone.0084857, 2014.
Liow, L. H. and Stenseth, N. C.: The rise and fall of species: implications for macroevolutionary and macroecological studies, P. Roy. Soc. B, 274, 2745–2752, https://doi.org/10.1098/rspb.2007.1006, 2007.
Liu, Z., Pagani, M., Zinniker, D., DeConto, R., Huber, M., Brinkhuis, H., Shah, S. R., Leckie, R. M., and Pearson, A.: Global Cooling During the Eocene–Oligocene Climate Transition, Science, 323, 1187–1190, https://doi.org/10.1126/science.1166368, 2009.
Magurran, A. E.: Measuring Biological Diversity, Wiley, ISBN 978-1-118-68792-5, 2004.
Marinov, I., Doney, S. C., and Lima, I. D.: Response of ocean phytoplankton community structure to climate change over the 21st century: partitioning the effects of nutrients, temperature and light, Biogeosciences, 7, 3941–3959, https://doi.org/10.5194/bg-7-3941-2010, 2010.
Marshall, C. R.: Confidence intervals on stratigraphic ranges with nonrandom distributions of fossil horizons, Paleobiology, 23, 165–173, https://doi.org/10.1017/s0094837300016766, 1997.
Maurer, B. A. and Nott, M. P.: Geographic Range Fragmentation and the Evolution of Biological Diversity, in: Biodiversity Dynamics: Turnover of Populations, Taxa, and Communities, edited by: McKinney, M. L. and Drake, J. A., Columbia University Press, 31–50, ISBN 978-0-231-50580-2, 1998.
McKinney, M. L.: How do rare species avoid extinction? A paleontological view, in: The Biology of Rarity, edited by: Kunin, W. E. and Gaston, K. J., Springer Netherlands, Dordrecht, 110–129, https://doi.org/10.1007/978-94-011-5874-9_7, 1997.
Moore Jr., T. C.: Method Of Randomly Distributing Grains For Microscopic Examination, in: Vol. 43, SEPM JSR, https://doi.org/10.1306/74D728BA-2B21-11D7-8648000102C1865D, 1973.
Özen, V.: oezenvolkan/Oezenetal2025: Summitted Release (0.1.0), Zenodo [data set], https://doi.org/10.5281/zenodo.14605790, 2025 (code available at: https://github.com/oezenvolkan/Oezenetal2025, last access: 11 March 2026).
Özen, V., Renaudie, J., and Lazarus, D.: Özen et al Unraveling Southern Ocean Diatom Diversity Across the Eocene/Oligocene Transition, Zenodo [data set], https://doi.org/10.5281/zenodo.14608178, 2025.
Pagani, M., Zachos, J. C., Freeman, K. H., Tipple, B., and Bohaty, S.: Marked Decline in Atmospheric Carbon Dioxide Concentrations During the Paleogene, Science, 309, 600–603, https://doi.org/10.1126/science.1110063, 2005.
Pascher, K. M., Hollis, C. J., Bohaty, S. M., Cortese, G., McKay, R. M., Seebeck, H., Suzuki, N., and Chiba, K.: Expansion and diversification of high-latitude radiolarian assemblages in the late Eocene linked to a cooling event in the southwest Pacific, Clim. Past, 11, 1599–1620, https://doi.org/10.5194/cp-11-1599-2015, 2015.
Pearson, P. N., Van Dongen, B. E., Nicholas, C. J., Pancost, R. D., Schouten, S., Singano, J. M., and Wade, B. S.: Stable warm tropical climate through the Eocene Epoch, Geology, 35, 211, https://doi.org/10.1130/g23175a.1, 2007.
Persico, D. and Villa, G.: Eocene–Oligocene calcareous nannofossils from Maud Rise and Kerguelen Plateau (Antarctica): paleoecological and paleoceanographic implications, Mar. Micropaleontol., 52, 153–179, https://doi.org/10.1016/j.marmicro.2004.05.002, 2004.
Plancq, J., Mattioli, E., Pittet, B., Simon, L., and Grossi, V.: Productivity and sea-surface temperature changes recorded during the late Eocene–early Oligocene at DSDP Site 511 (South Atlantic), Palaeogeogr. Palaeoclima. Palaeoecol., 407, 34–44, https://doi.org/10.1016/j.palaeo.2014.04.016, 2014.
Pusz, A. E., Thunell, R. C., and Miller, K. G.: Deep water temperature, carbonate ion, and ice volume changes across the Eocene–Oligocene climate transition, Paleoceanography, 26, 2010PA001950, https://doi.org/10.1029/2010PA001950, 2011.
Rabosky, D. L. and Sorhannus, U.: Diversity dynamics of marine planktonic diatoms across the Cenozoic, Nature, 457, 183–186, https://doi.org/10.1038/nature07435, 2009.
Ragueneau, O., Tréguer, P., Leynaert, A., Anderson, R. F., Brzezinski, M. A., DeMaster, D. J., Dugdale, R. C., Dymond, J., Fischer, G., François, R., Heinze, C., Maier-Reimer, E., Martin-Jézéquel, V., Nelson, D. M., and Quéguiner, B.: A review of the Si cycle in the modern ocean: recent progress and missing gaps in the application of biogenic opal as a paleoproductivity proxy, Global Planet. Change, 26, 317–365, https://doi.org/10.1016/S0921-8181(00)00052-7, 2000.
Renaudie, J.: Quantifying the Cenozoic marine diatom deposition history: links to the C and Si cycles, Biogeosciences, 13, 6003–6014, https://doi.org/10.5194/bg-13-6003-2016, 2016.
Renaudie, J. and Lazarus, D. B.: On the accuracy of paleodiversity reconstructions: a case study in Antarctic Neogene radiolarians, Paleobiology, 39, 491–509, https://doi.org/10.1666/12016, 2013.
Renaudie, J., Drews, E.-L., and Böhne, S.: The Paleocene record of marine diatoms in deep-sea sediments, Foss. Rec., 21, 183–205, https://doi.org/10.5194/fr-21-183-2018, 2018.
Renaudie, J., Lazarus, D., and Diver, P.: NSB (Neptune Sandbox Berlin): An expanded and improved database of marine planktonic microfossil data and deep-sea stratigraphy, Palaeontol. Electron., https://doi.org/10.26879/1032, 2020.
Renaudie, J., Lazarus, D., and Diver, P.: Archive of Neptune (NSB) database backups (2023-06-05), Zenodo [data set], https://doi.org/10.5281/ZENODO.10063218, 2023.
Rineau, V., Smyčka, J., and Storch, D.: Diversity dependence is a ubiquitous phenomenon across Phanerozoic oceans, Sci. Adv., 8, eadd9620, https://doi.org/10.1126/sciadv.add9620, 2022.
Rodrigues De Faria, G., Lazarus, D., Renaudie, J., Stammeier, J., Özen, V., and Struck, U.: Late Eocene to early Oligocene productivity events in the proto-Southern Ocean and correlation to climate change, Clim. Past, 20, 1327–1348, https://doi.org/10.5194/cp-20-1327-2024, 2024.
Salamy, K. A. and Zachos, J. C.: Latest Eocene–Early Oligocene climate change and Southern Ocean fertility: inferences from sediment accumulation and stable isotope data, Palaeogeogr. Palaeoclim. Palaeoecol. 145, 61–77, https://doi.org/10.1016/S0031-0182(98)00093-5, 1999.
Sarkar, S., Basak, C., Frank, M., Berndt, C., Huuse, M., Badhani, S., and Bialas, J.: Late Eocene onset of the Proto-Antarctic Circumpolar Current, Sci. Rep., 9, 10125, https://doi.org/10.1038/s41598-019-46253-1, 2019.
Sauermilch, I., Whittaker, J. M., Klocker, A., Munday, D. R., Hochmuth, K., Bijl, P. K., and LaCasce, J. H.: Gateway-driven weakening of ocean gyres leads to Southern Ocean cooling, Nat. Commun., 12, https://doi.org/10.1038/s41467-021-26658-1, 2021.
Scher, H. D. and Martin, E. E.: Timing and Climatic Consequences of the Opening of Drake Passage, Science, 312, 428–430, https://doi.org/10.1126/science.1120044, 2006.
Scher, H. D., Bohaty, S. M., Zachos, J. C., and Delaney, M. L.: Two-stepping into the icehouse: East Antarctic weathering during progressive ice-sheet expansion at the Eocene–Oligocene transition, Geology, 39, 383–386, https://doi.org/10.1130/G31726.1, 2011.
Scher, H. D., Bohaty, S. M., Smith, B. W., and Munn, G. H.: Isotopic interrogation of a suspected late Eocene glaciation: Hidden glaciation revealed in the Eocene, Paleoceanography, 29, 628–644, https://doi.org/10.1002/2014PA002648, 2014.
Seabold, S. and Perktold, J.: statsmodels: Econometric and statistical modeling with python, in: Proceedings of the 9th Python in Science Conference, https://doi.org/0.25080/Majora-92bf1922-011, 2010.
Shackleton, N. J. and Kennett, J. P.: Paleotemperature History of the Cenozoic and the Initiation of Antarctic Glaciation: Oxygen and Carbon Isotope Analyses in DSDP Sites 277, 279 and 281, in: Initial Reports of the Deep Sea Drilling Project 29, US Government Printing Office, https://doi.org/10.2973/dsdp.proc.29.117.1975, 1975.
Straume, E. O., Nummelin, A., Gaina, C., and Nisancioglu, K. H.: Climate transition at the Eocene–Oligocene influenced by bathymetric changes to the Atlantic-Arctic oceanic gateways, P. Natl. Acad. Sci. USA, 119, e2115346119, https://doi.org/10.1073/pnas.2115346119, 2022.
Strelnikova, N. I. and Vasilyev, C. V.: Statistical analysis applied to evaluate taxonomic divisions in the genus Pyxilla Greville, Beihefte zur Nova Hedwigia, 106, 275–289, 1993.
Sutton, J. N., Varela, D. E., Brzezinski, M. A., and Beucher, C. P.: Species-dependent silicon isotope fractionation by marine diatoms, Geochim. Cosmochim. Ac., 104, 300–309, https://doi.org/10.1016/j.gca.2012.10.057, 2013.
Tibbett, E. J., Burls, N. J., Hutchinson, D. K., and Feakins, S. J.: Proxy-Model Comparison for the Eocene–Oligocene Transition in Southern High Latitudes, Paleoceanogr. Paleoclimatol., 38, e2022PA004496, https://doi.org/10.1029/2022PA004496, 2023.
Toumoulin, A., Donnadieu, Y., Ladant, J. B., Batenburg, S. J., Poblete, F., and Dupont-Nivet, G.: Quantifying the Effect of the Drake Passage Opening on the Eocene Ocean, Paleoceanogr. Paleoclimatol., 35, e2020PA003889, https://doi.org/10.1029/2020PA003889, 2020.
Tréguer, P., Bowler, C., Moriceau, B., Dutkiewicz, S., Gehlen, M., Aumont, O., Bittner, L., Dugdale, R., Finkel, Z., Iudicone, D., Jahn, O., Guidi, L., Lasbleiz, M., Leblanc, K., Levy, M., and Pondaven, P.: Influence of diatom diversity on the ocean biological carbon pump, Nat. Geosci., 11, 27–37, https://doi.org/10.1038/s41561-017-0028-x, 2018.
Trubovitz, S., Lazarus, D., Renaudie, J., and Noble, P. J.: Marine plankton show threshold extinction response to Neogene climate change, Nat. Commun., 11, 5069, https://doi.org/10.1038/s41467-020-18879-7, 2020.
Villa, G., Fioroni, C., Persico, D., Roberts, A. P., and Florindo, F.: Middle Eocene to Late Oligocene Antarctic glaciation/deglaciation and Southern Ocean productivity, Paleoceanography, 29, 223–237, https://doi.org/10.1002/2013PA002518, 2014.
Warnock, J. P. and Scherer, R. P.: Increased diatom dissolution in Prydz Bay, East Antarctica linked to inception of the Prydz Bay gyre, Diatom Res., 31, 161–168, https://doi.org/10.1080/0269249X.2016.1182075, 2016.
Westerhold, T., Marwan, N., Drury, A. J., Liebrand, D., Agnini, C., Anagnostou, E., Barnet, J. S. K., Bohaty, S. M., De Vleeschouwer, D., Florindo, F., Frederichs, T., Hodell, D. A., Holbourn, A. E., Kroon, D., Lauretano, V., Littler, K., Lourens, L. J., Lyle, M., Pälike, H., Röhl, U., Tian, J., Wilkens, R. H., Wilson, P. A., and Zachos, J. C.: An astronomically dated record of Earth's climate and its predictability over the last 66 million years, Science, 369, 1383–1387, https://doi.org/10.1126/science.aba6853, 2020.
Wolda, H.: Similarity indices, sample size and diversity, Oecologia, 50, 296–302, https://doi.org/10.1007/BF00344966, 1981.
Wright, N. M., Scher, H. D., Seton, M., Huck, C. E., and Duggan, B. D.: No Change in Southern Ocean Circulation in the Indian Ocean From the Eocene Through Late Oligocene, Paleoceanogr. Paleoclimatol., 33, 152–167, https://doi.org/10.1002/2017PA003238, 2018.