the Creative Commons Attribution 4.0 License.
the Creative Commons Attribution 4.0 License.
 | 14 Apr 2026
Dinoflagellate cysts as indicators of primary productivity along a Baltic Sea–North Sea–Atlantic transect
Cecile S. Hilgen
Rick Hennekam
Marcel T. J. van der Meer
Timme H. Donders
Gert-Jan Reichart
Francesca Sangiorgi
Dinoflagellate cysts (dinocysts) have a long-standing use as proxies due to their global distribution and ecological significance. Their application to reconstruct past primary productivity has been frequently debated in the literature, and different dinocyst-based proxies have been proposed. Moreover, region-specific calibrations of modern dinocyst assemblages in relation to water parameters and sediment properties are needed to strengthen the reconstructions, specifically in regions where multiple environmental parameters co-vary. This study evaluates the potential of dinocysts as proxies for net primary productivity (NPP) using 37 core-top samples from the Baltic Sea, North Sea, and Atlantic Ocean. Our calibration dataset spans a wide gradient of NPP and other parameters, including sea surface temperature, salinity and nutrients, seasonality, bottom water oxygen, depth of the water column, distance to shoreline, sediment total organic carbon (TOC) content and origin, and grain size. After confirming recent sediment deposition via 234Thorium measurements and excluding inner Baltic Sea assemblages due to preservation bias in low-oxygen bottom waters, the canonical correspondence analysis (CCA) identified NPP as the main variable associated with dinocyst distribution in this region. Our results regarding established dinocyst-based productivity proxies show that (i) total dinocyst concentration and flux correlate better with TOC than with NPP, (ii) the heterotrophic phototrophic () ratio correlates weakly with NPP and thus seems not to be suitable to reconstruct NPP, and (iii) heterotrophic dinocyst concentration and flux correlate strongly with NPP and hence emerge as the best proxies to reconstruct marine primary productivity in this region. We applied the modern analogue technique (MAT) to predict NPP, which resulted in a good agreement between observed and estimated NPP values, with an uncertainty of approximately 11 %.
- Article
(9763 KB) - Full-text XML
-
Supplement
(2420 KB) - BibTeX
- EndNote


The Northwest European Shelf (NWES) is a significant carbon cycling hotspot due to high biological productivity, substantial input of terrestrial carbon and nutrients, and active exchange with the Atlantic Ocean (Thomas et al., 2004; Bozec et al., 2005; Legge et al., 2020). Currently, the high productivity of the NWES makes it function as a net carbon sink (Wakelin et al., 2012). However, its long-term role remains uncertain under future climate scenarios (Bauer et al., 2013), especially given compounding anthropogenic pressures like (cultural) eutrophication, which has altered productivity regimes (Hickel et al., 1993). To contextualize these changes, reliable sediment-based proxies are needed to reconstruct pre-anthropogenic baseline productivity conditions. This involves the development of regional calibration proxy datasets that translate the environmental characteristics of the water column (e.g., primary productivity) into the indicators obtained from sediments.
Here, we focus on the region within the NWES that reaches from the Baltic Sea to the Atlantic Ocean, across the Norwegian Trench, a gateway important for nutrient exchange between the North Sea and Atlantic Ocean. The high spatial variability in environmental conditions in this area requires finding microfossil indicators that are suitable for capturing such spatial variability, are preserved in the sediments, and can hence be used as proxies for past environmental conditions. Organic-walled dinoflagellate cysts (dinocysts) are abundant and well-preserved in sediments across the Baltic, North Sea and Atlantic Ocean (e.g., Rochon et al., 1999; Thorsen and Dale, 1998; Willumsen et al., 2013; Sildever et al., 2015). Combined with their established utility for reconstructing environmental conditions and primary productivity (e.g., Sangiorgi and Donders, 2004; Zonneveld et al., 2007; Radi and de Vernal, 2008; Zonneveld et al., 2009), they are promising productivity indicators, including for our study region.
Dinoflagellates exhibit two main trophic strategies: phototrophy and heterotrophy, although mixotrophy is increasingly being recognized as being important (e.g., Gárcia-Moreiras et al., 2025). Phototrophic species (often referred to as autotrophs) rely on photosynthesis, and their distribution and that of related dinocysts are more closely linked to water column properties such as sea surface temperature and salinity (e.g., Zonneveld et al., 2013; Marret et al., 2020). Heterotrophic dinoflagellate species that feed on organic matter such as phytoplankton and bacterial communities (Jacobson and Anderson, 1986; Jeong et al., 2008) generally dominate nutrient-rich, high-productivity environments, and their cysts are also abundant in these environments (e.g., Zonneveld et al., 2013). Several dinocyst-based proxies have been proposed for reconstructing primary productivity: (i) total dinocyst concentration, (ii) total dinocyst flux, (iii) heterotrophic dinocyst concentration, (iv) heterotrophic dinocyst flux, and (v) the ratio of heterotrophic to phototrophic dinocysts (; the ratio between heterotrophic and phototrophic is referred to here as A, Autotrophic for easier comparison with the notation reported in other papers) (e.g., Pospelova et al., 2008; Zonneveld et al., 2009; Price and Pospelova, 2011; Yedema et al., 2023). In addition, transfer functions have been applied as an alternative quantitative approach to relate dinocyst assemblages to estimates of primary productivity (e.g., Radi et al., 2007).
Because of the above-mentioned presence of dinocysts in Baltic Sea, North Sea, and Atlantic Ocean sediments, other studies have considered these regions, but they mostly include it within larger or global datasets (e.g., Rochon et al., 1999; Radi and de Vernal, 2008; Zonneveld et al., 2013; Marret et al., 2020; de Vernal et al., 2020) or target the Baltic Sea, with a focus on salinity (Mertens et al., 2011; Sildever et al., 2015), or consider coastal/fjord systems (e.g., Dale, 1976; Grøsfjeld and Harland, 2001).
This study investigates the relationship between dinocyst assemblages and water column parameters (i.e., sea surface temperature, salinity and nutrients, seasonality, bottom-water oxygen) and depth, distance to the shoreline, and sediment properties (i.e., total organic carbon content and origin and grain size) to evaluate their potential as environmental proxies. More specifically, we aim to detect which commonly used dinocyst-based proxy best reflects modern primary productivity based on 37 core-top samples collected along a transect spanning the Baltic Sea, North Sea, and Atlantic Ocean (Fig. 1). When feasible, we measured 234Thorium (234Th) activities to confirm that the core-top samples reflected modern sediment deposition. Because coastal sediments receive a mix of aquatic and terrestrial input, we also examine the relationship between the environmental parameters and a broader range of palynomorphs, including pollen and spores, freshwater algae, zooplankton remains, and other palynomorphs. Incorporating the total palynomorph assemblage data alongside dinocyst assemblages provides a more comprehensive view of how different sources of organic matter respond to environmental gradients in the area, offering valuable context for follow-up studies regarding the role of this area in past carbon cycling.
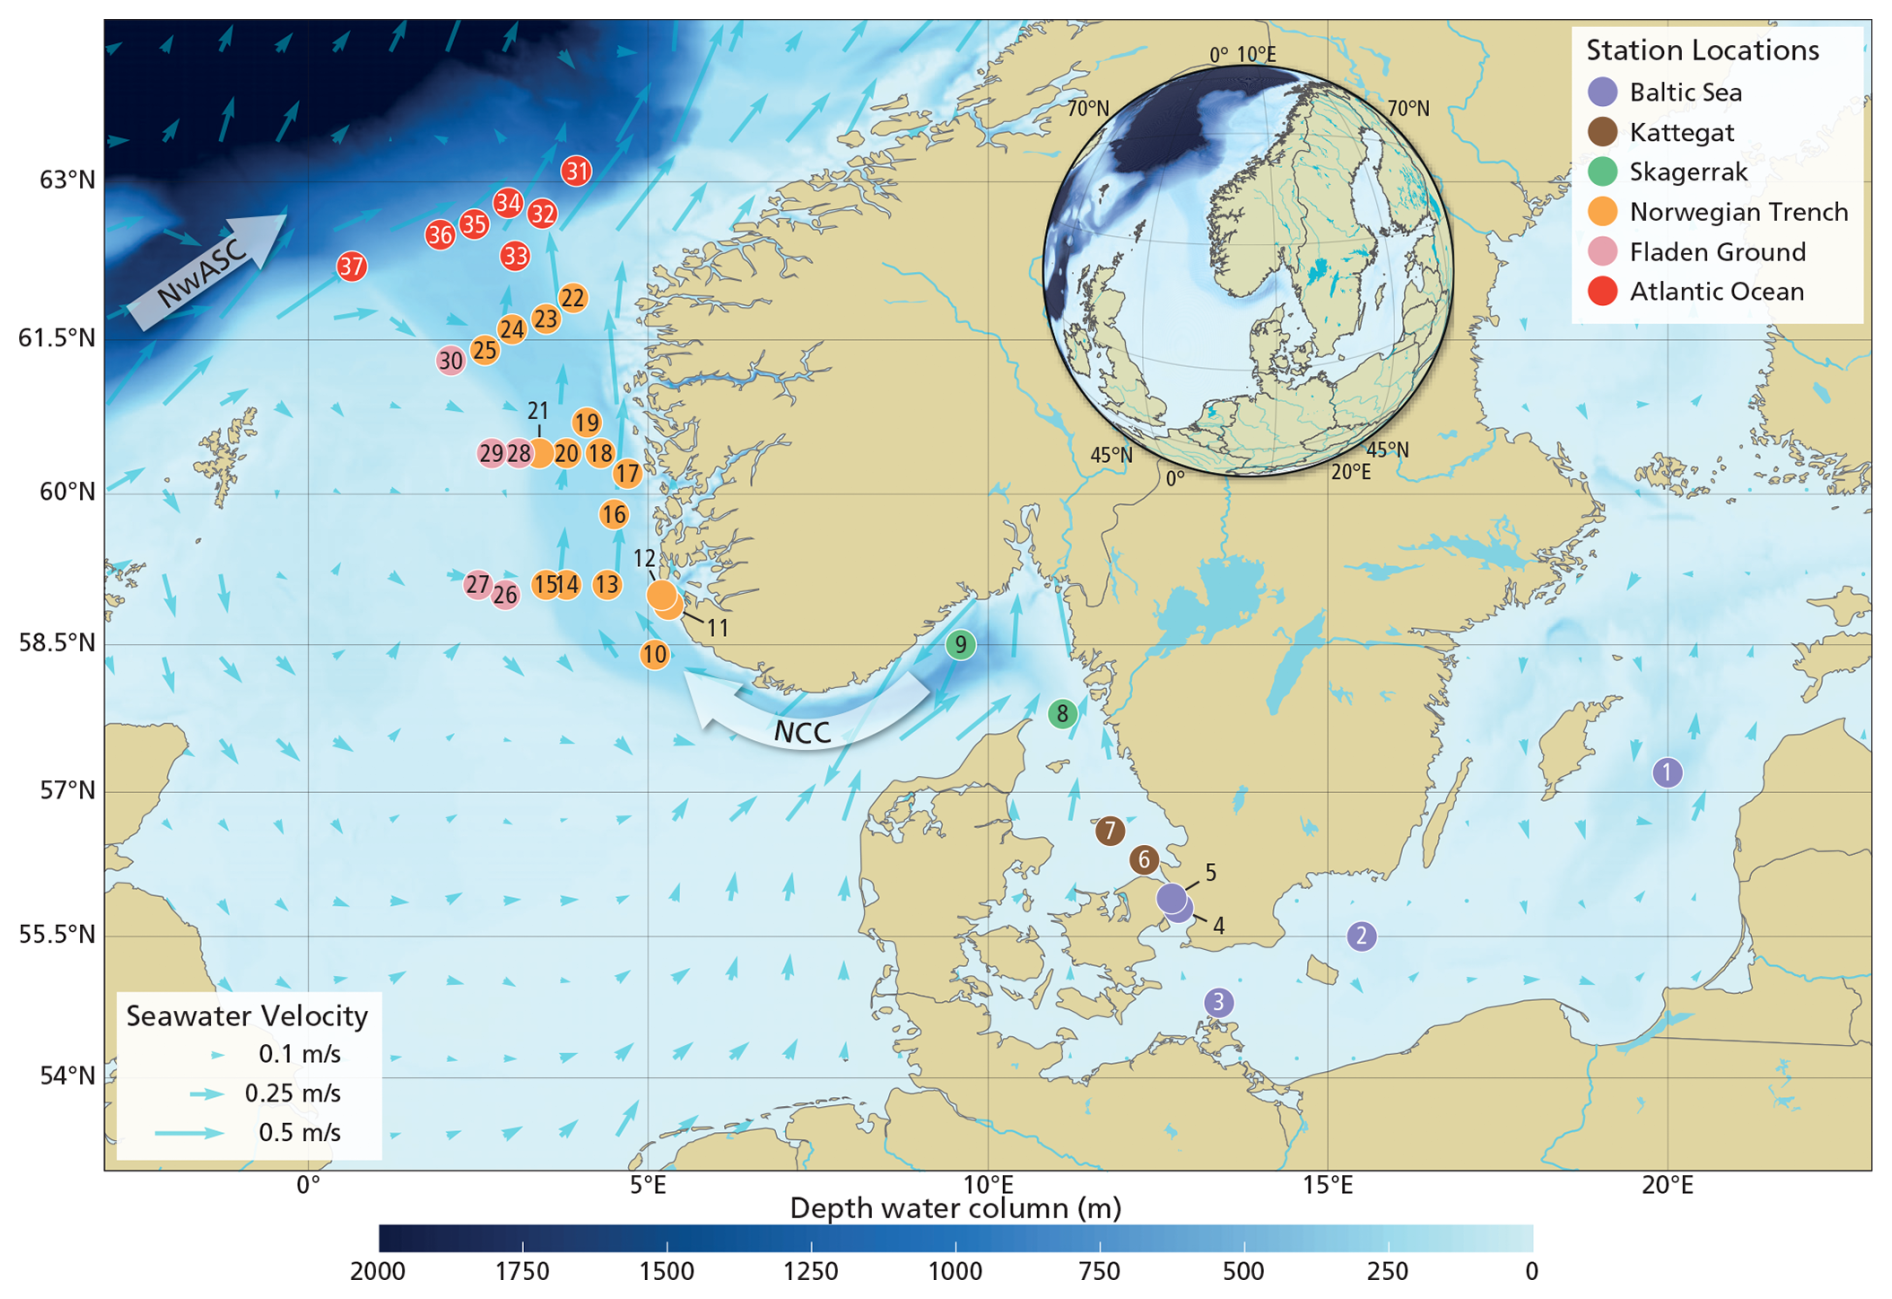
Figure 1Map showing station locations of the 37 retrieved core-top samples overlaid on a geographic base map including coastlines, national boundaries, rivers, and lakes (https://www.naturalearthdata.com/, last access: 18 February 2026, scale: 1:10 m). The colors of the station locations are assigned based on their geographic region. See detailed information per location in Table S1 in the Supplement. The small light-blue arrows represent the mean seawater velocity value of 2021–2024 derived from the EU Copernicus Marine Service physical model product (https://doi.org/10.48670/moi-00016, E.U. Copernicus Marine Service, 2025). The big arrows represent the Norwegian Coastal Current (NCC) and the Northwest Atlantic Slope Current (NwASC).
2.1 Study area
The study area is located along a transect from the inner marginal Baltic Sea to the open Atlantic Ocean, across the Kattegat, Skagerrak, Norwegian Trench, extending into the Fladen Ground and the Atlantic shelf break (300–1000 m water depth) to the continental slope (> 1000 m water depth) (Fig. 1). This region encompasses a wide range of surface ocean conditions, including marine primary productivity, temperature, salinity, and nutrient concentrations (Fig. S1 in the Supplement).
The Baltic Sea receives substantial freshwater input from major rivers, leading to stratification that inhibits (deep) vertical mixing. This contributes to widespread (seasonal) (bottom-water) hypoxia or anoxia in the inner Baltic Sea, which has expanded 10-fold in the last century, mostly due to (cultural) eutrophication and warming of the waters (Carstensen et al., 2014). The Baltic outflow supplies ∼ 60 % of the North Sea's freshwater (Leppäranta and Myrberg, 2009) and mixes with North Sea waters to form the Norwegian Coastal Current (NCC; Fig. 1). The NCC (upper 50–100 m), shaped by wind, topography, and freshwater input (Mork, 1981; Christensen et al., 2018), transports terrigenous clays and organic matter northwards (Frigstad et al., 2020). At the northern shelf edge, the Norwegian Atlantic Slope Current (NwASC; Fig. 1) retroflects within the Norwegian Trench, generating a hydrodynamic discontinuity in the inflow southwards (Furnes et al., 1986; Winther and Johannessen, 2006).
2.2 Core-top collection
A total of 37 surface samples were collected during three research cruises aboard the RV Pelagia in 2016, 2023, and 2024 (Table S1 in the Supplement). Sampling was geared towards capturing spatial variability within the study area with respect to primary productivity, sea surface salinity, and terrestrial organic matter inputs. In 2023 and 2024, coring was assisted by video transects to avoid rocky or trawled substrates. Multicores and box cores were collected (Ø 10 cm and 25–35 cm sediment length plus overlying water). Cores were sliced at 1 cm intervals (2016) or 0.5 cm intervals (2023–2024) using a hydraulic slicer in a temperature-controlled laboratory (7 °C). Samples were stored at −20 or −80 °C until processed. The depth of the water column (DWC) was recorded during each deployment using a single beam echo sounder. The distance to the shoreline (DTS) was calculated using the Natural Earth coastline shapefile (https://www.naturalearthdata.com/, last access: 10 October 2024, scale: 1:110 million).
2.3 Water column properties
Water column properties include net primary productivity (NPP; gC m−2 yr−1); sea surface temperature (SST; °C); sea surface salinity (SSS; unitless); bottom water oxygen (BWO; µmol kg−1); and sea surface inorganic nutrients, namely nitrate (N; µmol kg−1), phosphate (P; µmol kg−1), and silicate (Si; µmol kg−1).
NPP was estimated using the Vertical Generalized Production Model (VGPM; Behrenfeld and Falkowski, 1997), with chlorophyll-a data from MODIS-Aqua.R1.1 (https://orca.science.oregonstate.edu/1080.by.2160.monthly.hdf.vgpm.m.chl.m.sst.php, last access: 8 October 2025). This model was selected because it has been widely used in various palynological studies (e.g., Radi and de Vernal, 2008; de Vernal et al., 2020; Yedema et al., 2023), allowing direct comparison with existing datasets. Annual mean NPP values were calculated for the period of 2003 to 2023 using daily observations at a 0.1° spatial resolution (Fig. S1a) and then were averaged within a 50 km radius of each station. For stations located less than 5 km from shore (B4–5), the radius was extended to 100 km to minimize the influence of local coastal processes and to ensure that approximately the same number of data points were used per station.
SST, SSS, BWO, and nutrients were derived from the 2023 World Ocean Atlas (Reagan et al., 2024). SST, SSS, and nutrient data were extracted from 20 m water depth to capture the euphotic zone as this is the depth which dinoflagellates predominantly inhabit (de Vernal and Marret, 2007). Seasonality (ΔT) was quantified as the annual variation in SST (summer–winter). BWO data were retrieved from the corresponding station depths. SST and SSS were obtained from 0.25° × 0.25° grid cells and averaged over 1955–2022 (Fig. S1b–c), while BWO and nutrients were obtained from 1° × 1° grid cells and averaged over 1965–2022 (Fig. S1d–f). Subsequently, values were spatially averaged within a 50 km radius of each station. Although the BWO data include depth-specific values, gaps near the Kattegat (B4–K7) were filled by vertically and horizontally interpolating oxygen concentrations to the sampled depths and coordinates.
For each water column property, we also evaluated seasonal data.
2.4 Palynological data
Sediment samples were processed for palynology using the standard protocol in use at the GeoLab, Utrecht University. A tablet of Lycopodium clavatum (containing 19855 spores) was added to the samples prior to processing, enabling the calculation of the palynomorph concentrations according to Benninghoff (1962). Approximately 4 g of exactly weighted freeze-dried sediment (with a few exceptions from the Baltic Sea, less material was used because of the high total organic carbon (TOC)) was chemically treated with 10 % hydrochloric acid (HCl) to remove carbonates and 40 % cold hydrofluoric acid (HF) to remove silicates with no oxidation. The remaining organic residues were sieved through a 10 µm mesh, and microscope slides were prepared using glycerin jelly and paraplast.
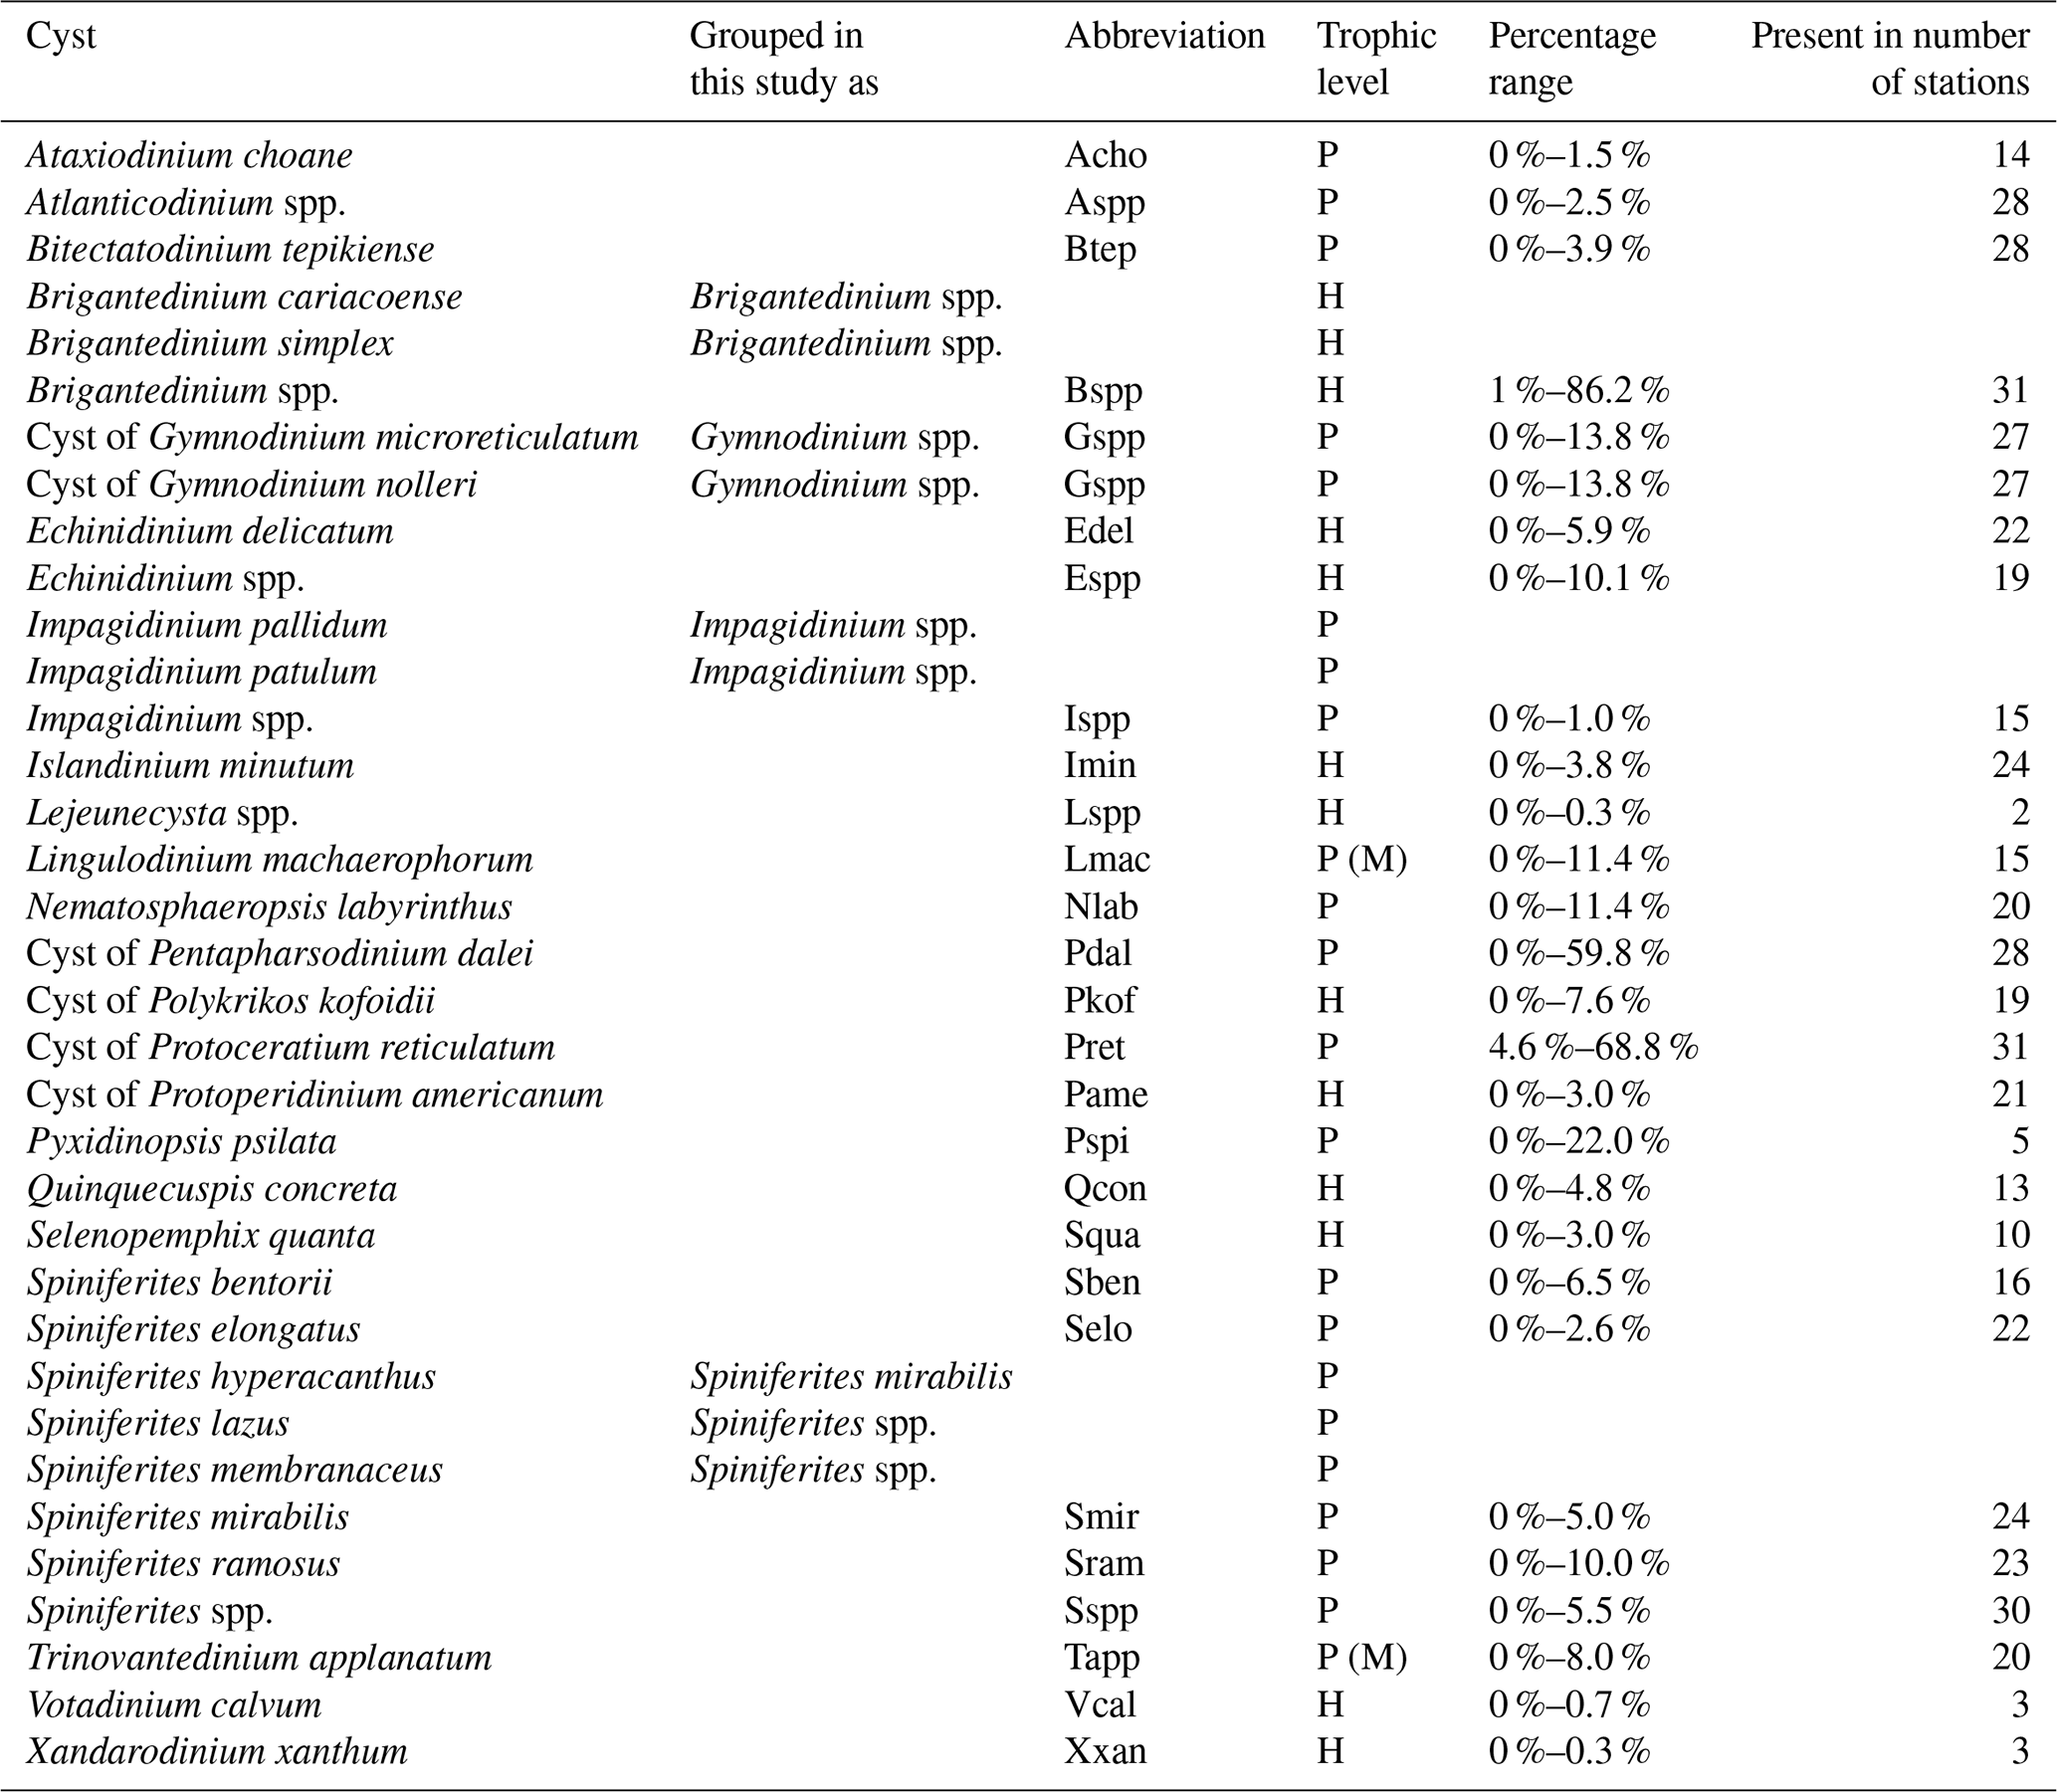
All palynomorphs were identified and counted under a light microscope at 400× magnification. A minimum of 300 dinocysts were counted per sample, or two entire microscopic slides were counted when abundances were low, to ensure statistical robustness (Mertens et al., 2009).. Dinocyst taxonomy follows Williams et al. (2017), and identification was based on Zonneveld and Pospelova (2015) and Head and Mantilla-Duran (2020). Dinocyst species were classified as phototrophic or heterotrophic according to the most recent dinocyst literature (Marret et al., 2020) (Table 1), considering Lingulodinium machaerophorum and Trinovantedinium applanatum to be phototrophic, although they are mixotrophic (Jeong et al., 2005; Gu et al., 2015). All other palynomorphs (i.e., bisaccate and non-bisaccate pollen, spores, freshwater algae, zoomorph remains, and other palynomorphs; Table S2) were counted simultaneously, with taxonomy and identification following Mudie et al. (2021), Faegri et al. (1989), and Punt and Clarke (2016). Relative abundances were calculated as a percentage of the total dinocyst or palynomorph sum.
To infer primary productivity, dinocyst-based proxies were selected due to their widespread use in paleo-environmental studies (e.g., Reichart and Brinkhuis, 2003; Sangiorgi and Donders, 2004; Radi and de Vernal, 2008; Zonneveld et al., 2009; Kim et al., 2012; Zwiep et al., 2018). The total and heterotrophic dinocyst concentrations are based on absolute abundances (number of cysts per gram dry-weight sediment), calculated using the marker grain method (Stockmarr, 1971). The proxy was calculated by dividing the heterotrophic dinocyst counts by the sum of heterotrophic and phototrophic dinocyst counts. The total and heterotrophic dinocyst fluxes (cysts cm−2 yr−1) were estimated by multiplying sediment mass accumulation rates (g cm−2 yr−1) (see Sect. 2.5) with dinocyst concentrations (cysts g−1).
Table 1List of dinoflagellate cyst species. In the trophic level column, the “P” stands for phototrophic dinocysts, the “M” stands for mixotrophic dinocysts which are included in the “P” group, and the “H” stands for heterotrophic dinocysts (Marret et al., 2020).
2.5 Sediment freshness and accumulation
We measured 234Thorium (234Th; Bq kg−1) to assess organic matter freshness and applied lead-210 (210Pb; Bq kg−1) dating to determine sedimentation rates, which we used to calculate dinocyst fluxes at eight selected stations: B1, N10, N14, N20, N23, N24, A33, and A31.
234Th was measured in ∼ 2 g dry weight of sample by counting the 63 keV using a γ counter. Excess activity was decay-corrected based on the time elapsed between sample collection and counting. Because of its short half-life (∼ 24 d), 234Th was only measured in samples collected during the 2023 cruise at the NIOZ Royal Netherlands Institute for Sea Research and the 2024 cruise at Utrecht University (stations N10–AO37). To ensure data quality and instrument reliability, cross-calibration was performed using silica diluted uranium ore, a reference standard (RGU-1) from the IAEA. Detector efficiency was 28.4 % at NIOZ (Canberra detector model BE3825) and 22.9 % at Utrecht University (Canberra detector model BE3830). Background correction was applied by subtracting the mean background value, determined from re-measurements of a subset of samples 3 months after the analysis.
210Pb was measured in ∼ 0.1 g dry weight of sample using α spectrometry with Canberra Passivated Implanted Planar Silicon (PIPS) detectors. Sedimentation rates at these stations were derived by fitting a constant flux/constant sedimentation (CF/CS) rate to the downcore 210Pb profile (Carpenter et al., 1982). Mass accumulation rates were then calculated by multiplying the sedimentation rates (cm yr−1) with the dry bulk density (g cm−3; calculated following Dadey et al., 1992).
2.6 Sediment properties
We also measured the total organic carbon (TOC) content, the stable bulk organic carbon isotope ratio δ13C (δ13Corg) as an indicator of the organic matter source (terrestrial vs. marine), and median grain size (MGS).
For TOC and δ13Corg, 0.5 g of freeze-dried, homogenized sediment was treated to remove inorganic carbon with excess 2M HCl until bubbling ceased and then was shaken overnight and rinsed repeatedly with deionized water until pH 5 was reached. The decalcified samples were freeze-dried again and analyzed using an elemental analyzer (ThermoScientific Flash 2000 Organic Elemental Analyzer) coupled to an isotope ratio mass spectrometer (IRMS, ThermoScientific Delta V) via a ConFlo IV interface (ThermoScientific). TOC is expressed as a weight percentage (wt %) of the dried sediment and has an error of ± 0.14 wt %, while the δ13Corg values are reported relative to the Vienna Pee Dee Belemnite (VPDB) standard and have an error of 0.2 ‰ or better based on the repeated analyses of lab-certified standards.
To determine the sediment MGS, the lithogenic fraction was isolated by chemical treatments. First, organic carbon was removed by oxidation with an excess of 35 % hydrogen peroxide (H2O2) at 85 °C for ∼ 10 min. Second, calcium carbonate was removed with an excess of 10 % HCl at 85 °C for 1 min. After these treatments, particle size distributions were measured with a Coulter laser diffraction particle sizer (LS13 320) using gas-free water. The grain size distribution was measured, ranging from 0.04 to 2000 µm across 116 size classes, of which the median value was calculated. MGS could not be determined at station B1. As the sedimentological characteristics were comparable to those at the nearest station, the MGS values from that station were used for subsequent analyses.
2.7 Statistical analyses
Correlations were calculated to evaluate potential relationships between the palynological data (i.e., palynomorph and dinocyst assemblages) and environmental data (i.e., water column and sediment properties).
A canonical correspondence analysis (CCA) was applied to dinocyst assemblages and 13 environmental variables using the “vegan” package in R (Oksanen et al., 2013). Given that dinocysts often exhibit non-linear responses to environmental gradients (e.g., Radi and de Vernal, 2008; Zonneveld and Pospelova, 2015), CCA was chosen as it is particularly suited for capturing complex, non-linear species–environment relationships (Ter Braak, 1986). Prior to analysis, species abundance data were square-root-transformed, and environmental data were log10-transformed to approach normal distribution and comparability. The resulting ordination was used to interpret species–station–environment relationships and to identify any potential clustering. CCA was performed on two assemblage datasets: one including all samples and another excluding the inner Baltic Sea samples (B1–3). These stations were removed from further analysis and interpretation due to their exposure to unique environmental conditions and high potential preservation biases. For each dataset, the influence of individual environmental parameters was assessed through a series of marginal CCA runs, each including a single water column or sediment variable. Canonical eigenvalue (λ) and permutation p values (999 permutations) were ranked by eigenvalue strength to evaluate their control on dinocyst distribution, providing a basis for proxy validation. For the second dataset (excluding B1–3), station scores along the first canonical axis (CCA1) were used as a quantitative measure of the environmental variable most strongly correlated with axis 1, representing the main driver of dinocyst distribution in this dataset. To test the predictive power of our dataset on NPP estimates in independent samples, we applied the modern analogue technique (MAT) as MAT inherently forces assemblages' variability to be explained along a single dominant gradient. MAT was implemented using the “analogue” package in R (Simpson, 2007). We used the squared chord distance on square-root-transformed proportions, with k=5 nearest analogues and inverse-distance weighting. A bootstrap (999 iterations) was used to evaluate the robustness of the estimations and to determine the (out-of-bag) root mean square error of prediction (RMSEP).
To explore potential linear relationships between palynological and environmental data, we performed Pearson's correlation analysis (Pearson, 1895). This approach identified strong statistically significant associations. For dinocyst-based proxies with (R2≥0.5) and p≤0.05, we considered the relationship to be statistically robust and applied linear regression models with 95 % confidence intervals around the regression lines.
3.1 Potential biases of a calibration dataset
3.1.1 Temporal biases
A critical challenge in calibrating paleoceanographic proxies is ensuring the best possible temporal match between the time period represented by the sediments from which the assemblage data are derived and the length (in years) of the water column environmental parameters considered. To address potential temporal biases, we evaluated 234Th and 210Pb activities. 234Th activities are the highest in the central Norwegian Trench, whereas the lowest values are in the Fladen Ground and Atlantic Ocean (Fig. S2a). 234Th and TOC show a positive relationship (R2=0.56, p<0.05; Fig. S2b). 210Pb measurements reveal a south-to-north decline in sedimentation rates in the North Sea, from 0.21 cm yr−1 at the southern Norwegian Trench (station N10) to 0.024 cm yr−1 on the northern continental slope (station A31). The inner Baltic Sea has the lowest sedimentation rate of 0.015 cm yr−1 (station B1) (Table S3). Sediments in our dataset reflect modern to recent deposition (see below and Table S3).
Moreover, we consider both seasonal and annual mean water column parameters as input for the CCA analysis and conclude that seasonal data do not significantly improve results as compared to mean annual data, suggesting that dinocyst distribution is generally not distinctively driven by seasonality. Noticeable seasonal differences are only observed for SST and N. However, their overall contributions to the species–environment relationship are weak, as indicated by low eigenvalues (Table 2, −BS). To remain consistent, we use annual means for all water column properties.
3.1.2 Preservation biases
Dinocysts, especially heterotrophic ones, are known to be sensitive to oxygen and, hence, selective preservation may affect the assemblages (Versteegh and Zonneveld, 2002; Zonneveld et al., 2007, 2008). In particular, as our dataset also includes stations from the Baltic Sea, assemblage results may potentially be biased by the hypoxic or anoxic conditions characteristic of this basin (Bergman Sjöstrand et al., 2025). Potential preservation biases are evaluated by comparing δ13Corg, MGS (sediment median grain size), BWO (bottom water oxygen), and NPP with TOC (Fig. 2). TOC values range from 0.07 wt % to 5.8 wt %, with the lowest values (< 1 wt %) in the Fladen Ground and Atlantic Ocean and the highest values (> 3 wt %) in the inner Baltic Sea (Fig. 2a). δ13Corg values range from −21.6 ‰ in the Atlantic Ocean to −25.7 ‰ in the inner Baltic Sea (Fig. 2b). MGS varies from smaller grain sizes (down to 5.1 µm) in the Skagerrak, Kattegat, and Baltic Sea to large grains sizes (up to 365.7 µm) in the Fladen Ground and Atlantic Ocean (Fig. 2c). Coarse-grained sediments are consistently characterized by low TOC and high δ13Corg, whereas fine-grained sediments exhibit a broader TOC range and generally lower δ13Corg values (Fig. 2d, e). BWO concentrations range from 14.0 to 301.8 µmol kg−1. When compared to TOC, BWO shows two distinct clusters, with stations B1 and B2 forming one cluster separate from the others (Fig. 2f), while station B3 does not cluster with any group and shows the highest TOC. NPP ranges from 266.1 to 1305.0 gC m−2 yr−1 and shows a positive correlation with TOC up to ∼ 400 gC m−2 yr−1, after which the relationship decouples, with high TOC values at moderate NPP values in the inner Baltic Sea (B1–3) and moderate TOC values spanning a wide range of high NPP values (Fig. 2g).
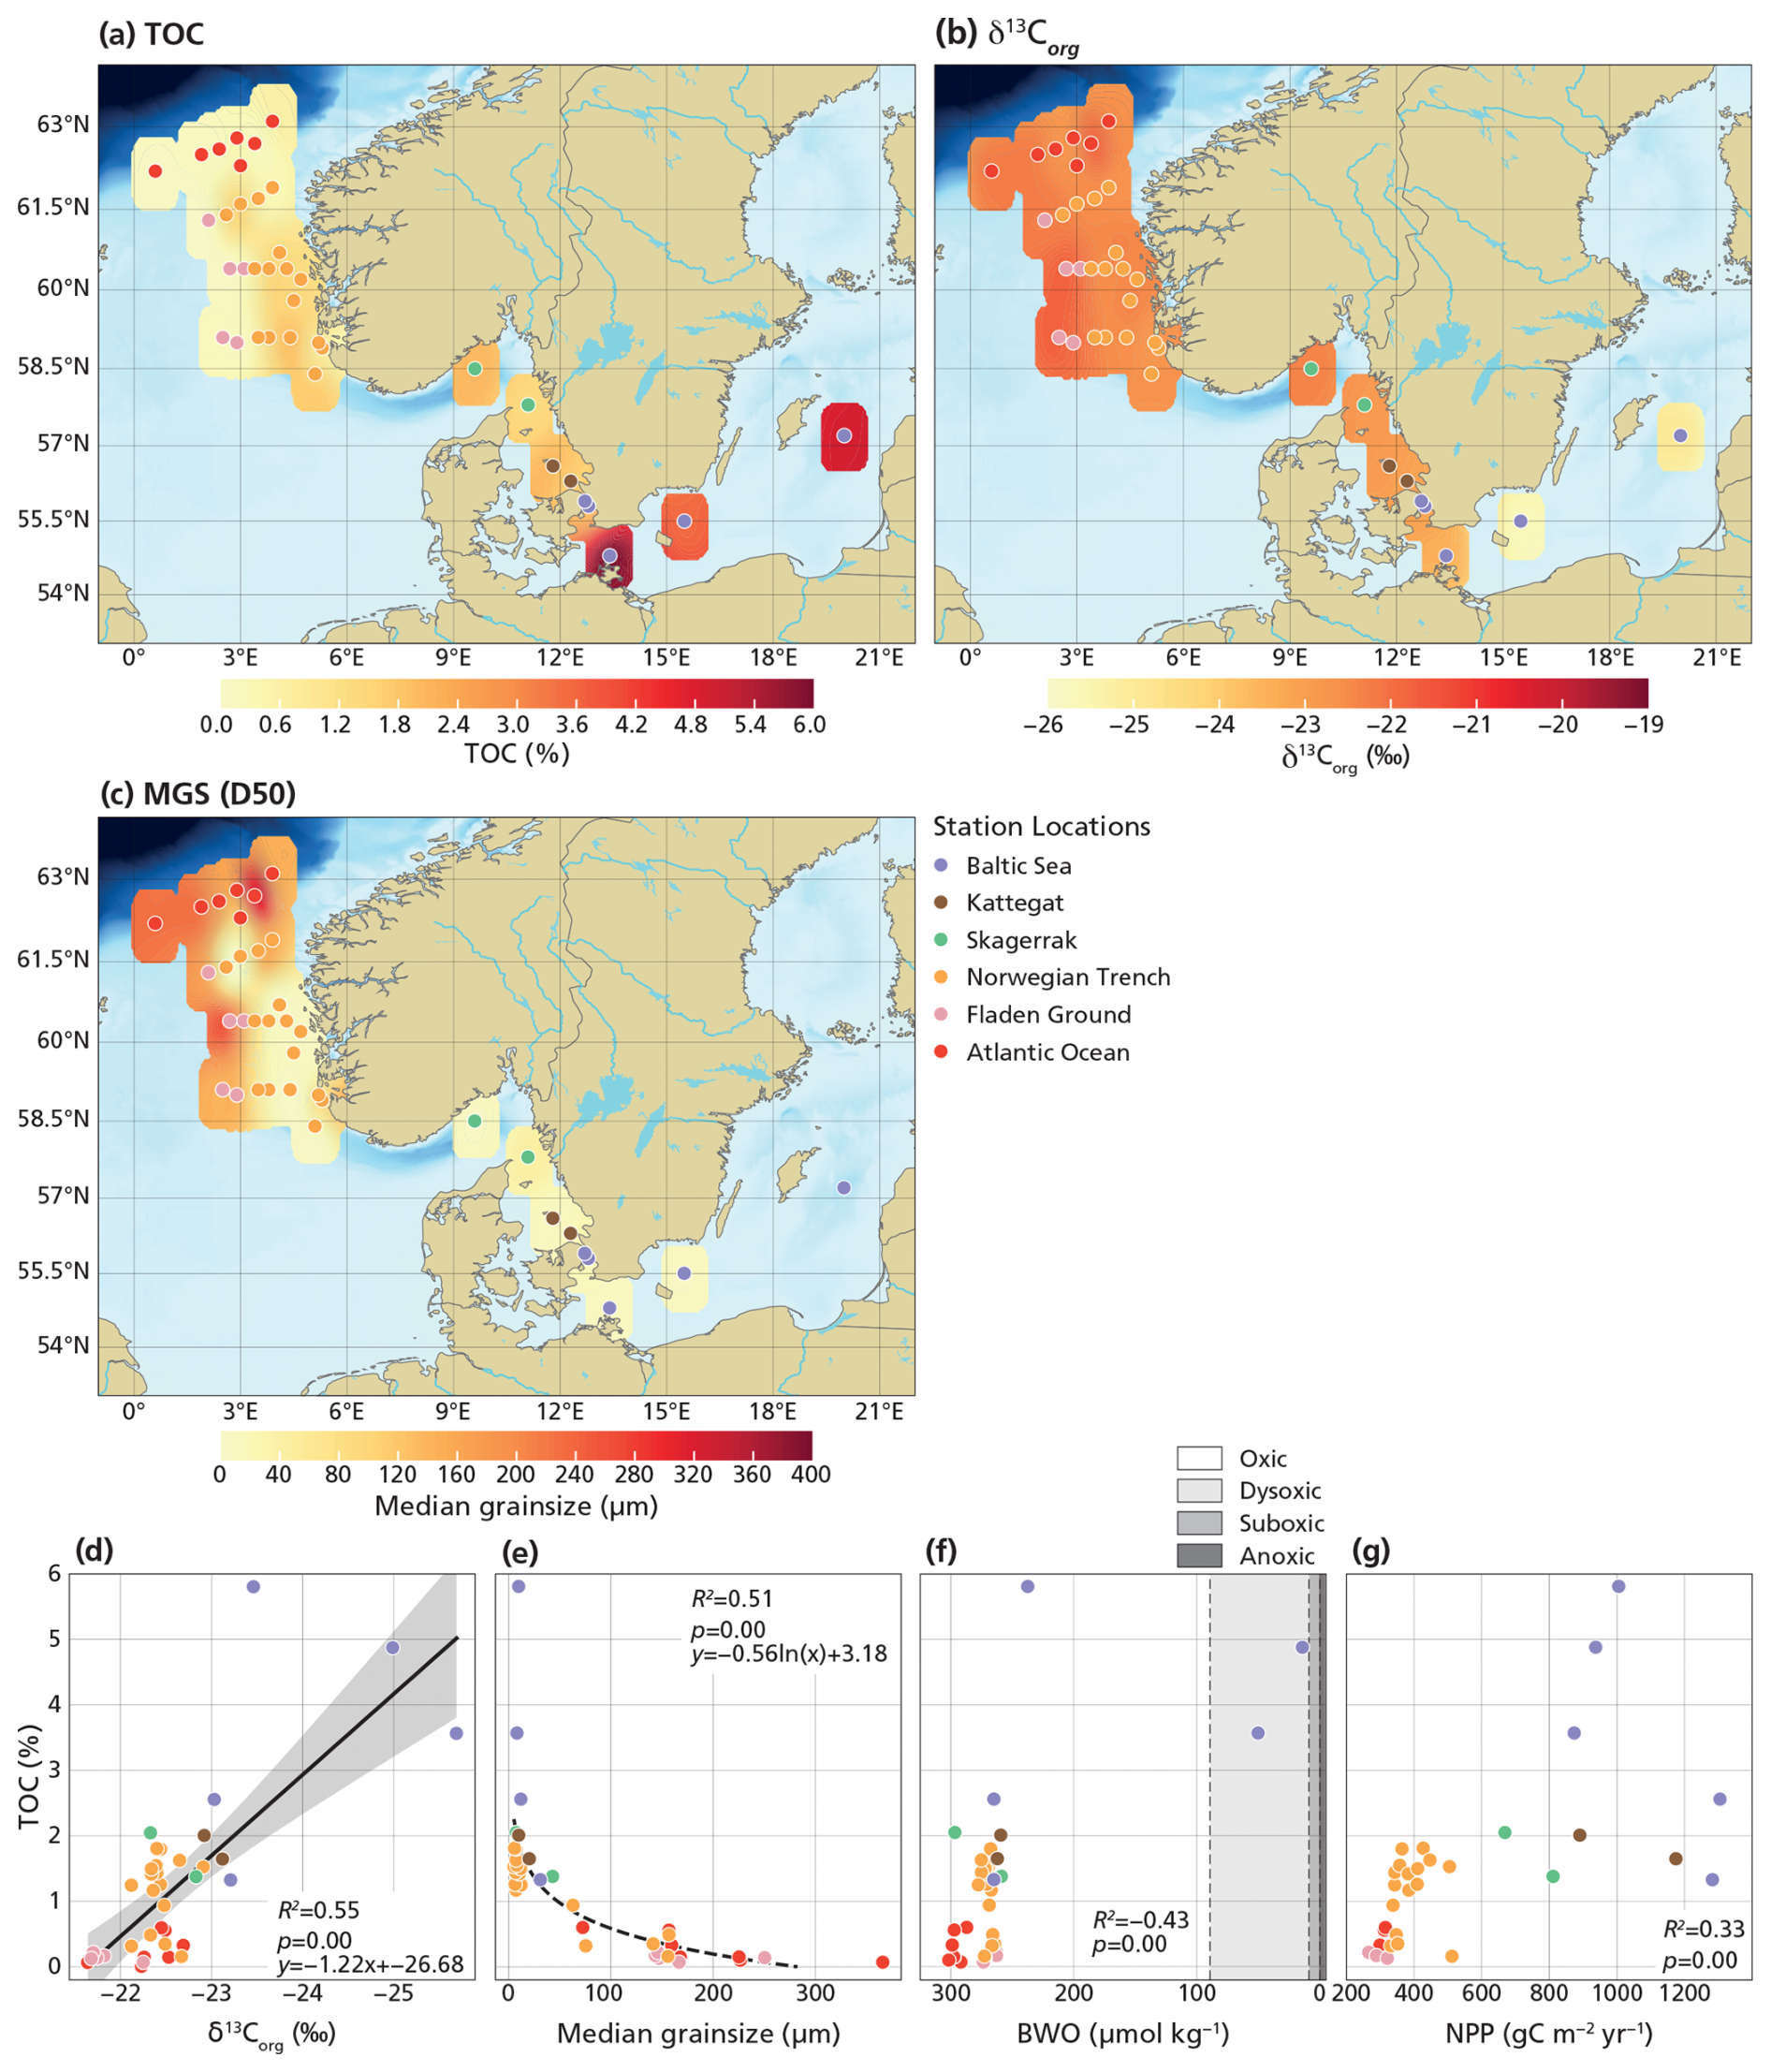
Figure 2Maps showing surface sediment data and cross-plots between surface sediment data and environmental parameters. The maps (a–c) display bulk sediment properties, including TOC (a) and δ13Corg (b), as well as organic carbon- and CaCO3-removed sediment properties, including MGS (c). The cross-plots (d–g) are between TOC and sediment characteristics and annual mean values of BWO (f) derived from the World Ocean Atlas 2023 (Reagan et al., 2024) and NPP (g) derived from the AQUA MODIS satellite (Behrenfeld and Falkowski, 1997). The definition of oxic zones (f) is based on Tyson and Pearson (1991). Linear regression was applied to relationships with R2≥0.5, with a 95 % confidence interval around the regression line (gray).
3.2 Palynomorph assemblages
Palynomorph (Fig. 3) and dinocyst (Fig. 4) assemblages in the 37 stations exhibit considerable spatial variability in terms of composition and abundance. In total, six samples were (nearly) barren of palynomorphs. These stations are located on the Fladen Ground (F29–30) and in the Atlantic Ocean (AO32, AO35–37). We removed the (almost) barren samples from the proxy validation. For the other stations, between 311 and 2046 palynomorphs were counted per sample.
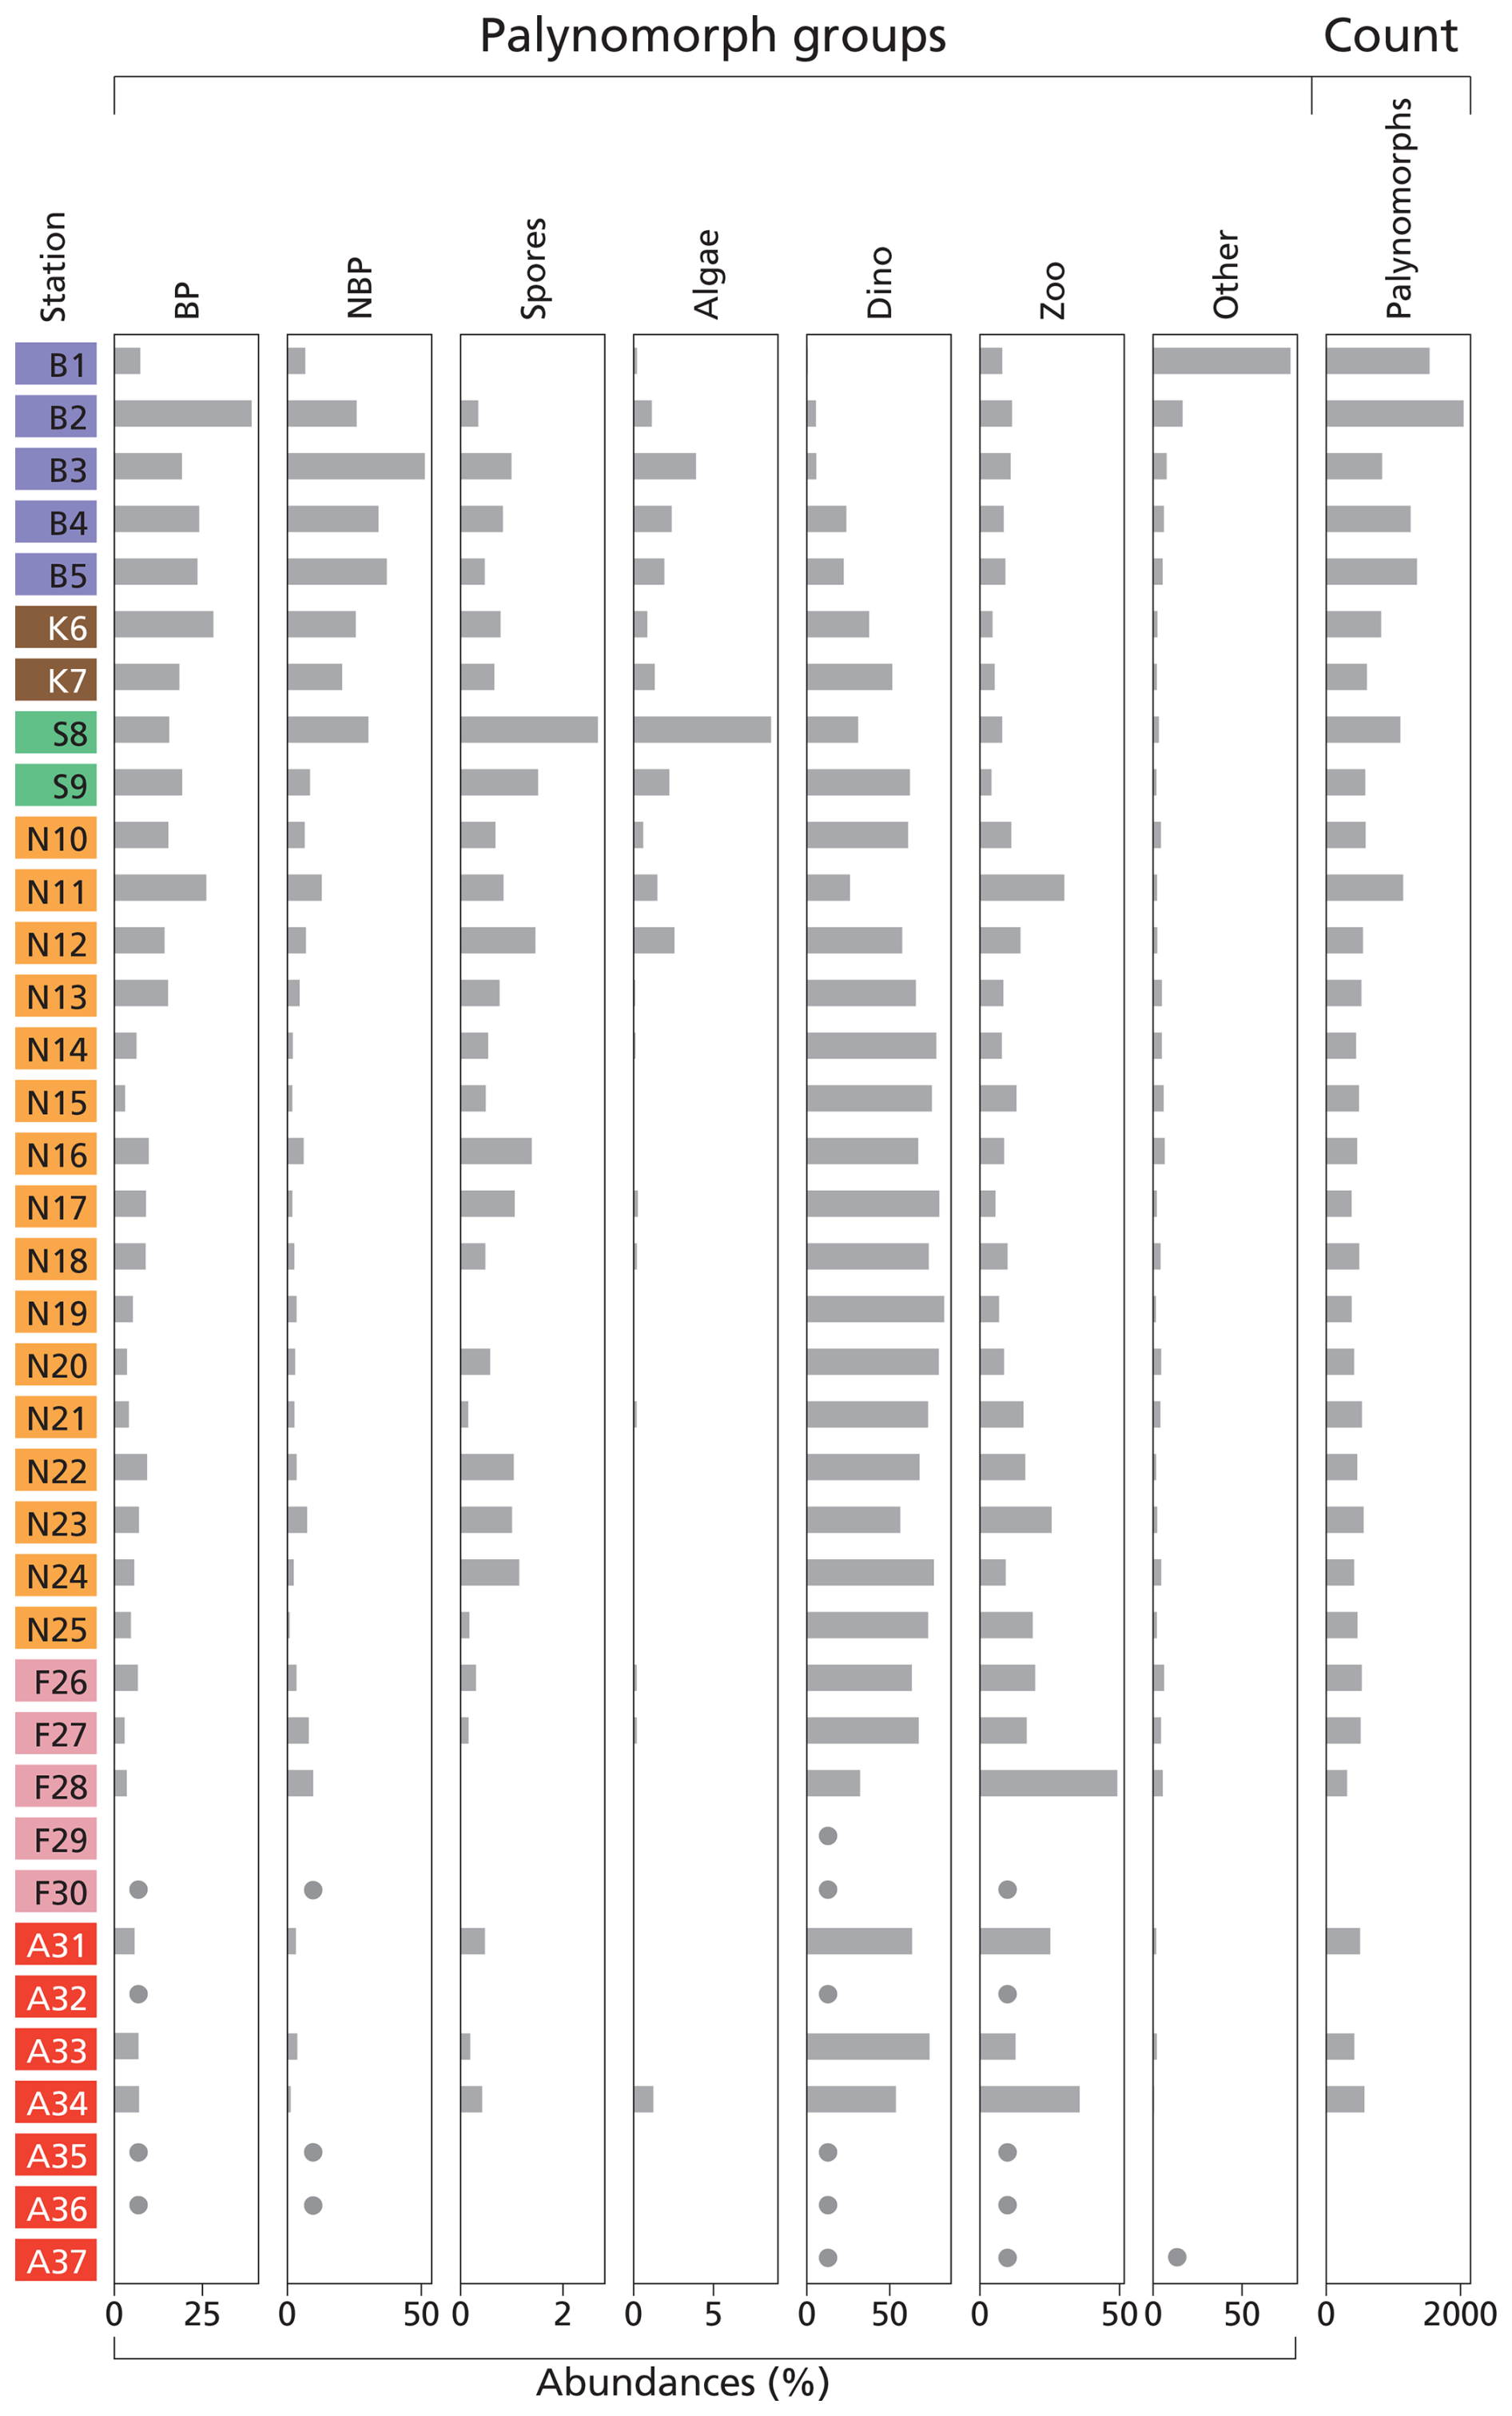
Figure 3Histogram of palynomorph groups (%) and total palynomorph (counts). Terrestrial palynomorphs are “BP” (bisaccate pollen), “NBP” (non-bisaccate pollen), and “spores”. Aquatic palynomorphs are “algae” (freshwater algae), “dino” (dinocysts), and “zoo” (zoomorph remains). “Other” stands for other palynomorphs. The taxa belonging to each group are listed in Table S2. For samples that are nearly barren in palynomorphs, dots indicate presence but in quantities too low to calculate relative abundances. Station “B” is from the Baltic Sea, station “K” is from Kattegat, station “S” is from Skagerrak, station “N” is from the Norwegian Trench, station “F” is from Fladen Ground, and station “A” is from the Atlantic Ocean (Fig. 1).
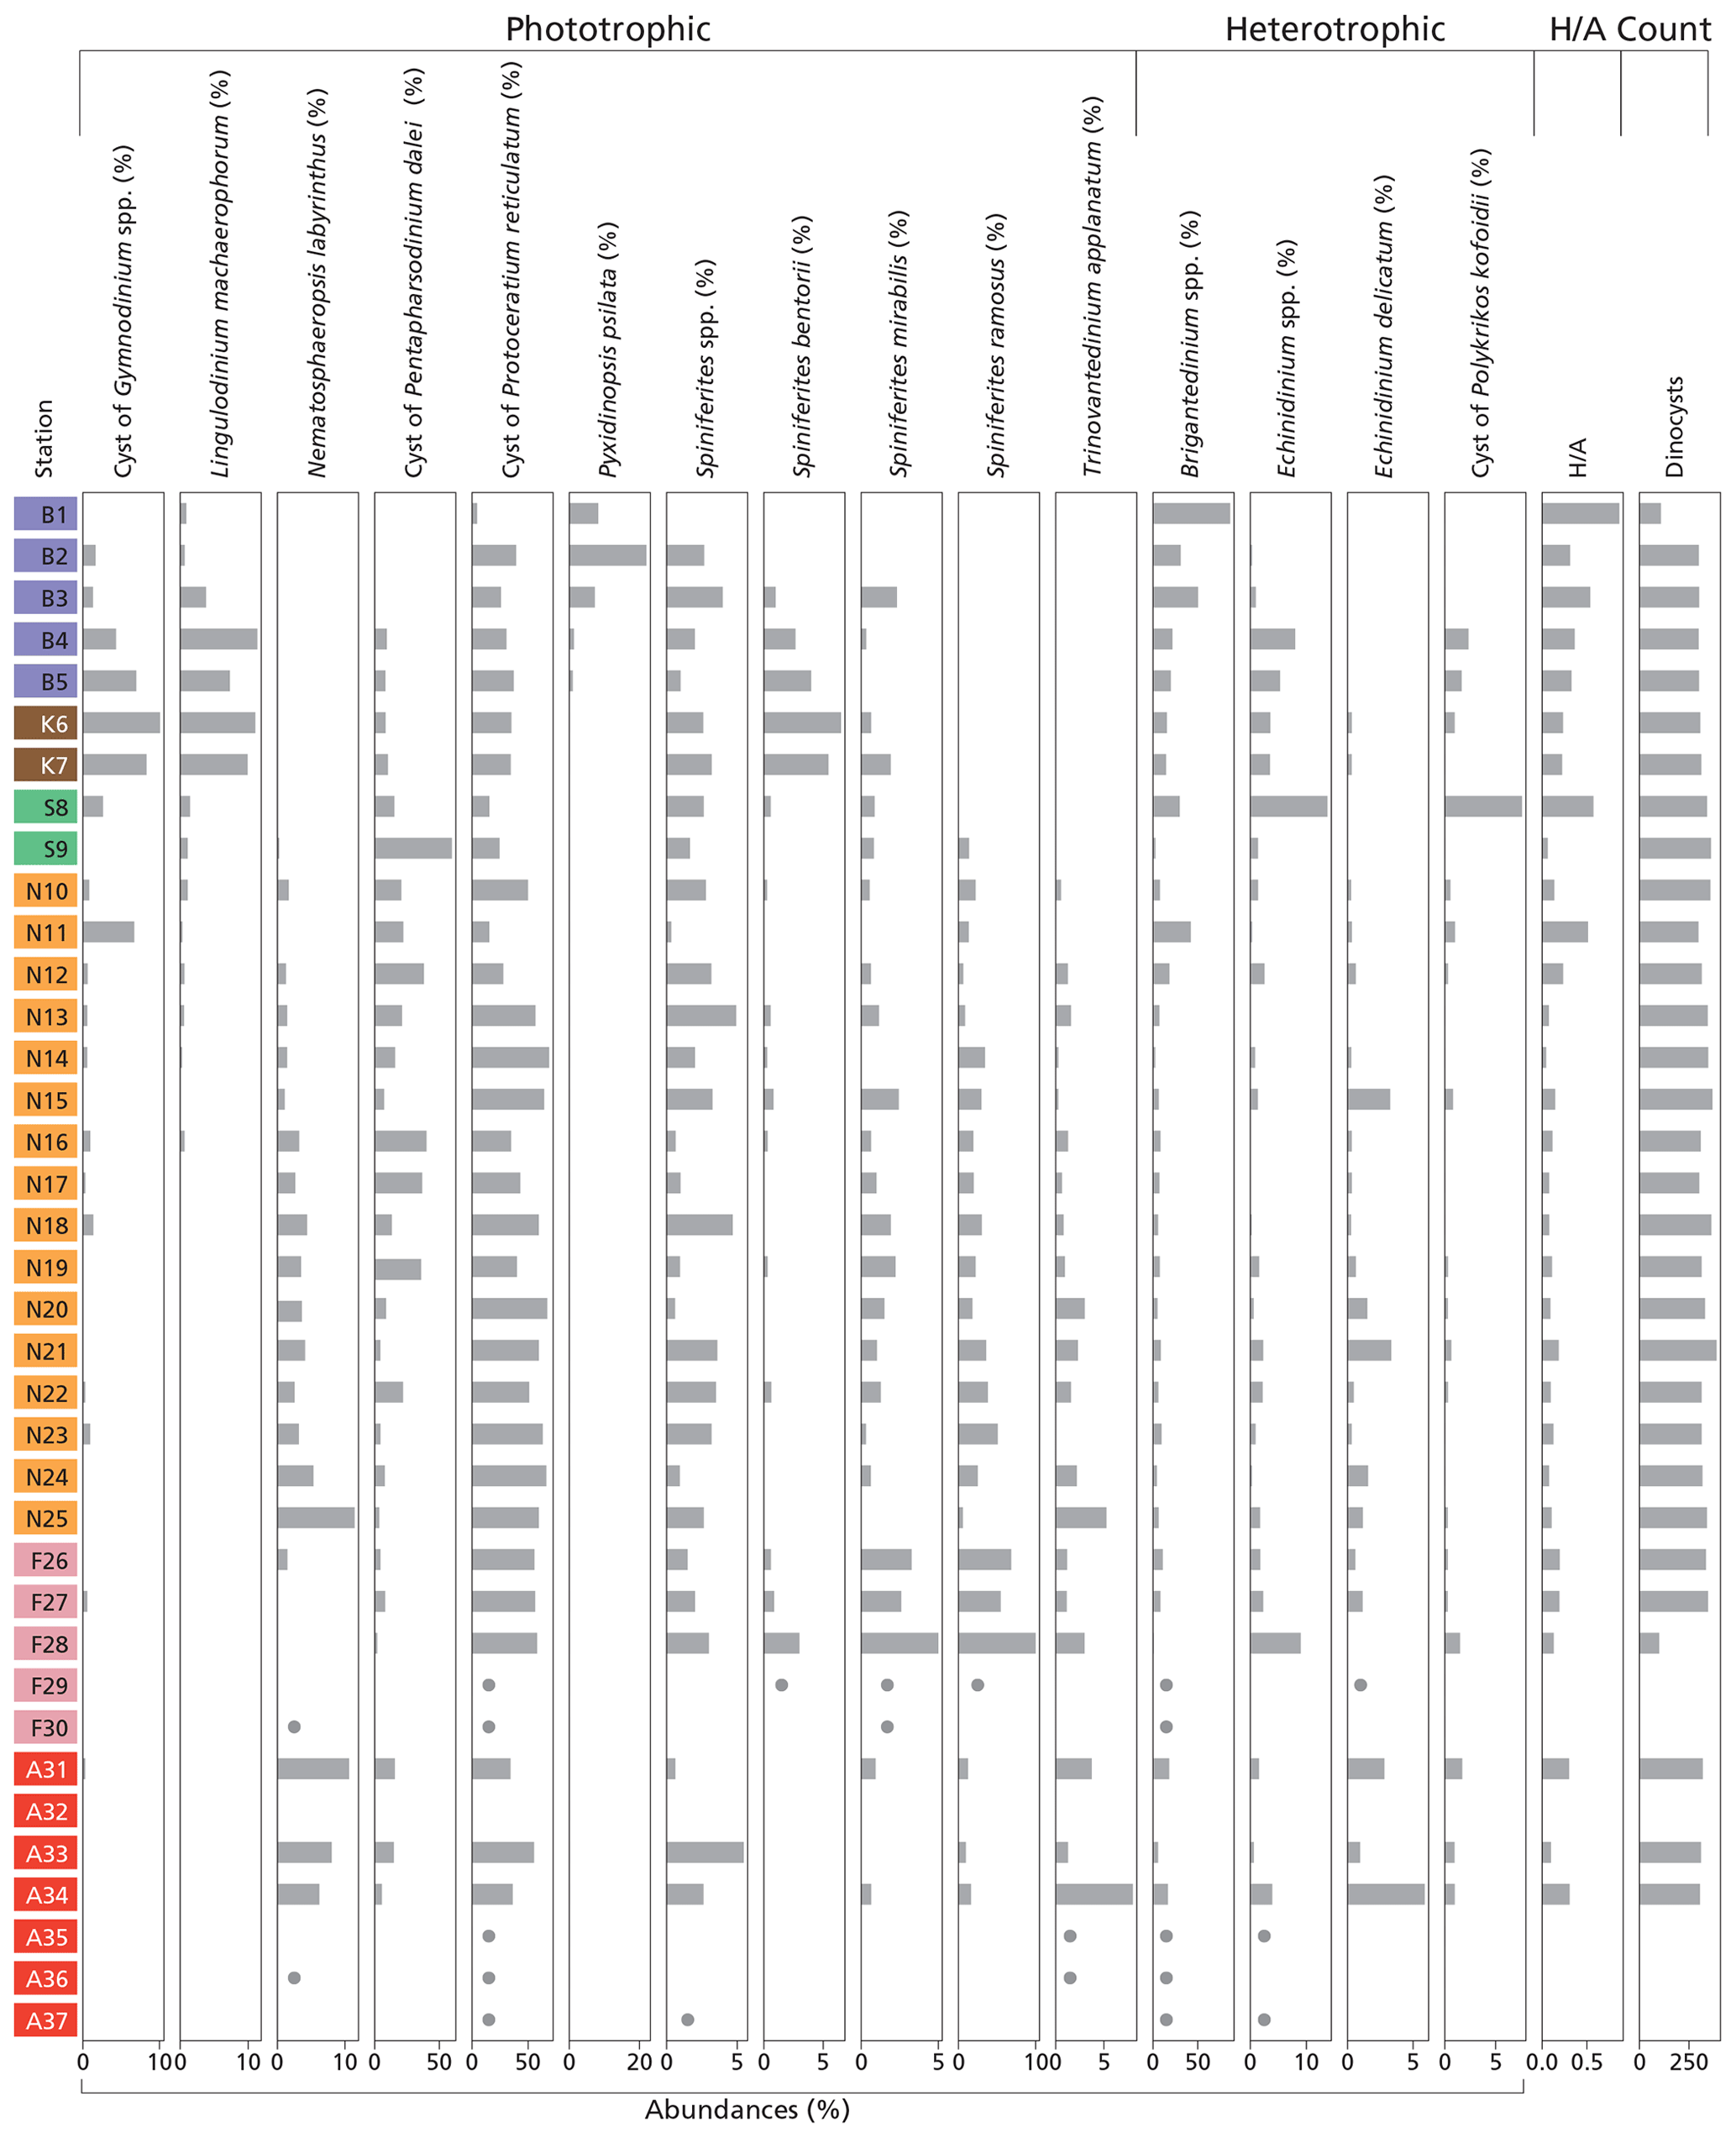
Figure 4Histogram of dinoflagellate cyst groups that exceed 5 % of total dinocyst species abundance at at least one station, along with the ratio and total dinocyst (counts). For samples that are nearly barren in palynomorphs, dots indicate species that were observed but in quantities too low to calculate relative abundances. Station “B” is from the Baltic Sea, station “K” is from Kattegat, station “S” is from Skagerrak, station “N” is from the Norwegian Trench, station “F” is from Fladen Ground, and station “A” is from the Atlantic Ocean (Fig. 1).
3.2.1 Palynomorph groups
We classified seven palynomorph groups: bisaccate and non-bisaccate pollen, spores, freshwater algae, dinocysts, zooplankton remains, and “other” palynomorphs. In total, 26 pollen taxa, 4 spore taxa, 3 freshwater algae taxa, 35 dinocyst taxa, 7 zooplankton remain taxa, and 6 “other” taxa (e.g., including acritarchs and other undefined or yet undescribed taxa) have been found in the samples (Table S2). Figure 3 presents the palynomorph groups at each location. In general, dinocysts or bisaccate and non-bisaccate pollen dominate the total palynomorph assemblage. Pollen dominates coastal and marginal basins, with the highest percentages in the Baltic Sea, Kattegat, and Skagerrak (14.1 %–71.7 %). Spores and freshwater algae are most abundant in the Skagerrak (4.1 %–12.0 %). Dinocyst and zoomorph remain relative abundances are the highest in the Atlantic Ocean, Fladen Ground, and the Norwegian Trench (56.2 %–92.1 %). In contrast, the Baltic Sea shows the lowest percentages (8.5 %–32.3 %). Zoomorph remains such as tintinnid remains, foraminiferal linings, copepod eggs, and ciliate taxa Halodinium verrucatum (Gurdebeke et al., 2018) are most abundant on the Fladen Ground, whereas ciliate taxa Radiosperma corbiferum (Gurdebeke et al., 2023) dominate in the Baltic Sea. “Other” palynomorphs are generally high in the Baltic Sea (5.4 %–77.2 %).
Due to the low BWO and high TOC at the inner Baltic Sea stations (B1–3; Fig. 2f) and the exceptionally high abundance of “other” palynomorphs (i.e., palynomorph type x, y, and z), these stations were excluded from statistical analyses comparing palynomorph assemblages with environmental variables (Fig. S3). The relative abundance of bisaccate and non-bisaccate pollen in the total palynomorph assemblage correlates highly significantly to NPP, Si, δ13Corg, SSS, DTS, and ΔT, while dinocysts correlate negatively to NPP, and zoomorph remains correlate negatively to TOC and positively to MGS.
3.2.2 Dinocyst assemblages
We identified 35 dinocyst taxa across all locations (Table 1). The distribution of major taxa (abundance >5 %) reveals distinct regional patterns (Fig. 4). In general, assemblages are dominated by phototrophic taxa, particularly cysts of Pentapharsodinium dalei and Protoceratium reticulatum, which account for up to 84.6 % of the assemblage in the Norwegian Trench (station N14). In contrast, heterotrophic taxa become dominant in nearshore environments and in the Baltic Sea, where Brigantedinium spp. accounts for up to 86.2 % of the assemblage at station B1. Furthermore, the inner Baltic Sea (stations B1–3) is characterized by Pyxidinopsis psilata, a species found exclusively in these samples. Assemblages from Kattegat and Skagerrak show high abundances of Echinidinium spp., cysts of Gymnodinium spp., Lingulodinium machaerophorum, cysts of Polykrikos kofoidii, and Spiniferites bentorii, while on the Fladen Ground, Spiniferites mirabilis and Spiniferites ramosus are highly present. Further north in the Norwegian Trench and Atlantic Ocean, Nematosphaeropsis labyrinthus becomes more abundant (Fig. 4).
Table 2Marginal CCA results for individual environmental parameters. For each parameter, the table reports the first constrained eigenvalue (λ, a measure of how much variation that parameter explains) and its permutation p value (based on 999 random permutations of the species data). Each parameter was tested in two CCA runs: one excluding the inner Baltic Sea stations B1–3 (−BS) and one including all assemblages (+BS). Parameters are ordered from highest to lowest λ in the −BS analysis. Bold values indicate parameters with the highest λ, and italic values denote when there is a p value of > 0.05 (not statistically significant).
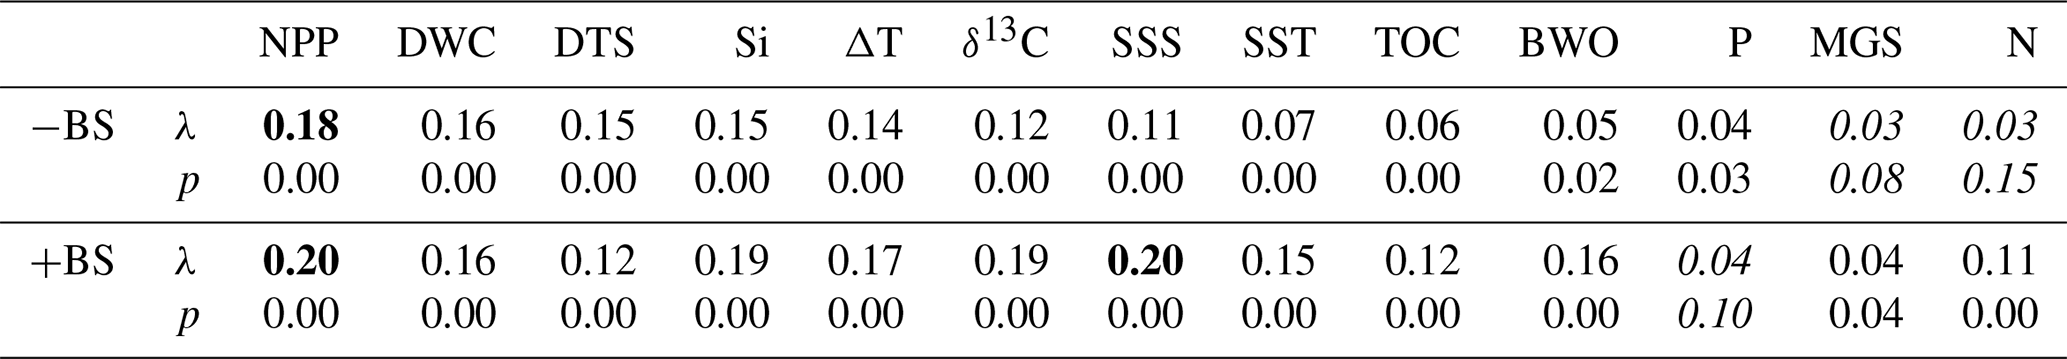
We performed a CCA considering all dinocysts in the assemblages (Fig. S4a), and a zoomed-in view is provided in Fig. S4b to show a clearer species–sample relationship. Figure S4a shows that the inner Baltic Sea samples (B1–3) exert a disproportionate influence on the ordination, possibly due to preservation effects related to low BWO as these sample show a strong negative loading with BWO and the unique presence of Pyxidinopsis psilata. This confounding effect, known to influence palynological composition in low-BWO environments (e.g., Reichart and Brinkhuis, 2003; Zonneveld et al., 2007), is reflected in a high eigenvalue (Table 2, +BS). In this full dataset, SSS and NPP have the highest eigenvalues among the environmental variables. To better resolve the environmental drivers across the shelf and open ocean, the three inner Baltic Sea samples were excluded from the final analysis presented in Fig. 5. This CCA reveals that geographically close stations also plot near each other in ordination space, except for the Skagerrak stations, which differ markedly in terms of depositional environment, as reflected by their large difference in terms of water column depth (44–550 m). The first axis, explaining 52.5 % of the canonical variance, clearly separates near-shore (negative scores) from offshore (positive scores) environments. DWC, DTS, δ13Corg, SSS, and BWO load positively on the first axis, while NPP, Si, and ΔT load negatively. The second CCA component explains only 13.3 % of the variance. Excluding the inner Baltic stations reduces the influence of SSS in the ordination (along with SST, N, TOC, and BWO), and NPP becomes the environmental variable with the highest eigenvalue in the marginal CCA (Table 2, −BS). Given that the dominant parameter explaining the dinocyst variability is NPP, we applied MAT to predict NPP. The relationship between the observed NPP and estimated NPP is linear (r = 0.92, p<0.05).
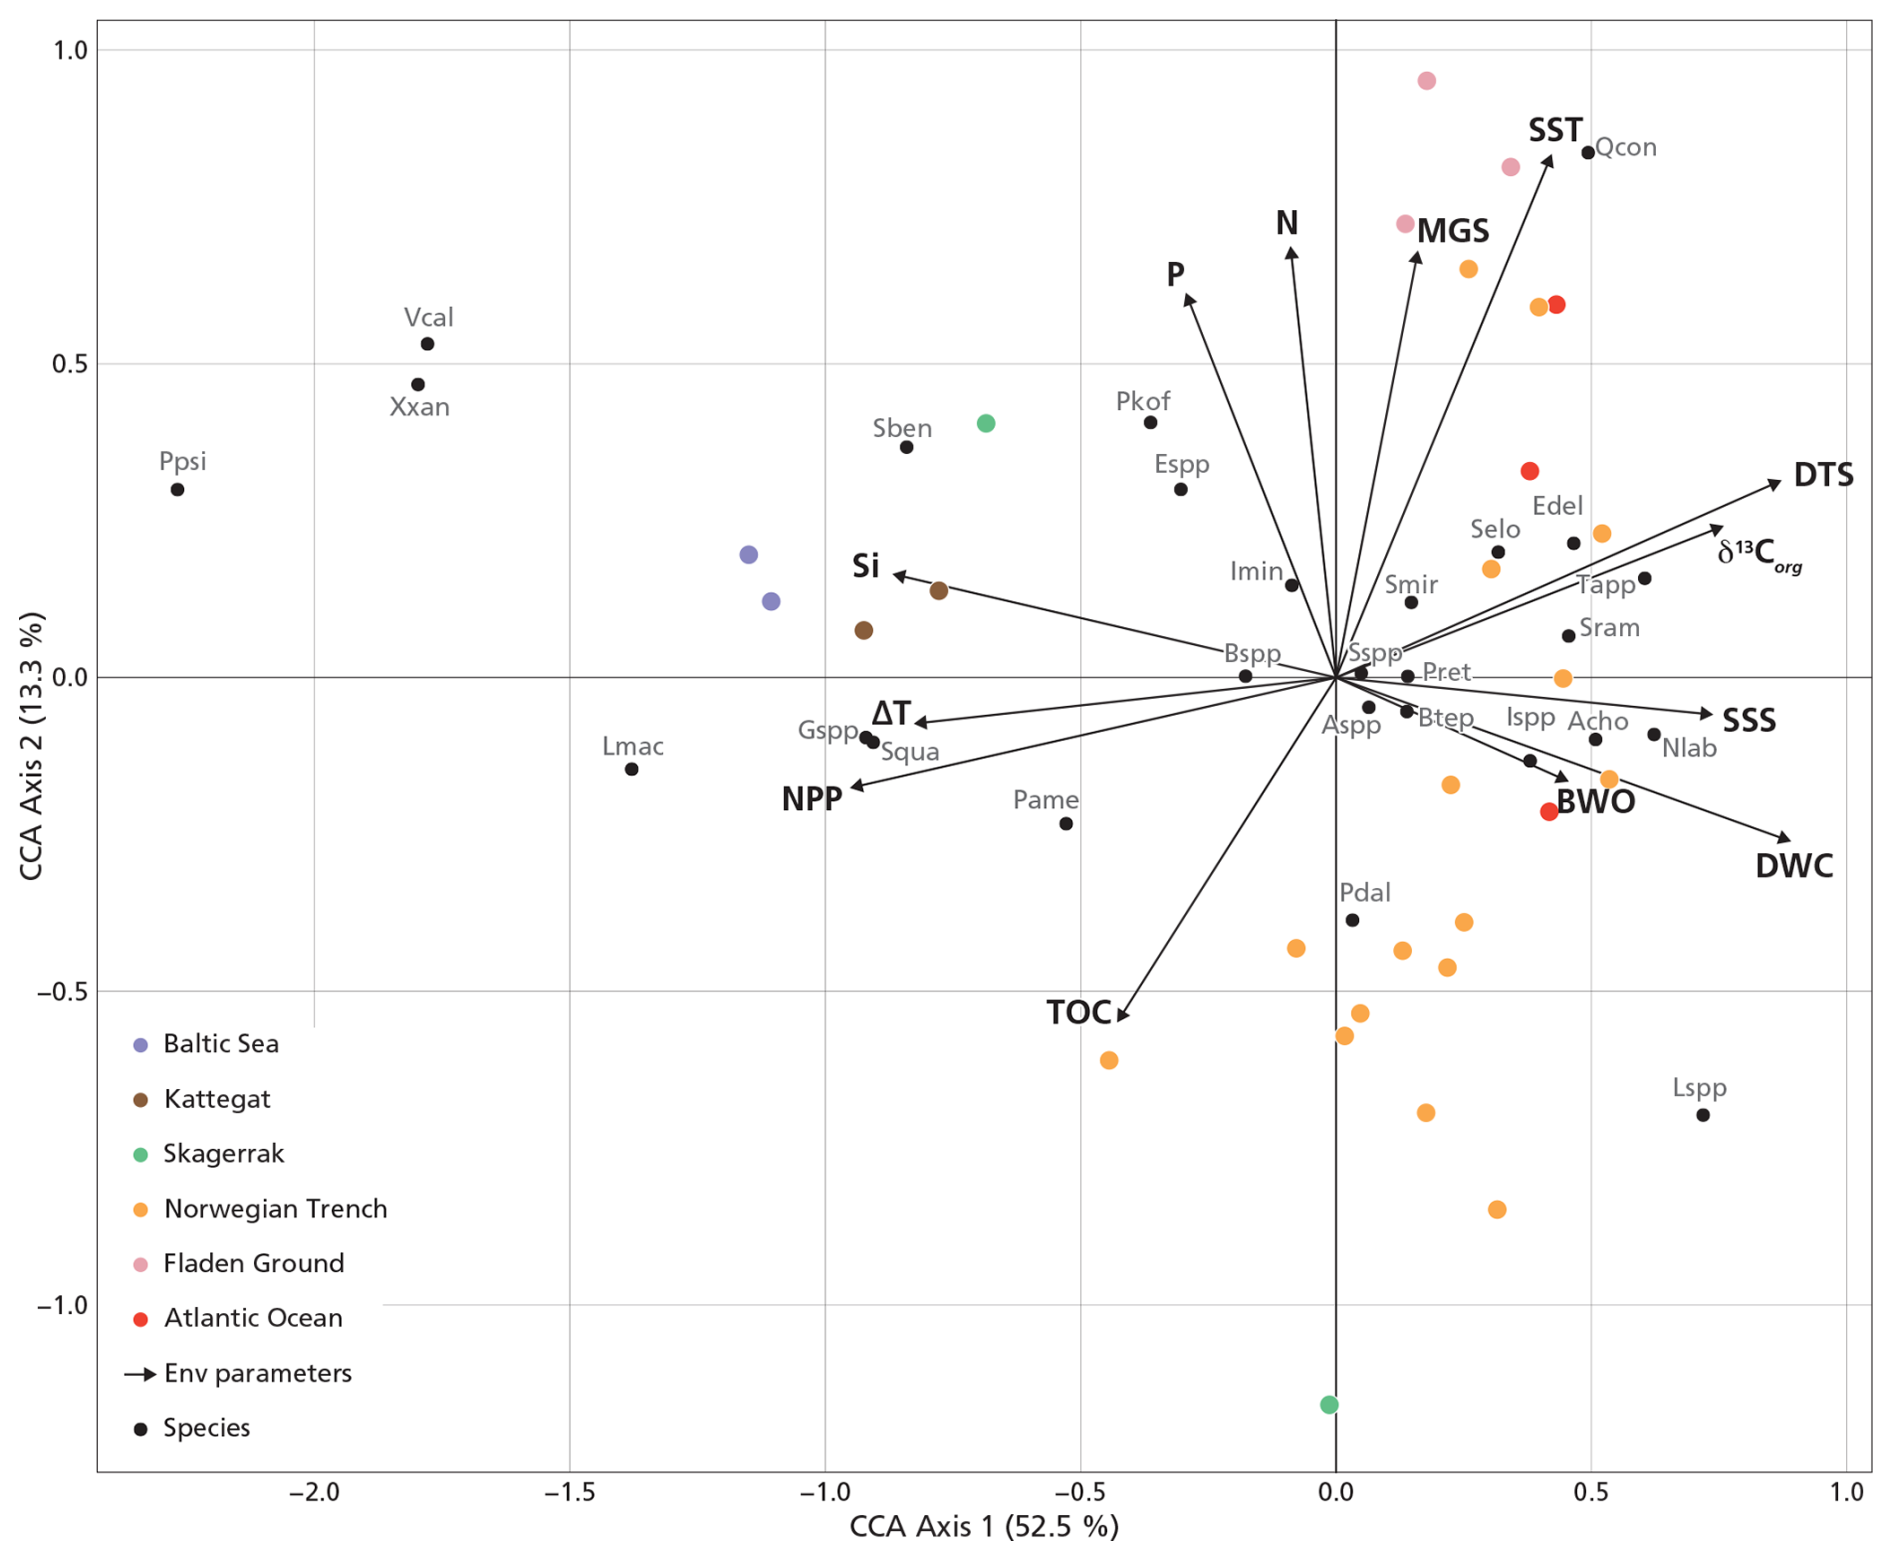
Figure 5The CCA without the inner Baltic Sea stations (B1–3). Abbreviations of dinocyst species are listed in Table 1. The explained variance (%) for each axis is shown in brackets in the axis titles.
Species-specific abundances reveal strong and statistically significant correlations ( and p≤0.05) with key environmental variables (Fig. 6). DWC shows the strongest linear correlation with Nematosphaeropsis labyrinthus (r=0.74). Moreover, NPP shows strong linear correlations with Lingulodinium machaerophorum (r=0.92), the cyst of Gymnodinium spp. (r=0.81), the cyst of Protoperidinium americanum (r=0.76), and Spiniferites bentorii (r=0.74). All of these species also strongly correlate with Si (r=0.61–0.97). Furthermore, the cyst of Protoperidinium americanum shows a strong negative correlation with DTS (.71) and, similarly to Lingulodinium machaerophorum (.74), shows a strong negative correlation with SSS (.71).
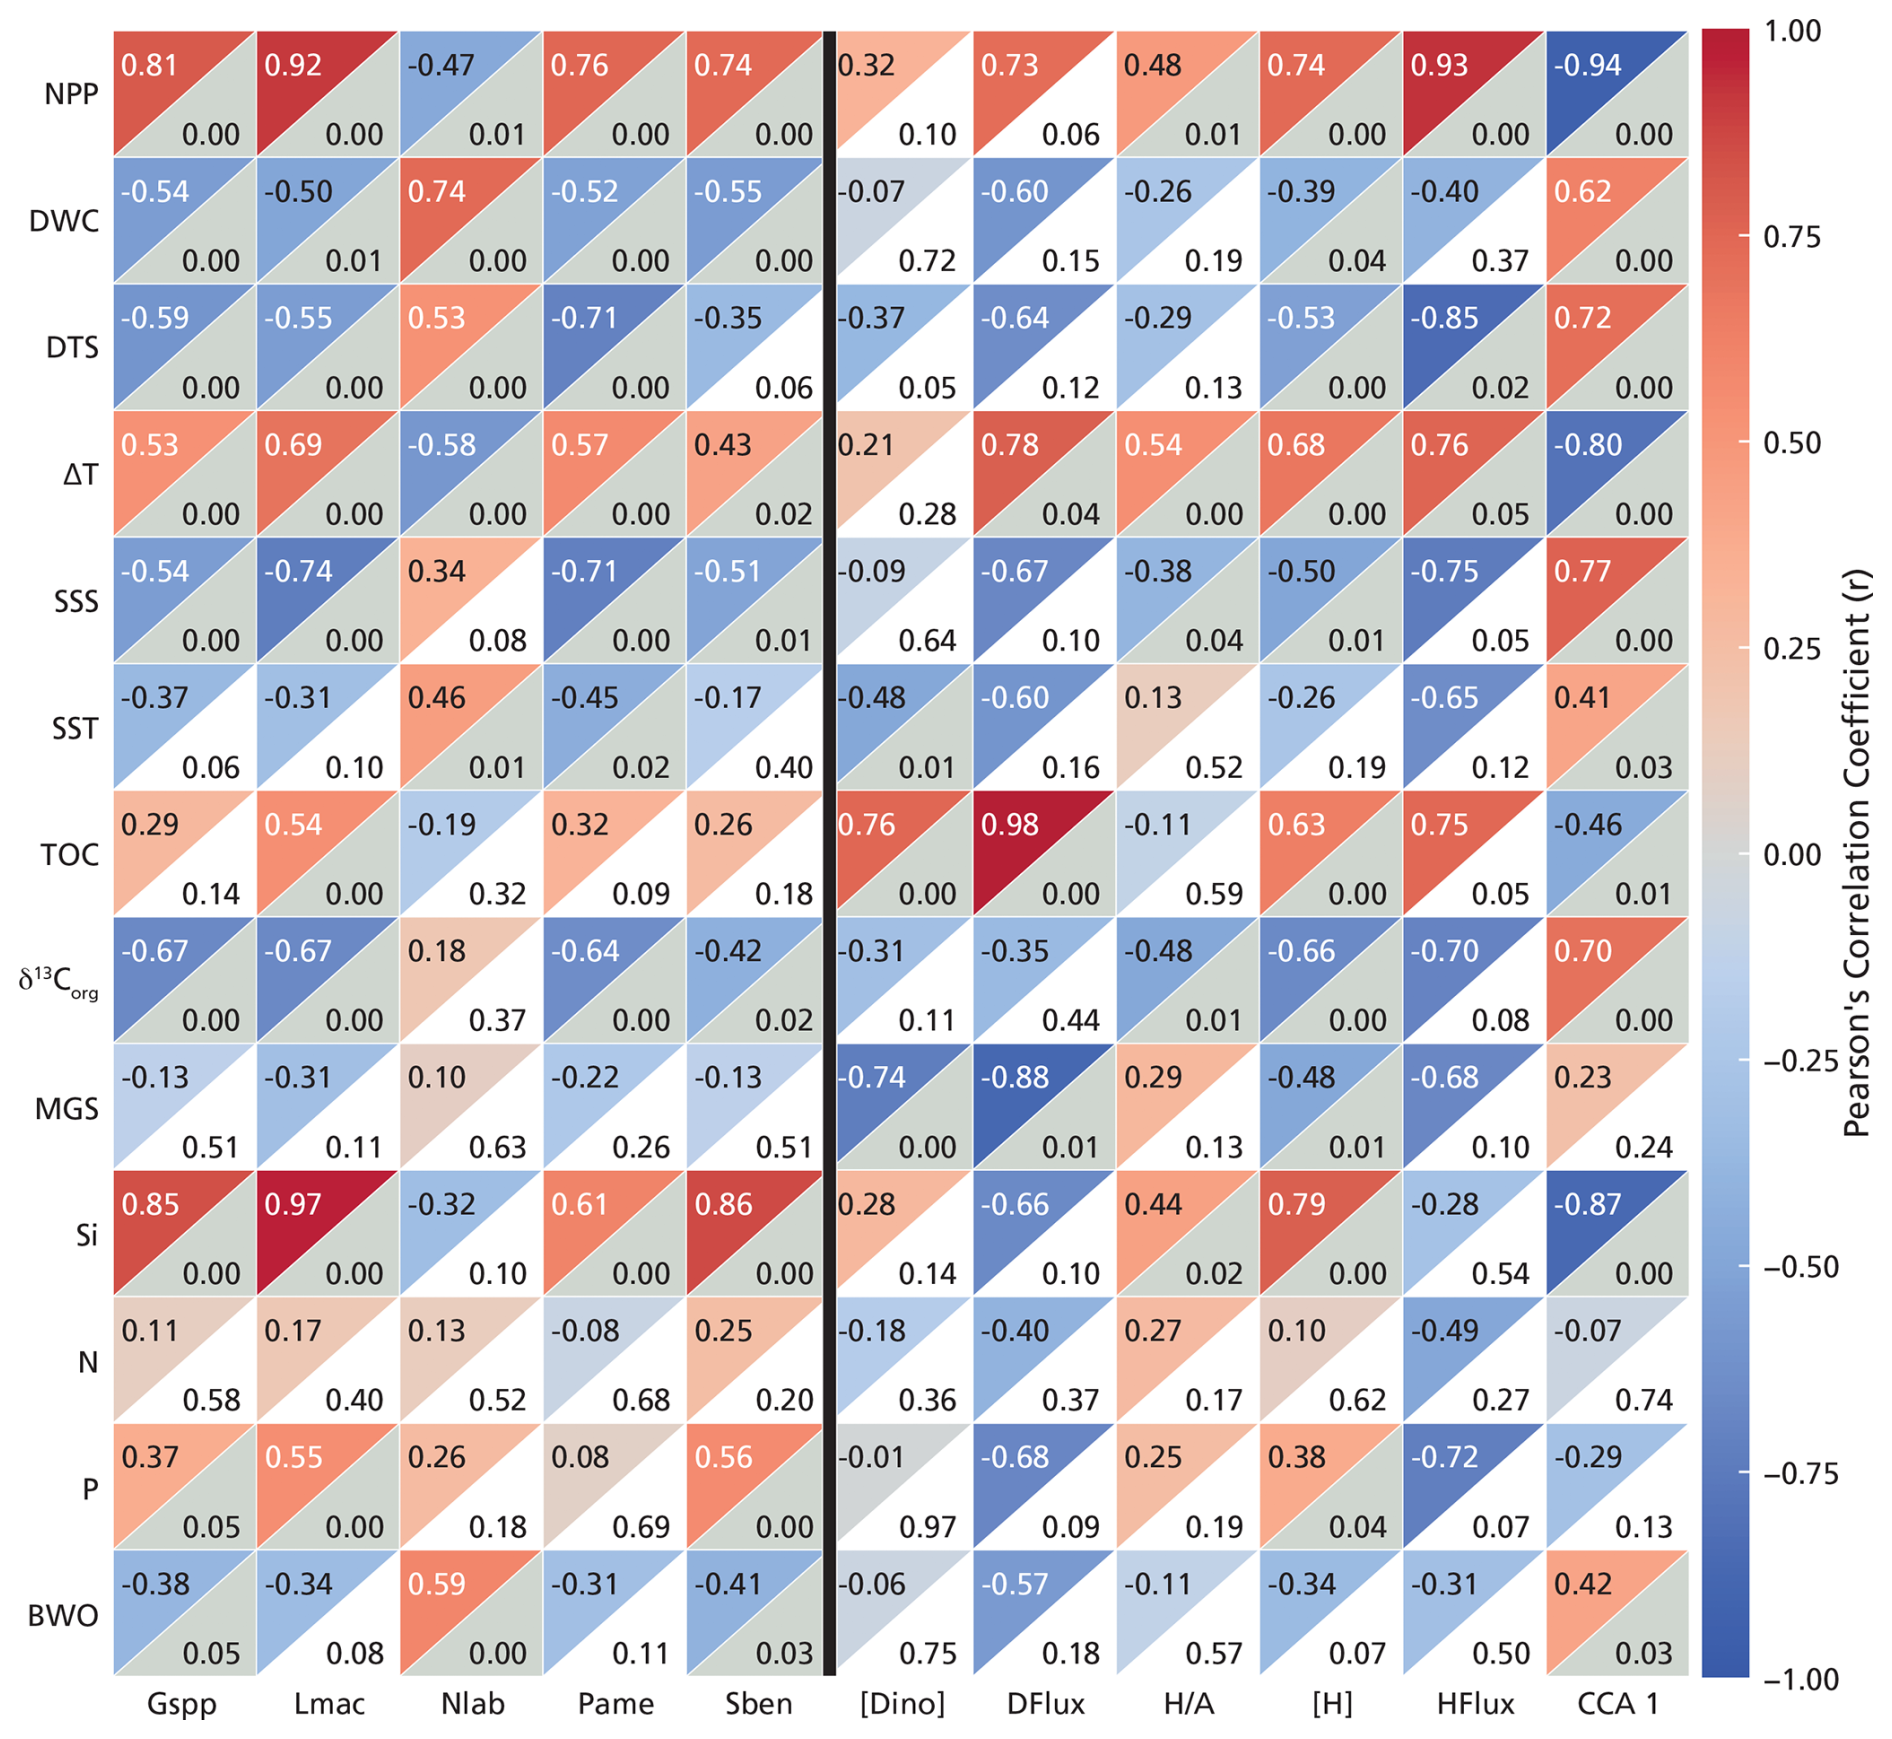
Figure 6Correlation matrix between dinocyst species (x axis, left side of the black line) and dinocyst-based proxies (x axis, right side of the black line) and environmental parameters (y axis) without the inner Baltic Sea stations (B1–3). Species selection (relative abundance) criterion: and p<0.05. In each square, the top-left corner shows the r values (Pearson's correlation coefficients based on color scale), and the bottom-right corner shows the p values, in gray when below 0.05 and white when above 0.05. Abbreviations for the dinocyst species are listed in Table 1. “[Dino]” stands for total dinocyst concentration, “DFlux” stands for total dinocyst flux, “” for the heterotrophic/phototrophic ratio, “[H]” stands for heterotrophic dinocyst concentration, and “HFlux” stands for heterotrophic dinocyst flux. “CCA1” is the scores of the stations from the first CCA axis presented in Fig. 5.
3.3 Towards the development of dinocyst-based proxies for primary productivity
To evaluate the potential of dinocysts as proxies for primary productivity, we correlate several commonly used proxies (i.e., concentration and flux of total dinocysts, ratio, concentration and flux of heterotrophic dinocysts; e.g., Reichart and Brinkhuis, 2003; Sangiorgi and Donders, 2004; Radi et al., 2007; Radi and de Vernal, 2008; Zonneveld et al., 2009; Kim et al., 2012; Zwiep et al., 2018) to the water column and sediment properties in Fig. 6. Moreover, the CCA scores of the stations along the first axis (CCA1) are extracted to assess their correlation with environmental variables.
Total dinocyst concentration shows a strong positive correlation with TOC (r=0.74), and total dinocyst flux correlates positively with both TOC (r=0.98) and ΔT (r=0.78). The ratio does not show a strong correlation with any of the parameters in our study area. Heterotrophic dinocyst concentration is strongly positively correlated with NPP (r=0.74) and Si (r=0.79). Similarly, heterotrophic dinocyst flux shows strong positive correlations with NPP (r=0.93) and ΔT (r=0.76) and strong negative correlations with DTS (). CCA1 exhibits the strongest correlation with NPP (). This confirms that the primary ecological gradient captured by the dinocyst assemblages is strongly driven by productivity, with high-NPP, near-shore conditions plotting negatively and low-NPP, offshore conditions plotting positively on CCA1 (Fig. 5).
4.1 Temporal control
One of the most important yet challenging assumptions involving surface sediment studies and calibration of proxies with modern environmental parameters is whether surface sediments truly reflect modern depositional conditions. Our 234Th analyses show that 24 of the 28 core-top samples contain freshly deposited material (Fig. S2). Four samples showed no detectable 234Th activity, indicating deposition older than ∼ 24 d. Two of these four coarse-grained sediments denoted a high-energy depositional environment and were (almost) barren of palynomorphs due to enhanced degradation under oxic conditions. The (near-)absence of 234Th activity in these regions further supports sediment winnowing (Goldberg, 1954), a known process on continental shelves (Nittrouer and Wright, 1994). The remaining two samples where 234Th activity was absent, as well as the Baltic samples for which 234Th was not measured, are, however, assumed to have captured modern deposition as they were collected with a multi-corer sampling technique, retrieving the water sediment interface. The 234Th activity, observed to be highest in coastal environments (Fig. S2a), suggests active particle scavenging and rapid burial of organic matter within ∼ 24 d (see the review by Cochran and Masqué, 2003) (Fig. S2b). Sedimentation rates of 0.02–0.2 cm yr−1 (Table S3) further indicate that the top first centimeter of sediment represents 5 years in the Norwegian Trench to 50 years of deposition in the North Atlantic. For this reason, the selected time intervals of the water column data (SST, SSS, nutrients, BWO) are appropriate, and the NPP time range used is constrained by satellite data availability.
4.2 Organic matter origin and preservation
The origin and preservation of organic matter in the study area can be constrained by δ13Corg and environmental parameters including SSS, DTS, and BWO. The negative correlation between terrestrial palynomorphs (bisaccate and non-bisaccate pollen) and DTS and SSS (Fig. S3) suggests that pollen are more abundant nearshore, reflecting river and/or fjord runoff as the dominant transport pathway of terrestrial material in this region (Heusser, 1998). Moreover, their strong negative correlation with δ13Corg (Table S3) supports the fact that terrestrial material typically exhibits more negative δ13Corg values (∼ −26 ‰) than marine phytoplankton-derived matter (∼ −19 ‰) (Meyers, 1994). Hence, the δ13Corg values can be used to distinguish the relative contribution of terrestrial and marine organic carbon. TOC shows an inverse trend with δ13Corg (Fig. 2d), indicating that the terrestrial organic carbon component is substantial, particularly in the Baltic Sea. This implies that TOC along the transect cannot be used as a tracer for marine organic carbon input in this area and, consequently, for NPP (Fig. 2g) as there is a large overprint of terrestrial organic material.
Palynomorphs are part of the organic component of sediments, and, therefore, preservation of organic matter may affect palynomorph distribution and, hence, dinocyst-based proxies (Versteegh and Zonneveld, 2002; Zonneveld et al., 2007, 2008). Preservation is typically driven primarily through BWO concentrations (Fig. 2f) and sedimentation rates in such sedimentary systems (e.g., Schoepfer et al., 2015). The deeper parts of the southern Baltic Sea are seasonally anoxic, whereas the Gotland Deep is permanently anoxic (Bergman Sjöstrand et al., 2025). At the Gotland Deep (B3), exceptionally high proportions of what we define here as “other” palynomorphs (Fig. 3) are found, likely reflecting enhanced preservation of organic microfossils. Moreover, under low-oxygen conditions, preferential dinocyst preservation can lead to a relative increase in oxygen-sensitive heterotrophic dinocysts (e.g., Versteegh and Zonneveld, 2002; Zonneveld et al., 2007; Gray et al., 2017) compared to phototrophic ones. The assemblages in the inner Baltic Sea (B1–3), where heterotrophic dinocyst relative abundances are high even when concentrations are relatively low (Fig. 4), means that these samples may be affected by preservation biases. The marginal CCA results (Table 2) confirm this interpretation. After removing these inner Baltic stations, the eigenvalues of δ13Corg, SSS, and BWO decrease substantially, indicating that those three stations are the most affected by organic matter preservation and specific ecological niches due to low-salinity waters.
4.3 Dinocysts as proxies for primary productivity
To reconstruct marine primary productivity, we aim to identify which dinocyst taxa or dinocyst-based proxies show positive relationships with NPP in this setting. Different proxies are being used in the paleoceanographic studies to reconstruct NPP, including a ratio-based proxy (), concentration-based proxies (total and heterotrophic dinocysts), and flux-based proxies (total and heterotrophic dinocysts) (e.g., Reichart and Brinkhuis, 2003; Sangiorgi and Donders, 2004; Radi et al., 2007; Radi and de Vernal, 2008; Zonneveld et al., 2009; Kim et al., 2012; Zwiep et al., 2018).
4.3.1 Species-specific indicators
The ecological interpretation of species' CCA1 scores reflects their distribution along the productivity gradient, the dominant control on the CCA1 axis (Fig. 5). Species with strongly negative scores are typical of eutrophic, coastal, or upwelling systems. For instance, the cyst of Gymnodinium spp., Lingulodinium machaerophorum, Selenopemphix quanta, Spiniferites bentorii, Xandarodinium xanthum, Votadinium calvum, and the cyst of Protoperidinium americanum are consistently found in stratified, high-productivity environments such as river mouths and fjord systems (Dale et al., 1999; Zonneveld et al., 2013; Lambert et al., 2022). Lingulodinium machaerophorum and the cyst of Protoperidinium americanum are strongly negatively correlated with SSS and δ13Corg (Fig. 6), which indicates that their abundance is related to the presence of freshwater and related nutrients. Other taxa such as Brigantedinium spp., Echinidinium spp., and the cyst of Polykrikos kofoidii similarly reflect nutrient-rich productive coastal conditions (Radi and Vernal, 2008; Zonneveld et al., 2013; Fig. 5).
In contrast, species with high positive CCA1 scores are characteristic of oligotrophic, open-shelf, or deep-ocean environments (Fig. 5). Impagidinium spp. and Ataxiodinium choane prefer low-nutrient waters (Zonneveld et al., 2013). Interestingly, in the literature, Nematosphaeropsis labyrinthus is associated with mesotrophic to oligotrophic oceanic conditions in the cold, deep-ocean environments of the North Atlantic and Nordic seas (de Vernal and Marret, 2007), associated with (winter) deep convection (Wu et al., 2025). Indeed, we find a strong positive correlation of Nematosphaeropsis labyrinthus with DWC and a significant but lower correlation with DTS (Fig. 6). Our data thus confirm the well-known oceanic character of this species (Wu et al., 2025). In our dataset, Nematosphaeropsis labyrinthus can likely be used as a tracer of high-salinity Atlantic water mass influence in the Norwegian Trench.
Other published datasets include samples from locations near to our study area (Grøsfjeld and Harland, 2001; Sildever et al., 2015; de Vernal et al., 2020). While some of the species that, in our dataset, correlate with NPP (cysts of Gymnodinium spp. and Protoperidinium americanum) are not reported in these other datasets, the dominant species (Brigantedinium spp., the cyst of Pentapharsodinium dalei, the cyst of Protoceratium reticulatum, and Nematosphaeropsis labyrinthus) occur in comparable percentages.
4.3.2 Total dinocyst concentration and flux
High dinocyst concentrations and fluxes have been linked to nutrient-rich conditions and NPP, especially in estuarine and upwelling systems (e.g., Radi et al., 2007; Dale, 2009). The total dinocyst abundances observed in this study are, on average, lower than those reported from surface sediments in nearby fjords (Grøsfjeld and Harland, 2001) yet are comparable to values documented earlier from the Kattegat and Baltic Sea (e.g., Sildever et al., 2015). Total dinocyst concentration and flux correlate positively with NPP, but these relations are not significant (Figs. 6, and7a). While elevated NPP typically coincides with enhanced dinoflagellate populations, resulting in higher dinocyst fluxes to the seafloor (Zonneveld et al., 2009; Ellegaard et al., 2017), the variability in total dinocyst concentration (526 to 70 936 cysts g−1) among stations with similar NPP implies that other environmental parameters (and differences in sediment accumulation rates) must affect this relationship. In our dataset, dinocyst concentrations covary with TOC (R2=0.57, p<0.05; Fig. 7b), a pattern largely driven by preservation (Fig. 2f). Elevated dinocyst concentrations in relatively low-NPP regions suggest the presence of localized “hotspots” of (phototrophic) dinocyst deposition, which might be related to specific conditions or episodic bloom events (e.g., cysts of Protoceratium reticulatum) (Zonneveld et al., 2007; Penaud et al., 2018). These hotspots are particularly evident in the southern Norwegian Trench, Skagerrak, and Kattegat, where seasonal stratification reduces vertical mixing and can support short but highly productive blooms (Zonneveld et al., 2009; Price and Pospelova, 2011; Snoeijs-Leijonmalm et al., 2017). Such short-lived blooms which contribute only little to NPP but result in high fluxes of phototrophic dinocysts may explain why total dinocyst concentrations and flux do not correlate with NPP (p>0.05; Fig. 6). In the sedimentary system, dinocysts behave as fine silt particles, and, thus, finer organic-rich material is related to higher dinocysts abundances. This effect is due to the large surface area of fine particles, which promotes the sorption of organic matter and protects it from degradation (Hedges and Keil, 1995). Calculating total dinocyst flux improves the relationships with both NPP (R2=0.72, p>0.05; Fig. 6) and TOC (R2=0.97, p<0.05; Fig. 7c) as this compensates for differences in sedimentation rates. Note that sedimentation rates are not available for all stations (Table S3), making it more difficult to statistically evaluate these relationships.
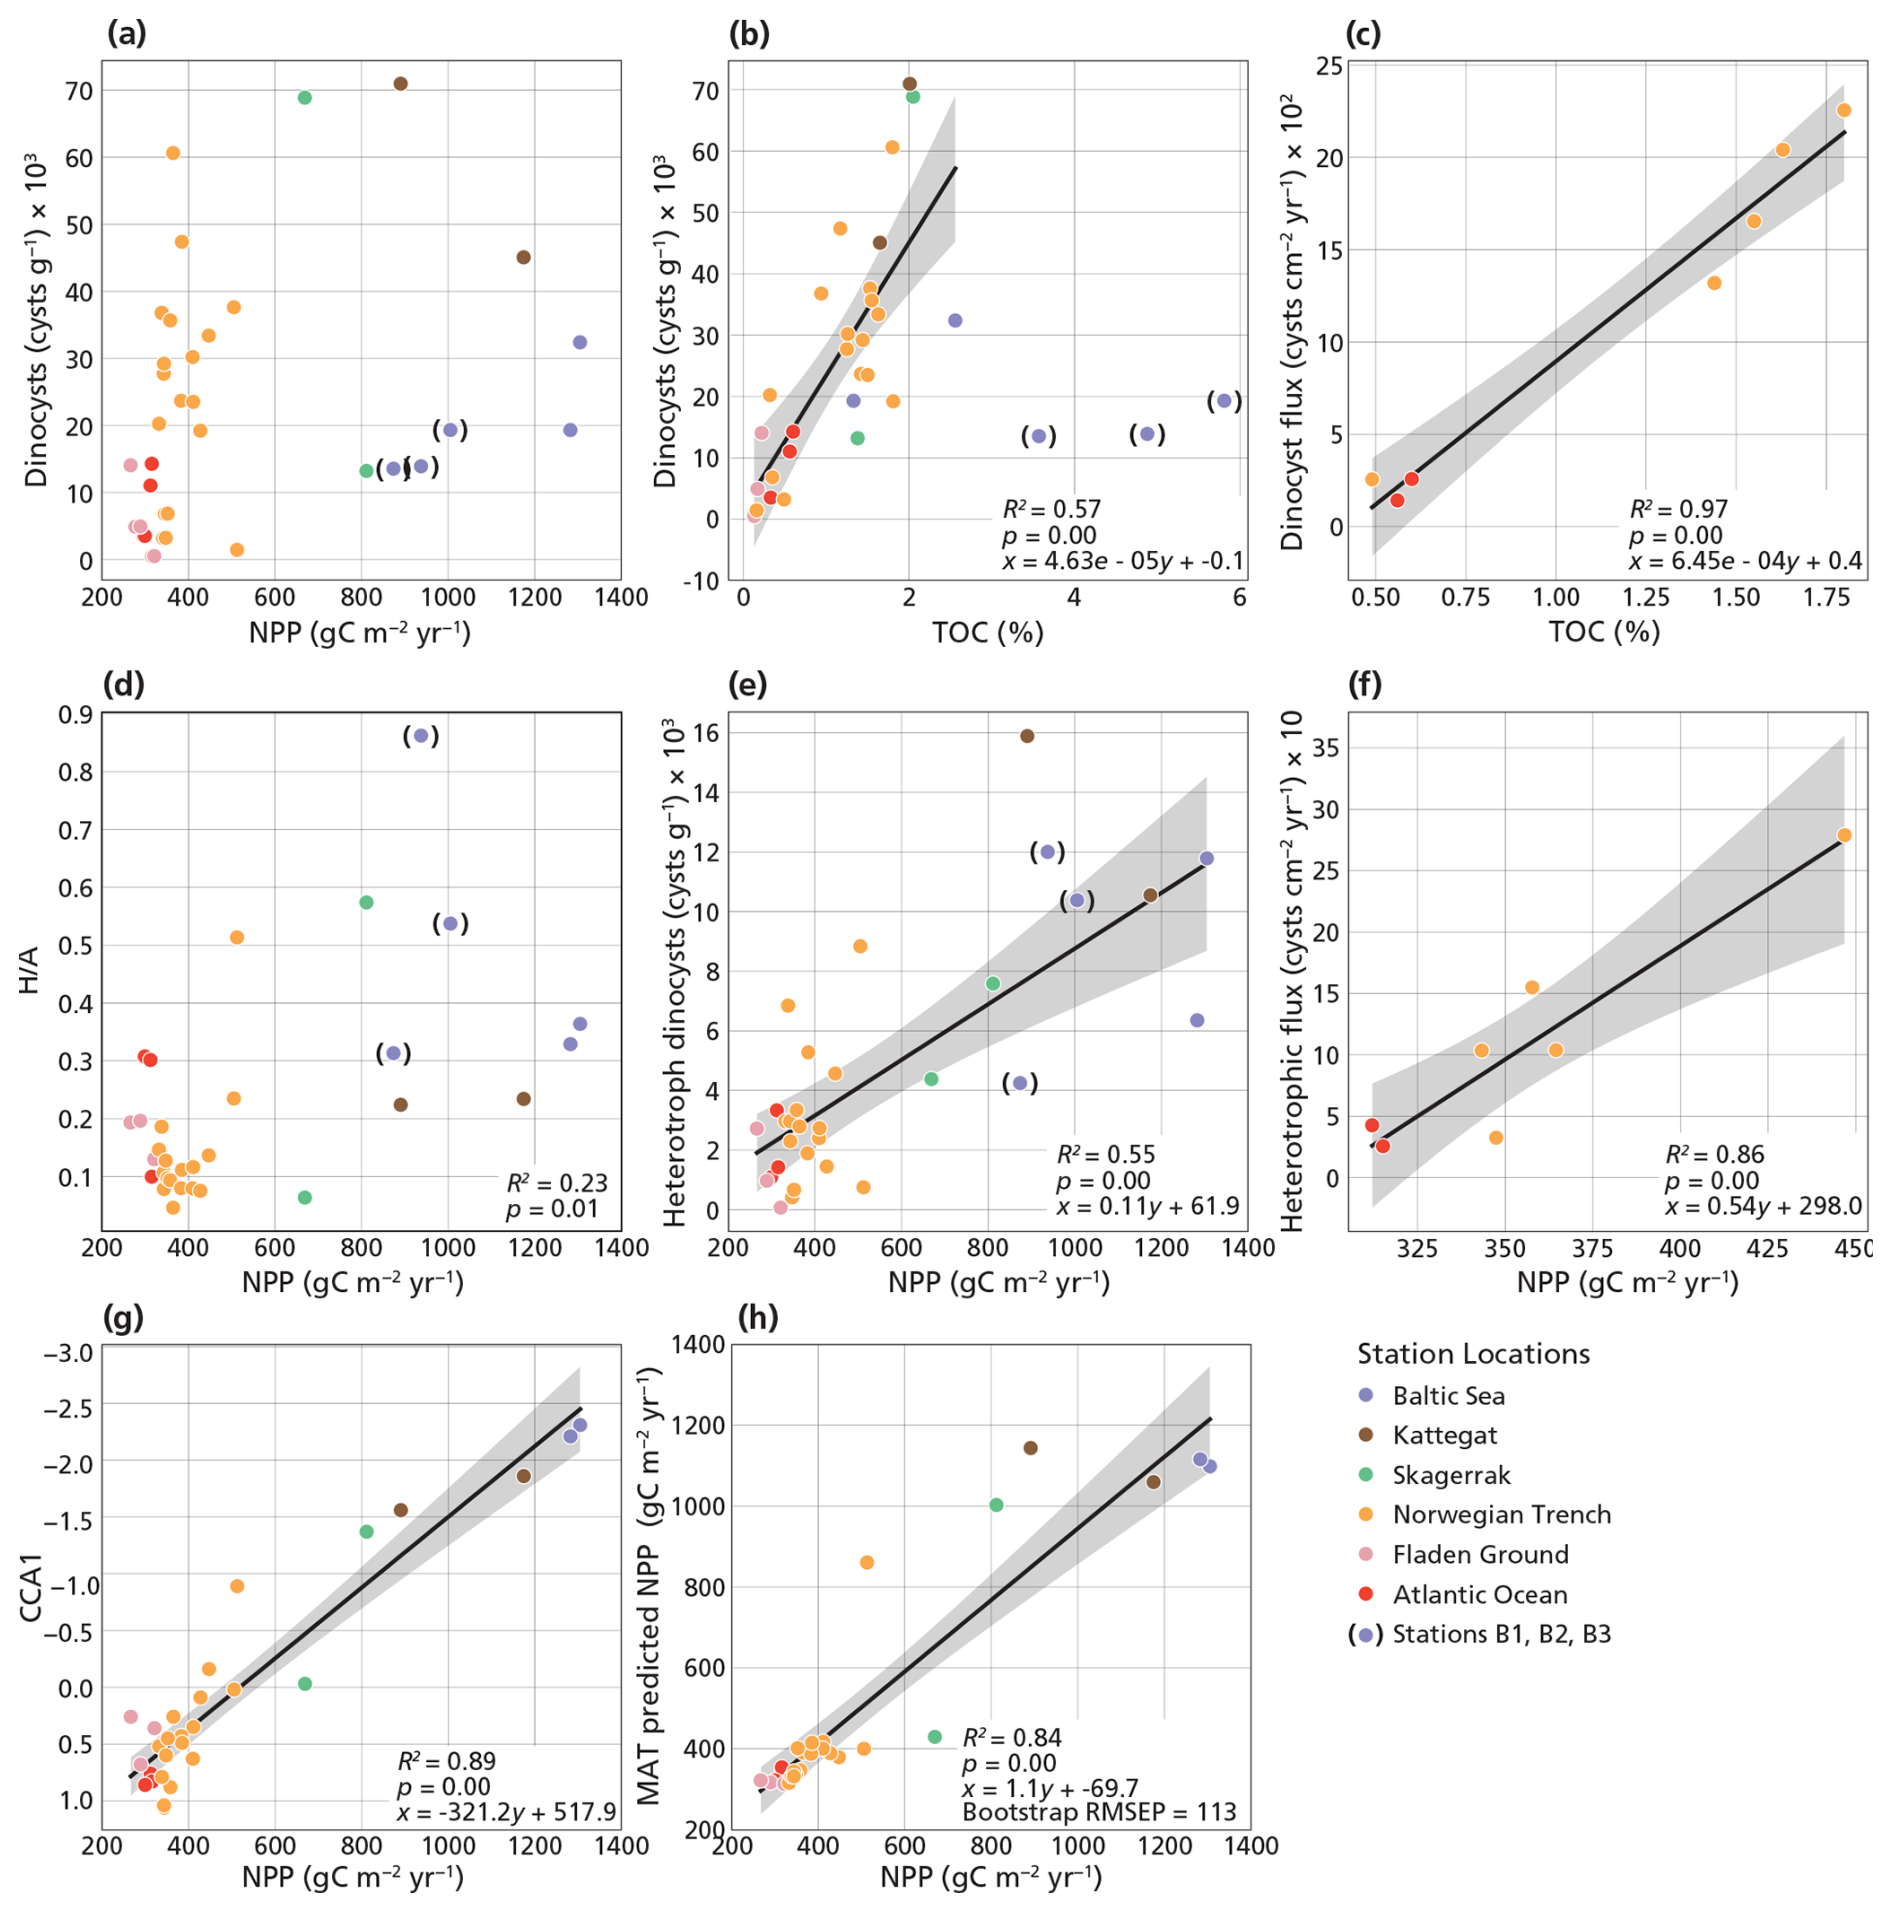
Figure 7Proxy relationships with NPP. NPP is compared to the concentration of total dinocysts (a), ratio (d), concentration of heterotrophic dinocysts (e), heterotrophic dinocyst flux (f), CCA1 station scores (g), MAT predicted NPP values (h). TOC is compared to the concentration of total dinocysts (b) and total dinocyst flux (c). Stations B1–3 are excluded from the linear regression in panels (b), (c), (e), (f), (g), and (h). For proxies with R2≥0.5, a 95 % confidence interval is shown around the regression line (gray).
4.3.3 ratio
The ratio is regularly used to distinguish between eutrophic and oligotrophic conditions as heterotrophic dinocysts are known to be abundant in eutrophic conditions, while phototrophic dinocysts tend to prevail in mesotrophic and oligotrophic conditions (e.g., Pospelova et al., 2008; Zonneveld et al., 2013). However, here, the ratio shows only a relatively weak positive correlation with NPP (R2=0.23, p<0.05; Fig. 7d).
The ratio shows limited use in this region as a proxy for NPP due to the dominant influence of phototrophic species, such as Lingulodinium machaerophorum, the cyst of Gymnodinium spp., and Spiniferites bentorii, on productivity signals, as evidenced by their strong correlations with NPP (Fig. 6). Whereas in other settings this ratio may be used to reconstruct productivity (e.g., Sangiorgi and Donders, 2004; Pospelova et al., 2008), the many confounding factors in the region studied here limit applicability. This relative measure of can be masked if both heterotrophs and phototrophs increase simultaneously; therefore, focusing on only the heterotrophic dinocysts may be a better way to reconstruct NPP.
4.3.4 Heterotrophic dinocyst concentration and flux
While individual heterotrophic species, such as the cyst of Protoperidinium americanum, can be used to indicate NPP (strong positive correlation; Fig. 6), their restricted spatial distribution limits their utility across the entire transect (Table 1). Consequently, we combined them with the other heterotrophic dinocyst to form a heterotrophic dinocyst group and to investigate whether this proxy can be applicable in the Baltic Sea to the Atlantic Ocean transect. Both heterotrophic dinocyst concentration (R2=0.55, p<0.05; Fig. 7e) and flux (R2=0.86, p<0.05; Fig. 7f) show a strong relationship with NPP. The relationship between heterotrophic dinocyst concentration and NPP is also valid when considering the inner Baltic Sea stations (B1–3) (Fig. 7e); however, we excluded these stations as the preservation bias may be too high.
Heterotrophic species feed on organic carbon, much of which is produced by primary producers that are linked to chlorophyll a. Heterotrophic dinocyst relative abundance and concentration correlate strongly with Si (Fig. 6). Since diatom blooms rely on Si availability and because the heterotrophic assemblage in our study is dominated by Brigantedinium spp., a known diatom predator (Jacobson and Anderson, 1986), this further supports a trophic connection (Devillers and de Vernal, 2000; Radi and de Vernal, 2008; Price and Pospelova, 2011; Kim et al., 2012; Bringué et al., 2013; Wang et al., 2022). However, Si does not correlate with N and P, indicating different sources and/or uptake. The ratios of nutrients in river water often differ from oceanic averages (Redfield, 1934; Rahm et al., 1996). Depending on the uptake by primary producers and recycling, these ratios change from river and fjord systems to the open ocean. Water column Si correlates strongly to non-bisaccate pollen in the sediment, suggesting that both are transported by rivers (Fig. S3). Si also correlates strongly to phototrophs, such as the cyst of Gymnodinium spp., Lingulodinium machaerophorum, and Spiniferites bentorii (Fig. 6), phototrophic and mixotrophic species that have been linked before to coastal and more nutrient-rich settings (Zonneveld et al., 2013). Given that sedimentation rates vary across sites, flux is the preferred proxy as it better accounts for differences in sediment accumulation and provides a more direct representation of dinocyst production.
4.3.5 CCA1 scores and MAT
The CCA of the dinocyst assemblages allows for the deconvolving of the separate individual environmental factors controlling the dinocyst assemblages. Because each species resulted in a fixed CCA score along axis 1, the sample's CCA1 score is based on a weighted average of the species abundance.
The scores, together, show a strong inverse relationship with NPP (R2=0.89, p<0.05; Fig. 7g). Hence, we propose a new regional transfer function based on the CCA1 scores as a proxy for NPP. From the correlation with NPP, we derive the following regression:
This two-step approach enables quantitative reconstruction of NPP from dinocyst assemblages and provides a valuable tool for estimating productivity in the region. Previous studies have performed similar multivariate analyses in other regions (Radi et al., 2007; Pospelova et al., 2008), highlighting NPP as a key environmental factor. While NPP is the controlling factor in several dinocyst assemblage datasets, the species most strongly related to the NPP may differ among regions. This underscores the necessity of developing a region-specific calibration.
In addition to the CCA performed on our dataset, we applied a CCA to a combined dataset consisting of our dataset and dinocyst assemblages previously published by Sildever et al. (2015) and de Vernal et al. (2020) from nearby locations using water column parameters (i.e., SST, SSS, N, P, Si, and NPP). The correlation between the resulting CCA1 scores and NPP remains strong considering all datasets (R2=0.71, p<0.05; Fig. S6a). Hence, NPP remains a dominant controlling factor on dinocyst assemblages. Alternatively, MAT can be used to estimate NPP based on both our modern dataset and the other datasets of Sildever et al. (2015) and de Vernal et al. (2020). For our dataset alone, MAT-derived NPP estimates show a strong correlation with observed NPP values (R2=0.84, p<0.05; Fig. 7h), comparable to the performance of the CCA1 approach (Fig. 7g). When datasets from Sildever et al. (2015) and de Vernal et al. (2020) are included, the strength of the correlation decreases (R2=0.53, p<0.05; Fig. S6b) yet remains significant. This suggests that the unimodal model underpinning CCA is better suited for predicting NPP in independent samples such as fossil assemblages used in paleo-environmental reconstructions. The bootstrap validation yields RMSEP values of 113 gC m−2 yr−1 (based on our dataset alone) and 117 gC m−2 yr−1 (including other datasets) for the MAT reconstructions, corresponding to an uncertainty of approximately 11 % relative to the maximum observed NPP range. This uncertainty is comparable to previously reported values (Radi and de Vernal, 2008). The difference between the results of our study alone (Fig. 7h–g) and the results that include previously published data from the region (Fig. S6a–b) is mainly due to 25 sediments located in fjords or shallow coastal areas included in de Vernal et al. (2020). In these settings, restricted circulation, freshwater input, and complex nutrient dynamics likely play an important role in (seasonal) primary productivity that is not fully captured by modern analogues (Grøsfjeld and Harland, 2001).
This study establishes a regional understanding of the fingerprint of NPP on the dinocyst assemblages across the Northwest European Shelf, from the Baltic Sea through the Norwegian Trench to the Atlantic Ocean. Our dataset, characterized by the consistent dominance of Brigantedinium spp. and the cysts of Pentapharsodinium dalei and Protoceratium reticulatum, successfully distinguishes between two primary oceanographic states: river-fed, stratified, high-productivity conditions and the more oceanic, well-mixed, low-productivity state. Assemblage shifts can be interpreted based on established species–environment relationships: a high level of Nematosphaeropsis labyrinthus indicates stronger Atlantic inflow and a deeper water column, whereas Lingulodinium machaerophorum, the cyst of Gymnodinium spp., the cyst of Protoperidinium americanum, and/or Spiniferites bentorii point to more seasonal stratified, Si-rich coastal conditions and higher NPP.
We establish regional relationships between NPP and well-known dinocyst-based productivity proxies and conclude that our data show that a selection of dinocyst-based proxies can be applied to sediment cores to reconstruct temporal shifts in NPP in this region. Applying these proxies downcore will translate fossil assemblage data into a record of changing productivity and hydrographic conditions through time. Total cyst concentrations do not show a direct correlation with NPP but instead correlate strongly with TOC, reflecting the influence of preservation rather than production. Similarly, total dinocyst fluxes correlate with NPP but correlate even more strongly with TOC, indicating that both production and preservation processes contribute to the sedimentary signal. The ratio gives a weak positive correlation with NPP. The most reliable proxies in this region are heterotrophic dinocyst concentration and flux and the multivariate transfer function derived from CCA axis-1 scores (Eq. 2). Moreover, we test the predictive power of our dataset on NPP estimates to predict productivity using MAT. The MAT results show good agreement between observed and estimated NPP values, with a bootstrapped uncertainty of approximately 11 %. The comparison to other regional datasets indicates that our dataset captures a sufficiently broad range of environmental conditions to support the use of both the CCA1-based transfer function and MAT for downcore reconstructions of relative to semi-quantitative NPP in this region, but our results suggest that unimodal approaches (CCA-based) perform best for independent reconstructions. A key finding in our regional dataset is that the inner Baltic Sea requires a separate proxy calibration to reconstruct NPP because of preservation biases in low-oxygen conditions.
Datasets for this paper can be found at https://doi.org/10.5281/zenodo.15837224 (Hilgen et al., 2026).
The cores and surface samples from RV Pelagia cruise 64PE410 in 2016, cruise 64PE517 in 2023, and cruise 64PE534 in 2024 are stored at NIOZ, Texel. The corresponding microscope slides from the surface sediments are stored at the LPP collection, Utrecht University.
The supplement related to this article is available online at https://doi.org/10.5194/jm-45-275-2026-supplement.
The research was designed by FS. The sediment and palynological data were generated by CSH with help from FS for the dinocysts and THD for the pollen. THD contributed to the statistical analyses. All of the authors helped with the data interpretation. CSH wrote the article. RH, MTJM, THD, GR, and FS reviewed and edited the article.
At least one of the (co-)authors is a member of the editorial board of the Journal of Micropalaeontology. The peer-review process was guided by an independent editor, and the authors also have no other competing interests to declare.
Publisher's note: Copernicus Publications remains neutral with regard to jurisdictional claims made in the text, published maps, institutional affiliations, or any other geographical representation in this paper. The authors bear the ultimate responsibility for providing appropriate place names. Views expressed in the text are those of the authors and do not necessarily reflect the views of the publisher.
We thank the entire North Sea-Atlantic Exchange (NoSE) project team who were aboard RV Pelagia cruises 64PE517 and 64PE534. Special thanks are given to Femke van Zanten for assisting the core sampling team during the second cruise. We also thank the crew and research team aboard RV Pelagia cruise 64PE410 for obtaining and providing the surface samples of the collected multi-cores. The lab technicians at NIOZ Texel (Wim Boer, Jeroen Kooijman, Ronald van Bommel, Jort Ossebaar) are thanked for their support with the radioisotope measurements, core opening and storage, and bulk organic matter analyses. We also acknowledge the lab technicians at Utrecht University (Giovanni Dammers, Natasja Welters, Jan van Tongeren) for their help in preparing microscope slides and conducting radioisotope measurements. Additionally, we thank Henko de Stigter for his guidance with the 210Pb profiles and Jan-Berend Stuut for his help with the grain size measurements. We thank the editor, Luke Mander, and the reviewers, Fabienne Marret-Davies and one anonymous reviewer, for their comments and feedback, which improved the paper.
This research has been supported by the Dutch Research Council (grant no. OCENW.XL21.XL21.075).
This paper was edited by Luke Mander and reviewed by Fabienne Marret-Davies and one anonymous referee.
Bauer, J. E., Cai, W. J., Raymond, P. A., Bianchi, T. S., Hopkinson, C. S., and Regnier, P. A.: The changing carbon cycle of the coastal ocean, Nature, 504, 61–70, https://doi.org/10.1038/nature12857, 2013.
Behrenfeld, M. J. and Falkowski, P. G.: Photosynthetic rates derived from satellite-based chlorophyll concentration, Limnology and Oceanography, 42, 1–20, https://doi.org/10.4319/lo.1997.42.1.0001, 1997.
Benninghoff, W. S.: Calculation of pollen and spore density in sediments by addition of exotic pollen in known quantities, Pollen et Spores, 4, 332–333, 1962.
Bergman Sjöstrand, D., Hansson, M., and Kronsell, J.: Cruise report from R/V Svea week 10–11, 2025, Swedish Meteorological and Hydrological Institute, https://www.smhi.se/en/publications-from-smhi/publications/2025-06-24-cruise-report-from-r-v-svea-week-10-11-2025 (last access: 25 July 2025), 2025.
Bozec, Y., Thomas, H., Elkalay, K., and de Baar, H. J.: The continental shelf pump for CO2 in the North Sea – evidence from summer observation, Marine Chemistry, 93, 131–147, https://doi.org/10.1016/j.marchem.2004.07.006, 2005.
Bringué, M., Pospelova, V., and Pak, D.: Seasonal production of organic-walled dinoflagellate cysts in an upwelling system: a sediment trap study from the Santa Barbara Basin, California, Marine Micropaleontology, 100, 34–51, https://doi.org/10.1016/j.marmicro.2013.03.007, 2013.
Carpenter, R., Peterson, M. L., and Bennett, J. T.: 210Pb-derived sediment accumulation and mixing rates for the Washington continental slope, Marine Geology, 48, 135–164, https://doi.org/10.1016/0025-3227(82)90183-0, 1982.
Carstensen, J., Andersen, J. H., Gustafsson, B. G., and Conley, D. J.: Deoxygenation of the Baltic Sea during the last century, Proceedings of the National Academy of Sciences, 111, 5628–5633, https://doi.org/10.1073/pnas.1323156111, 2014.
Christensen, K. H., Sperrevik, A. K., and Broström, G.: On the variability in the onset of the Norwegian Coastal Current, Journal of Physical Oceanography, 48, 723–738, https://doi.org/10.1175/JPO-D-17-0117.1, 2018.
Cochran, J. K. and Masqué, P.: Short-lived U/Th series radionuclides in the ocean: tracers for scavenging rates, export fluxes and particle dynamics, Reviews in Mineralogy and geochemistry, 52, 461–492, https://doi.org/10.2113/0520461, 2003.
Dadey, K. A., Janecek, T., and Klaus, A.: Dry-bulk density: its use and determination, Proceedings of the Ocean Drilling Program, Scientific Results, 126, 37, https://doi.org/10.2973/odp.proc.sr.126.157.1992, 1992.
Dale, B.: Cyst formation, sedimentation, and preservation: factors affecting dinoflagellate assemblages in recent sediments from Trondheimsfjord, Norway, Review of Palaeobotany and Palynology, 22, 39–60, https://doi.org/10.1016/0034-6667(76)90010-5, 1976.
Dale, B.: Eutrophication signals in the sedimentary record of dinoflagellate cysts in coastal waters, Journal of Sea Research, 61, 103–113, https://doi.org/10.1016/j.seares.2008.06.007, 2009.
Dale, B., Thorsen, T. A., and Fjellsa, A.: Dinoflagellate cysts as indicators of cultural eutrophication in the Oslofjord, Norway, Estuarine, Coastal and Shelf Science, 48, 371–382, https://doi.org/10.1006/ecss.1999.0427, 1999.
de Vernal, A. and Marret, F.: Organic-walled dinoflagellate cysts: tracers of sea-surface conditions, in: Proxies in Late Cenozoic Paleoceanography, Developments in Marine Geology, vol. 1, edited by: Hillaire-Marcel, C. and de Vernal, A., Elsevier, Amsterdam, 371–408, https://doi.org/10.1016/S1572-5480(07)01014-7, 2007.
de Vernal, A., Radi, T., Zaragosi, S., Van Nieuwenhove, N., Rochon, A., Allan, E., De Schepper, S., Eynaud, F., Head, M. J., Limoges, A., Londeix, L., Marret, F., Matthiessen, J., Penaud, A., Pospelova, V., Price, A., and Richerol, T.: Distribution of common modern dinoflagellate cyst taxa in surface sediments of the Northern Hemisphere in relation to environmental parameters: the new n = 1968 database, Marine Micropaleontology, 159, 101796, https://doi.org/10.1016/j.marmicro.2019.101796, 2020.
Devillers, R. and de Vernal, A.: Distribution of dinoflagellate cysts in surface sediments of the northern North Atlantic in relation to nutrient content and productivity in surface waters, Marine Geology, 166, 103–124, https://doi.org/10.1016/S0025-3227(00)00007-4, 2000.
Ellegaard, M., Dale, B., Mertens, K. N., Pospelova, V., and Ribeiro, S.: Dinoflagellate cysts as proxies for Holocene environmental change in estuaries: diversity, abundance and morphology, Applications of Paleoenvironmental Techniques in Estuarine Studies, 295–312, https://doi.org/10.1007/978-94-024-0990-1_12, 2017.
E.U. Copernicus Marine Service: Global Ocean Physics Analysis and Forecast, Marine Data Store (MDS) [data set], https://doi.org/10.48670/moi-00016, last access: 28 May 2025.
Faegri, K., Kaland, P. E., and Krzywinski, K.: Textbook of pollen analysis, John Wiley and Sons Ltd., ISBN 0-471-92178-5, 1989.
Frigstad, H., Kaste, Ø., Deininger, A., Kvalsund, K., Christensen, G., Bellerby, R. G. J., Sørensen, K., Norli, M., and King, A. L.: Influence of riverine input on Norwegian coastal systems, Frontiers in Marine Science, 7, 332, https://doi.org/10.3389/fmars.2020.00332, 2020.
Furnes, G. K., Hackett, B., and Sætre, R.: Retroflection of Atlantic water in the Norwegian Trench, Deep Sea Research Part A. Oceanographic Research Papers, 33, 247–265, https://doi.org/10.1016/0198-0149(86)90121-4, 1986.
García-Moreiras, I., Amorim, A., Pospelova, V., Zonneveld, K., Anderson, D. M., Beedessee, G., Dale, A., Dale, B., David, O., de Vernal, A., Fatourou, E., Folie-Boivin, E., Helenes, J., García-Portela, M., Gu, F., Gu, H., Iratçabal, V., Janouškovec, J., Limoges, A., Marret, F., Meyvisch, P., Nkouefuth Nfongmo, Y., Pochic, V., Reguera, B., Sangiorgi, F., Roza, S. E. V., Van Nieuwenhove, N., Williams, R. W., Winifred, V., and Mertens, K. N.: Progress, challenges and future directions in marine organic-walled dinoflagellate cyst research: new insights from an international workshop, Mar. Micropaleontol., 201, 102502, htps://doi.org/10.1016/j.marmicro.2025.102502, 2025.
Goldberg, E. D.: Marine geochemistry 1. Chemical scavengers of the sea, The Journal of Geology, 62, 249–265, https://doi.org/10.1086/626161, 1954.
Gurdebeke, P. R., Mertens, K. N., Takano, Y., Yamaguchi, A., Bogus, K., Dunthorn, M., Matsuoka, K., Vrielink, H., and Louwye, S.: The affiliation of Hexasterias problematica and Halodinium verrucatum sp. nov. to ciliate cysts based on molecular phylogeny and cyst wall composition, European Journal of Protistology, 66, 115–135, https://doi.org/10.1016/j.ejop.2018.09.002, 2018.
Gurdebeke, P., Mertens, K. N., Lubomir, R., Meyvisch, P., Potvin, E., Yang, E. J., André, C., Pospelova, V., and Louwye, S.: Alphonse Meunier's enigmatic Radiosperma belongs to the ciliates, in: VLIZ Marine Science Day 2023, 90, 63–63, https://doi.org/10.48470/41, 2023.
Gray, D. D., Zonneveld, K. A., and Versteegh, G. J.: Species-specific sensitivity of dinoflagellate cysts to aerobic degradation: a five-year natural exposure experiment, Review of Palaeobotany and Palynology, 247, 175–187, https://doi.org/10.1016/j.revpalbo.2017.09.002, 2017.
Grøsfjeld, K. and Harland, R.: Distribution of modern dinoflagellate cysts from inshore areas along the coast of southern Norway, Journal of Quaternary Science: Published for the Quaternary Research Association, 16, 651–659, https://doi.org/10.1002/jqs.653, 2001.
Gu, H., Liu, T., and Mertens, K. N.: Cyst–theca relationship and phylogenetic positions of Protoperidinium (Peridiniales, Dinophyceae) species of the sections Conica and Tabulata , with description of Protoperidinium shanghaiense sp. nov., Phycologia, 54, 49–66, https://doi.org/10.2216/14-047.1, 2015.
Head, M. J. and Mantilla-Duran, F.: Atlanticodinium striaticonulum n. gen., n. sp., a widespread extant dinoflagellate cyst from the late Cenozoic, and its comparison with Atlanticodinium janduchenei (Head et al., 1989) n. comb., Marine Micropaleontology, 159, 101774, https://doi.org/10.1016/j.marmicro.2019.101774, 2020.
Hedges, J. I. and Keil, R. G.: Sedimentary organic matter preservation: an assessment and speculative synthesis, Marine Chemistry, 49, 81–115, https://doi.org/10.1016/0304-4203(95)00008-F, 1995.
Heusser, L.: Spores and pollen in the marine realm, Introduction to Marine Micropaleontology, 327–339, https://doi.org/10.1016/B978-044482672-5/50014-3, 1998.
Hickel, W., Mangelsdorf, P., and Berg, J.: The human impact in the German Bight: eutrophication during three decades (1962–1991), Helgoländer Meeresuntersuchungen, 47, 243–263, https://doi.org/10.1007/BF02367167, 1993.
Hilgen, C. S., Hennekam, R., van der Meer, M. T. J., Donders, T. H., Reichart, G. J., and Sangiorgi, F.: Palynomorph and dinocyst assemblages, water column and sediment properties, and dinocyst-based proxies along the Baltic Sea-North Sea-Atlantic transect, Zenodo [data set], https://doi.org/10.5281/zenodo.15837224, 2026.
Jacobson, D. M. and Anderson, D. M.: Thecate heterophic dinoflagellates: feeding behavior and mechanisms, Journal of Phycology, 22, 249–258, https://doi.org/10.1111/j.1529-8817.1986.tb00021.x, 1986.
Jeong, H. J., Du Yoo, Y., Park, J. Y., Song, J. Y., Kim, S. T., Lee, S. H., Kim, K. Y., and Yih, W. H.: Feeding by phototrophic red-tide dinoflagellates: five species newly revealed and six species previously known to be mixotrophic, Aquatic Microbial. Ecology, 40, 133–150, https://doi.org/10.3354/ame040133, 2005.
Jeong, H. J., Seong, K. A., Yoo, Y. D., Kim, T. H., Kang, N. S., Kim, S., Park, J. Y., Kim, J. S., Kim, G. H., and Song, J. Y.: Feeding and grazing impact by small marine heterotrophic dinoflagellates on heterotrophic bacteria, Journal of Eukaryotic Microbiology, 55, 271–288, https://doi.org/10.1111/j.1550-7408.2008.00336.x, 2008.
Kim, S. Y., Lim, D. I., and Cho, H. J.: Dinoflagellate cyst assemblages from the northern shelf sediments of the East China Sea: an indicator of marine productivity, Marine Micropaleontology, 96, 75–83, https://doi.org/10.1016/j.marmicro.2012.09.003, 2012.
Lambert, C., Penaud, A., Poirier, C., and Goubert, E.: Distribution of modern dinocysts in surface sediments of southern Brittany (NW France) in relation to environmental parameters: implications for paleoreconstructions, Review of Palaeobotany and Palynology, 297, 104578, https://doi.org/10.1016/j.revpalbo.2021.104578, 2022.
Legge, O., Johnson, M., Hicks, N., Jickells, T., Diesing, M., Aldridge, J., and Williamson, P.: Carbon on the northwest European shelf: contemporary budget and future influences, Frontiers in Marine Science, 7, 143, https://doi.org/10.3389/fmars.2020.00143, 2020.
Leppäranta, M. and Myrberg, K.: Topography and hydrography of the Baltic Sea, Physical oceanography of the Baltic Sea, Springer, Berlin, Heidelberg, https://doi.org/10.1007/978-3-540-79703-6_5, 2009.
Marret, F., Bradley, L., de Vernal, A., Hardy, W., Kim, S. Y., Mudie, P., Penaud, A., Pospelova, V., Price, A. M., Radi, T., and Rochon, A.: From bi-polar to regional distribution of modern dinoflagellate cysts: an overview of their biogeography, Marine Micropaleontology, 159, 101753, https://doi.org/10.1016/j.marmicro.2019.101753, 2020.
Mertens, K. N., Verhoeven, K., Verleye, T., Louwye, S., Amorim, A., Ribeiro, S., Deaf, A. S., Harding, I. C., De Schepper, S., González, C., Kodrans-Nsiah, M., De Vernal, A., Henry, M., Radi, T., Dybkjaer, K., Poulsen, N. E., Feist-Burkhardt, S., Chitolie, J., Heilmann-Clausen, C., Londeix, L., Torun, J.-L., Marret, F., Matthiessen, J., McCarthy, F. M. G., Prasad, V., Pospelova, V., Hughes, J. E. K., Riding, J. B., Rochon, A., Sangiorgi, F., Welters, N., Sinclair, N., Thun, C., Soliman, A., Van Nieuwenhove, N., Vink, A., and Young, M.: Determining the absolute abundance of dinoflagellate cysts in recent marine sediments: The Lycopodium marker-grain method put to the test, Review of Palaeobotany and Palynology, 157, 238–252, https://doi.org/10.1016/j.revpalbo.2009.05.004, 2009.
Mertens, K. N., Dale, B., Ellegaard, M., Jansson, I. M., Godhe, A., Kremp, A., and Louwye, S.: Process length variation in cysts of the dinoflagellate Protoceratium reticulatum, from surface sediments of the Baltic–Kattegat–Skagerrak estuarine system: a regional salinity proxy, Review of Palaeobotany and Palynology, 40, 242–255, https://doi.org/10.1111/j.1502-3885.2010.00191.x, 2011.
Meyers, P. A.: Preservation of elemental and isotopic source identification of sedimentary organic matter, Chemical Geology, 114, 289–302, https://doi.org/10.1016/0009-2541(94)90059-0, 1994.
Mork, M.: Circulation phenomena and frontal dynamics of the Norwegian Coastal Current, Philosophical Transactions of the Royal Society of London. Series A, Mathematical and Physical Sciences, 302, 635–647, https://doi.org/10.1098/rsta.1981.0188, 1981.
Mudie, P. J., Marret, F., Gurdebeke, P. R., Hartman, J. D., and Reid, P. C.: Marine dinocysts, acritarchs and less well-known NPP: tintinnids, ostracod and foraminiferal linings, copepod and worm remains, in: Applications of Non-Pollen Palynomorphs: from Palaeoenvironmental Reconstructions to Biostratigraphy, edited by: Marret, F., O'Keefe, J., Osterloff, P., Pound, M., and Shumilovskikh, L., Geological Society, London, Special Publications, 511, https://doi.org/10.1144/SP511-2020-55, 2021.
Nittrouer, C. A. and Wright, L. D.: Transport of particles across continental shelves, Reviews of Geophysics, 32, 85–113, https://doi.org/10.1029/93RG02603, 1994.
Oksanen, J., Simpson, G. L., Blanchet, F. G., Kindt, R., Legendre, P., Minchin, P. R., O'Hara, R. B., Solymos, P., Stevens, M. H. H., Szoecs, E., Wagner, H., Barbour, M., Bedward, M., Bolker, B., Borcard, D., Borman, T., Carvalho, G., Chirico, M., De Caceres, M., Durand, S., Evangelista, H. B. A., FitzJohn, R., Friendly, M., Furneaux, B., Hannigan, G., Hill, M. O., Lahti, L., Martino, C., McGlinn, D., Ouellette, M.-H., Cunha, E. R., Smith, T., Stier, A., Ter Braak, C. J. F., and Weedon, J.: Package “vegan”, Community Ecology Package, 2, 1–295, 2013.
Pearson, K.: VII. Note on regression and inheritance in the case of two parents, Proceedings of the Royal Society of London, 58, 240–242, https://doi.org/10.1098/rspl.1895.0041, 1895.
Penaud, A., Hardy, W., Lambert, C., Marret, F., Masure, E., Servais, T., Siano, R., Wary, M., and Mertens, K. N.: Dinoflagellate fossils: geological and biological applications, Revue de Micropaléontologie, 61, 235–254, https://doi.org/10.1016/j.revmic.2018.09.003, 2018.
Pospelova, V., de Vernal, A., and Pedersen, T. F.: Distribution of dinoflagellate cysts in surface sediments from the northeastern Pacific Ocean (43–25° N) in relation to sea-surface temperature, salinity, productivity and coastal upwelling, Marine Micropaleontology, 68, 21–48, https://doi.org/10.1016/j.marmicro.2008.01.008, 2008.
Price, A. M. and Pospelova, V.: High-resolution sediment trap study of organic-walled dinoflagellate cyst production and biogenic silica flux in Saanich Inlet (BC, Canada), Marine Micropaleontology, 80, 18–43, https://doi.org/10.1016/j.marmicro.2011.03.003, 2011.
Punt, W. and Clarke, G. C. S. (Eds.): The Northwest European Pollen Flora: Reprinted from Review of Palaeobotany and Palynology, Elsevier, Vol. 33, ISBN 0-444-41883-0, 2016.
Radi, T. and de Vernal, A.: Dinocysts as proxy of primary productivity in mid–high latitudes of the Northern Hemisphere, Marine Micropaleontology, 68, 84–114, https://doi.org/10.1016/j.marmicro.2008.01.012, 2008.
Radi, T., Pospelova, V., de Vernal, A., and Barrie, J. V.: Dinoflagellate cysts as indicators of water quality and productivity in British Columbia estuarine environments, Marine Micropaleontology, 62, 269–297, https://doi.org/10.1016/j.marmicro.2006.09.002, 2007.
Rahm, L., Conley, D., Sandén, P., Wulff, F., and Stålnacke, P.: Time series analysis of nutrient inputs to the Baltic Sea and changing DSi:DIN ratios, Mar. Ecol. Prog. Ser., 130, 221–228, https://doi.org/10.3354/meps130221, 1996.
Reagan, J. R., Boyer, T. P., García, H. E., Locarnini, R. A., Baranova, O. K., Bouchard, C., Cross, S. L., Mishonov, A. V., Paver, C. R., Seidov, D., Wang, Z., and Dukhovskoy, D.: World Ocean Atlas 2023, NOAA National Centers for Environmental Information [data set], 0270533, https://doi.org/10.25923/rb67-ns53, 2024.
Redfield, A. C.: On the proportions of organic derivations in sea water and their relation to the composition of plankton, in: James Johnstone Memorial Volume, edited by: Daniel, R. J., University Press of Liverpool, Liverpool, UK, 176–192, 1934.
Reichart, G. J. and Brinkhuis, H.: Late Quaternary Protoperidinium cysts as indicators of paleoproductivity in the northern Arabian Sea, Marine Micropaleontology, 49, 303–315, https://doi.org/10.1016/S0377-8398(03)00050-1, 2003.
Rochon, A., de Vernal, A., Turon, J. L., Matthiessen, J., and Head, M. J.: Distribution of recent dinoflagellate cysts in surface sediments from the North Atlantic Ocean and adjacent seas in relation to sea-surface parameters, American Association of Stratigraphic Palynologists Contribution Series, 35, 1–146, 1999.
Sangiorgi, F. and Donders, T. H.: Reconstructing 150 years of eutrophication in the north-western Adriatic Sea (Italy) using dinoflagellate cysts, pollen and spores, Estuarine, Coastal and Shelf Science, 60, 69–79, https://doi.org/10.1016/j.ecss.2003.12.001, 2004.
Schoepfer, S. D., Shen, J., Wei, H., Tyson, R. V., Ingall, E., and Algeo, T. J.: Total organic carbon, organic phosphorus, and biogenic barium fluxes as proxies for paleomarine productivity, Earth-Science Reviews, 149, 23–52, https://doi.org/10.1016/j.earscirev.2014.08.017, 2015.
Sildever, S., Andersen, T. J., Ribeiro, S., and Ellegaard, M.: Influence of surface salinity gradient on dinoflagellate cyst community structure, abundance and morphology in the Baltic Sea, Kattegat and Skagerrak, Estuarine, Coastal and Shelf Science, 155, 1–7, https://doi.org/10.1016/j.ecss.2015.01.003, 2015.
Simpson, G. L.: Analogue methods in palaeoecology: Using the analogue package, J. Stat. Softw., 22, https://doi.org/10.18637/jss.v022.i02, 2007.
Snoeijs-Leijonmalm, P., Schubert, H., and Radziejewska, T. (Eds.): Biological Oceanography of the Baltic Sea, Springer Science and Business Media, https://doi.org/10.1007/978-94-007-0668-2, 2017.
Stockmarr, J.: Tables with spores used in absolute pollen analysis, Pollen Spores, 13, 615–621, 1971.
Ter Braak, C. J.: Canonical correspondence analysis: a new eigenvector technique for multivariate direct gradient analysis, Ecology, 67, 1167–1179, https://doi.org/10.2307/1938672, 1986.
Thomas, H., Bozec, Y., Elkalay, K., and de Baar, H. J.: Enhanced open-ocean storage of CO2 from shelf-sea pumping, Science, 304, 1005–1008, https://doi.org/10.1126/science.1095491, 2004.
Thorsen, T. A. and Dale, B.: Climatically influenced distribution of Gymnodinium catenatum during the past 2000 years in coastal sediments of southern Norway, Palaeogeography, Palaeoclimatology, Palaeoecology, 143, 159–177, https://doi.org/10.1016/S0031-0182(98)00079-0, 1998.
Tyson, R. V. and Pearson, T. H.: Modern and ancient continental shelf anoxia: an overview, SP, 58, 1–24, https://doi.org/10.1144/GSL.SP.1991.058.01.01, 1991.
Versteegh, G. J. and Zonneveld, K. A.: Use of selective degradation to separate preservation from productivity, Geology, 30, 615–618, https://doi.org//10.1130/0091-7613(2002)030%3C0615:UOSDTS%3E2.0.CO;2TS38, 2002.
Wakelin, S. L., Holt, J. T., Blackford, J. C., Allen, J. I., Butenschön, M., and Artioli, Y.: Modeling the carbon fluxes of the northwest European continental shelf: validation and budgets, Journal of Geophysical Research: Oceans, 117, https://doi.org/10.1029/2011JC007402, 2012.
Wang, Z., Zhang, Y., Lei, M., Ji, S., Chen, J., Zheng, H., Tang, Y., and Hu, R.: Distribution of dinoflagellate cysts in surface sediments from the Qingdao Coast, Yellow Sea, China: the potential risk of harmful algal blooms, Frontiers in Marine Science, 9, 910327, https://doi.org/10.3389/fmars.2022.910327, 2022.
Williams, G., Fensome, R., and McRae, R.: The Lentin and Williams Index of Fossil Dinoflagellates, 2017 Edn., American Association of Stratigraphic Palynologists Foundation, Contribution Series, AASP Contributions Series Number 48, ISSN 0160-8843, 2017.
Willumsen, P. S., Filipsson, H. L., Reinholdsson, M., and Lenz, C.: Surface salinity and nutrient variations during the Littorina Stage in the Fårö Deep, Baltic Sea, Boreas, 42, 210–223, https://doi.org/10.1111/j.1502-3885.2012.00286.x, 2013.
Winther, N. G. and Johannessen, J. A.: North Sea circulation: Atlantic inflow and its destination, Journal of Geophysical Research: Oceans, 111, https://doi.org/10.1029/2005JC003310, 2006.
Wu, X., de Vernal, A., and Allan, E.: Migration of deep convection center in subpolar North Atlantic around 6 ka suggested by a dinocyst proxy of mixed layer depth, Paleoceanogr. Paleoclim., 40, https://doi.org/10.1029/2024PA004998, 2025.
Yedema, Y. W., Donders, T., Peterse, F., and Sangiorgi, F.: Dinoflagellate cyst and pollen assemblages as tracers for marine productivity and river input in the northern Gulf of Mexico, J. Micropalaeontol., 42, 257–276, https://doi.org/10.5194/jm-42-257-2023, 2023.
Zonneveld, K. A. and Pospelova, V.: A determination key for modern dinoflagellate cysts, Palynology, 39, 387–409, https://doi.org/10.1080/01916122.2014.990115, 2015.
Zonneveld, K. A., Bockelmann, F., and Holzwarth, U.: Selective preservation of organic-walled dinoflagellate cysts as a tool to quantify past net primary production and bottom-water oxygen concentrations, Marine Geology, 237, 109–126, https://doi.org/10.1016/j.margeo.2006.10.023, 2007.
Zonneveld, K. A., Versteegh, G., and Kodrans-Nsiah, M.: Preservation and organic chemistry of Late Cenozoic organic-walled dinoflagellate cysts: A review, Mar. Micropaleontol., 68, 179–197, https://doi.org/10.1016/j.marmicro.2008.01.015, 2008.
Zonneveld, K. A., Chen, L., Möbius, J., and Mahmoud, M. S.: Environmental significance of dinoflagellate cysts from the proximal part of the Po-river discharge plume (off southern Italy, Eastern Mediterranean), J. Sea Res., 62, 189–213, https://doi.org/10.1016/j.seares.2009.02.003, 2009.
Zonneveld, K. A. F., Marret, F., Versteegh, G. J. M., Bogus, K., Bonnet, S., Bouimetarhan, I., Crouch, E., de Vernal, A., Elshanawany, R., Edwards, L., Esper, O., Forke, S., Grøsfjeld, K., Henry, M., Holzwarth, U., Kielt, J.-F., Kim, S.Y., Ladouceur, S., Ledu, D., Chen, L., Limoges, A., Londeix, L., Lu, S.-H., Mahmoud, M. S., Marino, G., Matsouka, K., Matthiessen, J., Mildenhal, D. C., Mudie, P., Neil, H. L., Pospelova, V., Qi, Y., Radi, T., Richerol, T., Rochon, A., Sangiorgi, F., Solignac, S., Turon, J.-L., Verleye, T., Wang, Y., Wang, Z., and Young, M.: Atlas of modern dinoflagellate cyst distribution based on 2405 data points, Rev. Palaeobot. Palyno., 191, 1197, https://doi.org/10.1016/j.revpalbo.2012.08.003, 2013.
Zwiep, K., Hennekam R., Donders T., van Helmond N., de Lange G., and Sangiorgi F.: Marine productivity, water column dynamics and seafloor anoxia in relation to Nile discharge during sapropels S1 and S3, Quaternary Science Reviews, 200, 178–190, https://doi.org/10.1016/j.quascirev.2018.08.026, 2018.