the Creative Commons Attribution 4.0 License.
the Creative Commons Attribution 4.0 License.
 | 18 May 2026
Testing the applicability of automated size and shape analyses in non-marine ostracods – a case study from the Tibetan Plateau
Marlene Hoehle
Torsten Haberzettl
Peter Frenzel
Antje Schwalb
Junbo Wang
Liping Zhu
Claudia Wrozyna
Evolutionary developmental biology seeks to elucidate the developmental mechanisms underlying phenotypic evolution. Central to this endeavor is the quantitative analysis of morphological variation, for which morphometric approaches have become indispensable tools. While morphometric methods have been extensively applied in paleontological research across diverse fossil groups, certain taxa remain underexplored. Among these, ostracods (Crustacea) represent a particularly promising yet underutilized group for such analyses. The suitability of ostracods for evolutionary and developmental investigations stems from several key attributes: their near-ubiquitous distribution across aquatic habitats, a remarkable taxonomic and morphological diversity, and an exceptional fossil record spanning geological time scales.
Traditional morphometric approaches are constrained by the time-intensive nature of data acquisition, limiting the extent of achievable datasets. To address this bottleneck, we evaluate the efficacy of AutoMorph, a high-throughput imaging pipeline, for automated extraction of size and shape data from ostracod valves. We apply this approach to two ostracod species, Leucocythere dorsotuberosa and Leucocytherella sinensis, sampled from six lakes across the Tibetan Plateau, a region offering aquatic ecosystems with high endemism, providing an ideal setting for investigating ecological and evolutionary responses through morphological approaches. Our findings demonstrate that the AutoMorph pipeline successfully extracts morphometric measurements and coordinate data from ostracod valves, substantially reducing processing time while minimizing subjective bias inherent in manual approaches.
This methodological advancement facilitates the generation of extensive datasets, thereby enabling more comprehensive investigations of ecological and evolutionary processes on large spatial and temporal scales.
- Article
(11000 KB) - Full-text XML
- BibTeX
- EndNote


The fossil record demonstrates that organismal evolution involves marked morphological changes and the appearance of new features, which cannot be fully understood without examining the development biases or constraints that influence evolution (Raff, 2000). Evolutionary developmental biology aims to identify the developmental mechanisms that drive evolutionary changes in phenotypes, from subtle modifications in structure to the origin of novel traits (Hall, 2003), and to clarify how genetic processes translate into organismal morphology (Hall, 2012). However, genetic analyses are generally inaccessible in fossil records, making morphological evidence the primary means of studying evolutionary patterns across deep time. In this context, morphometrics, a quantitative, multivariate technique for analyzing biological form, including size and shape, provide an essential framework for examining phenotypic evolution in fossilized organisms, their environmental responses, and phenotypic responses on geological timescales (Li et al., 2021; Mulqueeney et al., 2025).
Despite its utility, morphometric research faces a significant bottleneck: the acquisition and analysis of large datasets typically rely on manual extraction of shape and size data, a process that is both time-consuming and susceptible to observer bias (Fox et al., 2020; Mulqueeney et al., 2025).
Recent decades have witnessed rapid advances in imaging techniques, facilitating the development of automated processes that are being increasingly applied in paleontology, particularly for microfossil groups such as foraminifera, coccolithophores, conodonts, and fish teeth (Elder et al., 2018; Hsiang et al., 2018; Kahanamoku-Meyer et al., 2024). The development of AutoMorph (Hsiang et al., 2018) has been especially influential. This Python-based software package extracts outlines of white objects against black backgrounds, enabling batch processing of thousands of specimens per day (Hsiang et al., 2018; Kahanamoku-Meyer et al., 2024). Following its initial implementation for foraminifera, AutoMorph has facilitated the establishment of extensive image datasets at scales previously unattainable for this group. These large datasets have proven to be crucial in understanding macroevolutionary and macroecological patterns in the global ocean, with widespread applications in paleoceanographic and paleoclimatic research (Hsiang et al., 2019).
While marine records have benefited substantially from automated approaches, continental settings offer complementary opportunities, but, due to their isolation, small-scale systems, adaption, radiation, and evolutionary development of organisms can be expected. Lacustrine archives provide continuous records well-suited for reconstructing past environmental conditions and investigating evolutionary and ecological dynamics (Burge et al., 2018). The global abundance and environmental diversity of lakes, with approximately 117 million lakes larger than 0.2 ha, spanning environments from the Arctic to the tropics and from temperate zones to extreme high-altitude systems (Verpoorter et al., 2014), enable the investigation of these processes across different climatic and geographical contexts.
Among the organisms frequently preserved in lake sediments, ostracods are particularly valuable. These microcrustaceans provide an excellent model for investigating species–environment relationships, phenotypic variability, and evolutionary dynamics across spatial and temporal scales. This suitability derives from several key attributes: global distribution, high fossilization potential of calcified valves, exceptional taxonomic diversity, sensitivity to environmental parameters, and short life cycles (Horne, 2005). Moreover, the high degree of regional or local endemism in many ostracod taxa enhances their value as regional environmental indicators and for evolutionary studies (Martens et al., 2008; Smith et al., 2015).
Despite their suitability for investigating species–environment relationships and evolutionary processes, ostracods remain underrepresented in morphological studies, primarily due to time-consuming processing and the lack of a widely accepted methodological approach analyzing size and shape variability (Baltanás et al., 2003; Baltanás and Danielopol, 2011). Methodological approaches in morphometrics of ostracods have evolved considerably over time. Early work relied primarily on traditional measurements, including linear dimensions (e.g., length and height), angular parameters, or valve area. However, these approaches often failed to reproduce overall geometric proportions, prompting the development of alternative methods (Slice, 2007).
The advent of geometric morphometrics provided a quantitative methodology for capturing and describing complex two- and three-dimensional organismal geometry through discrete anatomical loci that are biologically or mathematically homologous (landmarks) and geometric features defined in terms of its position on that feature (semi-landmarks), e.g., along curves (Cooke and Terhune, 2015; Mitteroecker and Schaefer, 2022). Landmark-based analyses were applied to ostracods as early as the 1970s (Baltanás et al., 2003; Baltanás and Danielopol, 2011; Danielopol et al., 2002, and references therein) but did not become a standard method because ostracod valves often lack a sufficient number of homologous points due to their smooth and often poorly ornamented surface, a characteristic feature typical of non-marine taxa. To address this limitation, outline-based approaches were adopted, including Eigenshape analysis, Fourier methods, and B-splines (Baltanás et al., 2003; Baltanás and Danielopol, 2011). A major advancement was achieved with the implementation of sliding semi-landmarks for ostracod valve shape analysis by Wrozyna et al. (2016). In combination with fixed landmarks, semi-landmarks enable the quantification of curves and surfaces. This method involves superimposition of configurations using generalized procrustes analysis to remove variation by translating, rotating, and scaling all configurations to the same centroid (Bookstein, 1996; Mitteroecker and Schaefer, 2022). The results can subsequently undergo statistical analysis and be visualized as shapes or shape changes (Mitteroecker and Schaefer, 2022). However, this approach still requires manual digitization of valve outlines, restricting morphometric analyses to single species and limited specimen numbers. While some species have been studied more comprehensively, notably Eucypris virens (Jurine, 1820) (Baltanás et al., 2002; Koenders et al., 2017), Cyprideis torosa (Jones, 1857) (Hoehle et al., 2025a, b; Wrozyna et al., 2022), and Cytheridella ilosvayi (von Daday, 1905) (Wrozyna et al., 2014, 2016, 2018a, b, 2019), these analyses remain constrained by the time-intensive nature of the methodology. Sample sizes typically amount to a few hundred specimens, with comparisons being limited to only a small number of regions and/or localities. Furthermore, most studies focus on recent material, whereas investigations of fossil morphological variability are comparatively rare (exceptions are for example Gross et al., 2008; Wrozyna et al., 2022), leaving spatial and temporal morphological variability insufficiently characterized.
Although technological advances have yielded substantial time savings, such as the transition from SEM imaging to digital microscopy and from manual measurements to integrated measurement software (e.g., Keyence digital microscope), imaging of single specimens remains time-intensive. Furthermore, the landmark and semi-landmark approach used by Wrozyna et al. (2016) require placement of numerous coordinate points along the valve outline (e.g., 68 points in Wrozyna et al., 2016, and 93 points in Hoehle et al., 2025b), a process still conducted manually for each specimen. This constraint prevents the generation of large datasets covering large geographic ranges and/or time, which are essential for identifying interspecific and intraspecific morphological variations reflecting ecological and evolutionary processes. For paleoenvironmental applications, morphometrics can also reduce taxonomic uncertainties (Fürstenberg et al., 2015) or reveal diversification, overlooked by qualitative inspection (Wrozyna et al., 2018a). This is particularly important because taxonomy directly affects further application of ostracod valves for geochemical analyses, for example (von Grafenstein et al., 1999). The time-consuming nature of acquiring data for morphometric analyses restricts the ability to process large sample sets and perform comprehensive analyses, underscoring the need for more efficient approaches.
To evaluate the applicability of AutoMorph for analyzing size and shape variability in ostracod valves, we adapted the existing package and applied a revised workflow to two ostracod species, Leucocythere dorsotuberosa (Huang, 1982) and Leucocytherella sinensis (Huang, 1982), collected from six lakes located on the southern Tibetan Plateau. This geographically isolated, high-altitude region hosts unique aquatic ecosystems with a high degree of endemism, providing an ideal setting for investigating ecological and evolutionary responses through morphological approaches (von Oheimb et al., 2011). The two focal species, L. sinensis and L. dorsotuberosa, are endemic to the southwestern and central Tibetan Plateau and are the dominant taxa in large and deep lakes (Wrozyna et al., 2009; Mischke, 2012; Fürstenberg et al., 2015; Akita et al., 2016; Alivernini et al., 2018).
The landmark/semi-landmark approach has proven to be sufficiently sensitive to capture not only interspecific variation but also intraspecific differences (e.g., between sexes), and subtle morphological variation within and among habitats (Hoehle et al., 2025b; Karanovic et al., 2023; Wrozyna et al., 2016, 2018a). Implementation of automated data acquisition using AutoMorph should overcome the time-consuming manual data acquisition and resulting limitations on dataset size. With this study we aim to (1) evaluate whether using AutoMorph can automate the time-intensive manual data collection process for (semi-) landmark analysis, (2) identify and implement the modifications necessary for automated generation of geometric morphometric data from ostracod valves, and (3) assess whether automatically acquired coordinate data facilitate discrimination between species and sexes.
Sediment surface samples were collected from six lakes on the Tibetan Plateau during field campaigns from 2008 to 2012, within the framework of a Sino-German cooperation (“The Tibetan Plateau – Geodynamics and Environmental Evolution”) and a special priority program (SPP 1372 TiP). The chosen lakes belong to the large and deep lakes in the southern part of the Tibetan Plateau (Fig. 1). This study focuses on the two endemic ostracod species L. sinensis and L. dorsotuberosa. The species were chosen as they are the most dominant species of these large and deep lakes, enabling the preparation of spatial but, due to their long fossil records, also temporal datasets for further comprehensive analyzes. Specimens of L. dorsotuberosa and L. sinensis were derived from Chen Co, Nam Co, Tangra Yumco, and Xuru Co. Additionally, L. dorsotuberosa from Pumayum Co and L. sinensis from Npen Co were taken. The lakes have different characteristics with respect to their morphometry and physicochemical settings. These have been reported and investigated in numerous studies for different purposes (e.g., Akita et al., 2016; Börner et al., 2017; Ju et al., 2012; Keil et al., 2010; Krause et al., 2010; Murakami et al., 2007; Qiao et al., 2017; Wang et al., 2020; Zhu et al., 2010).
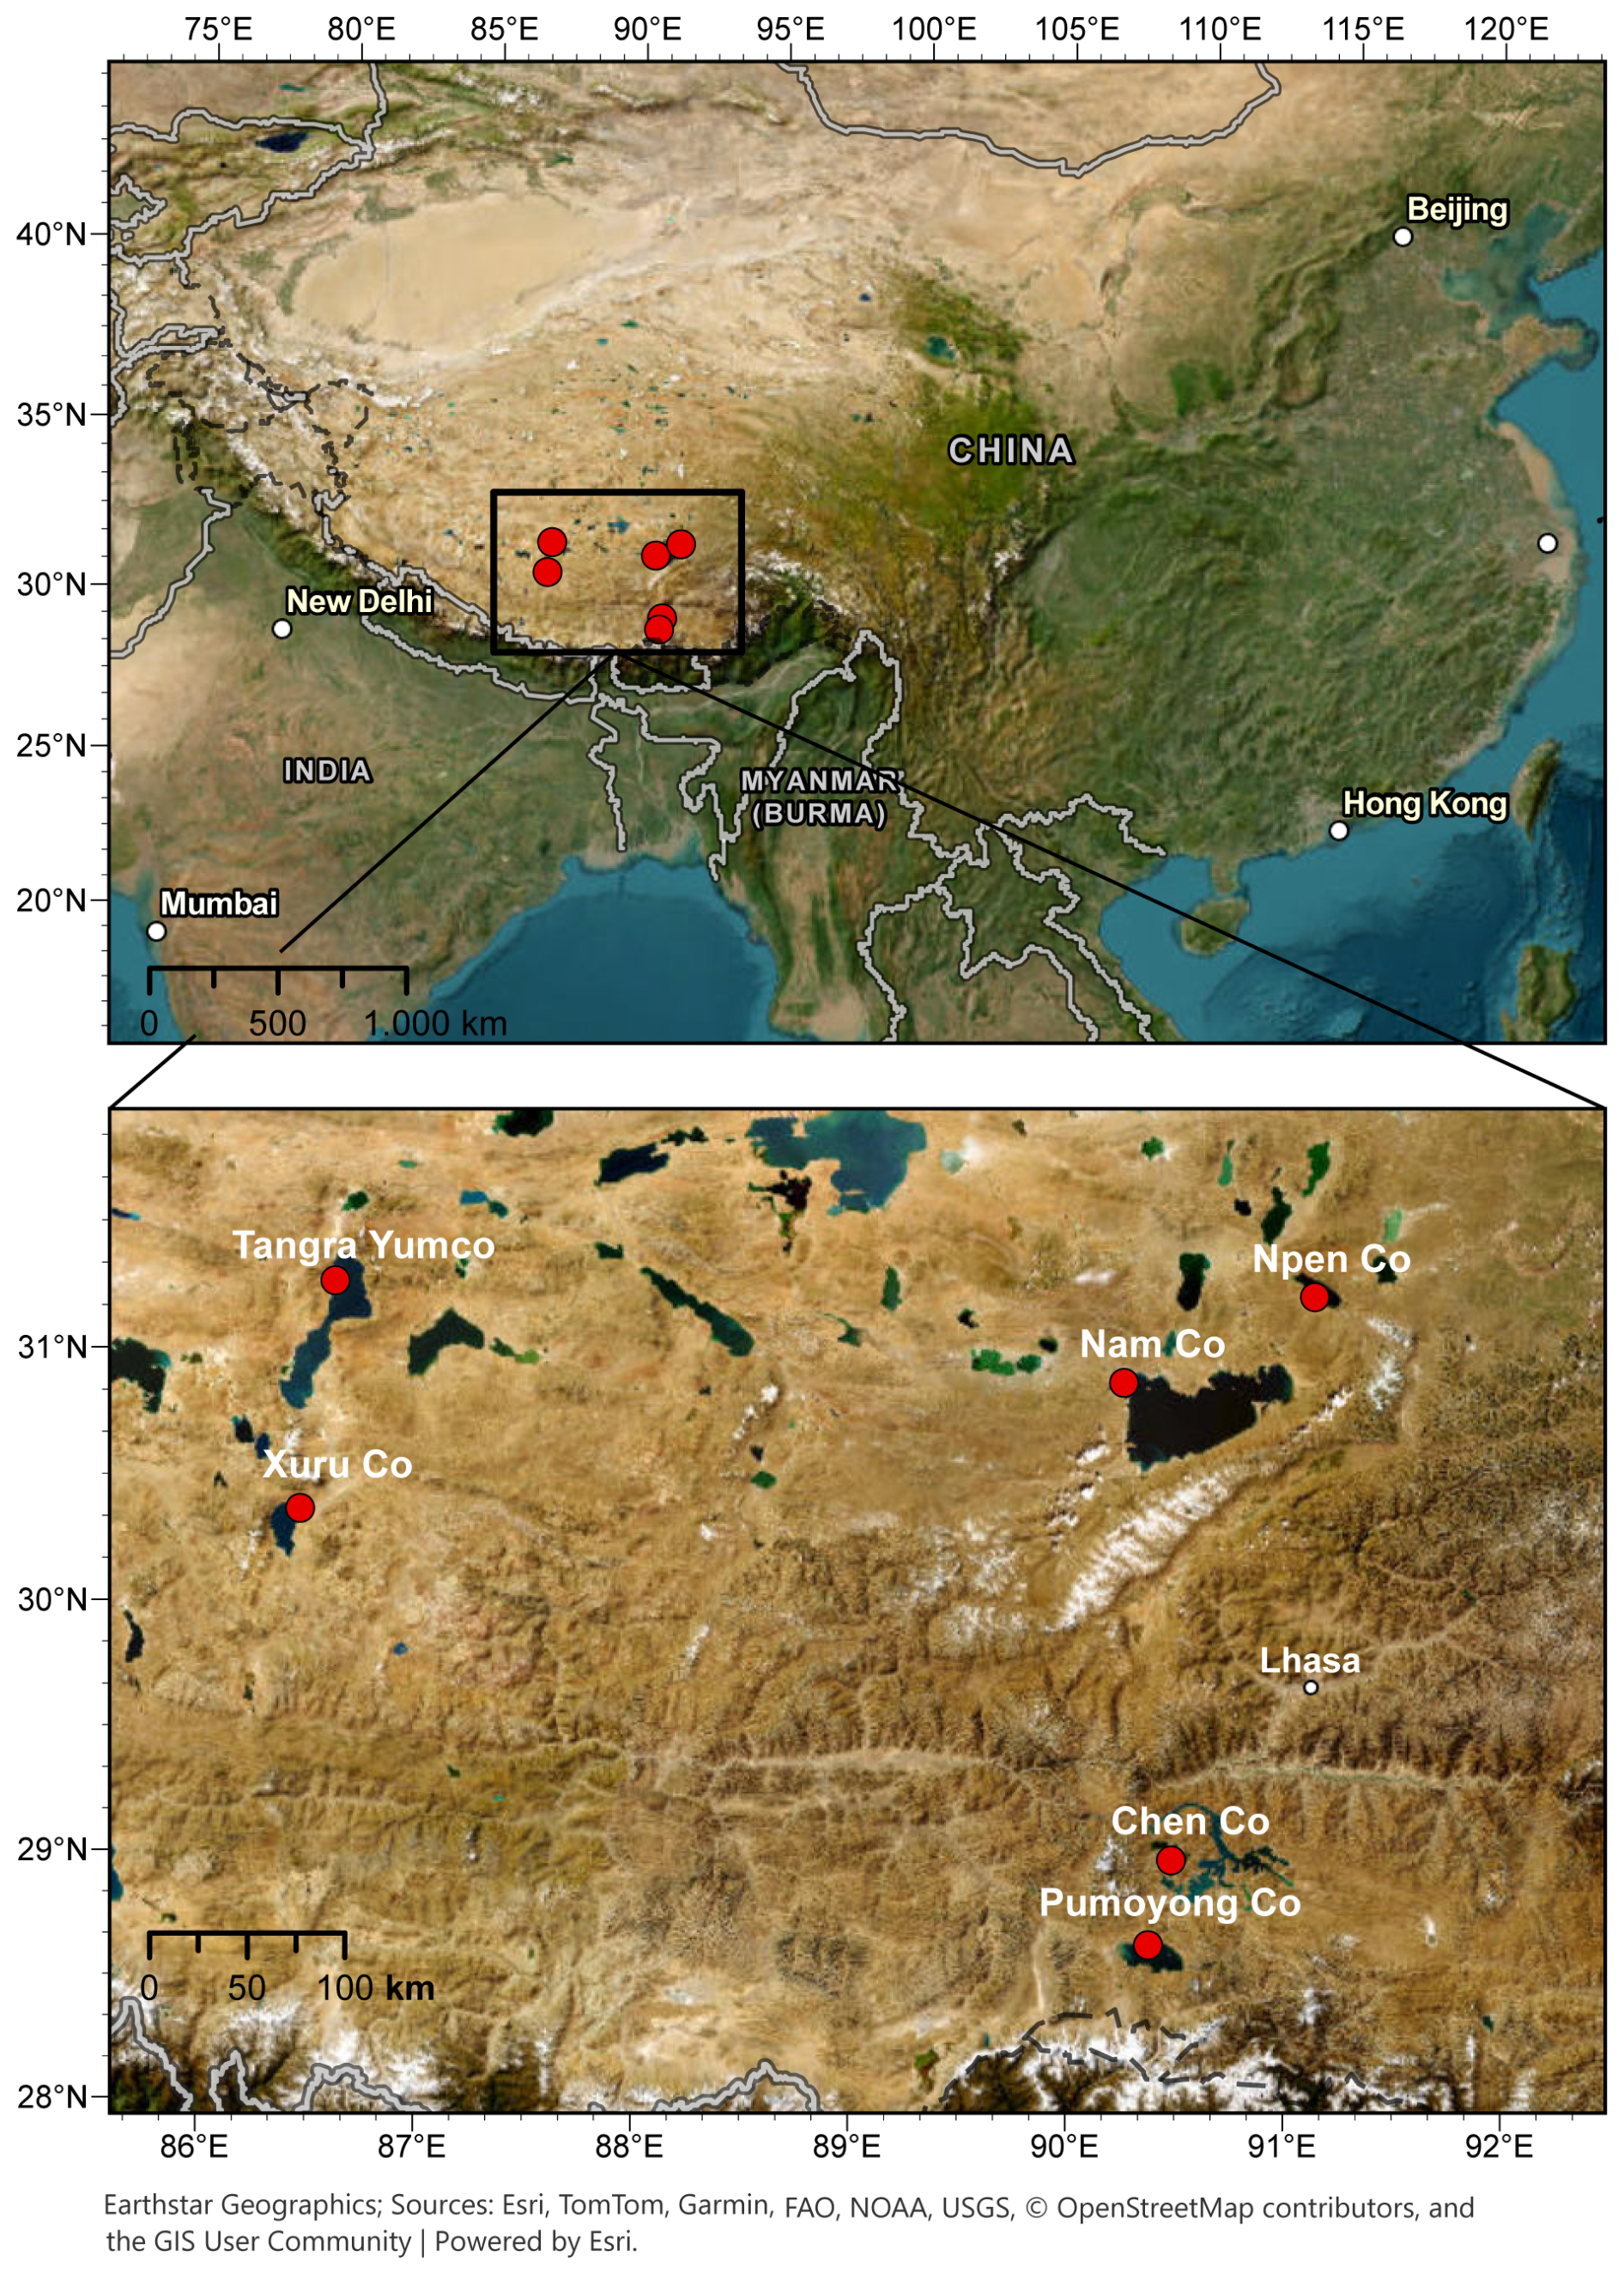
Figure 1Overview of the study area and sampling locations.
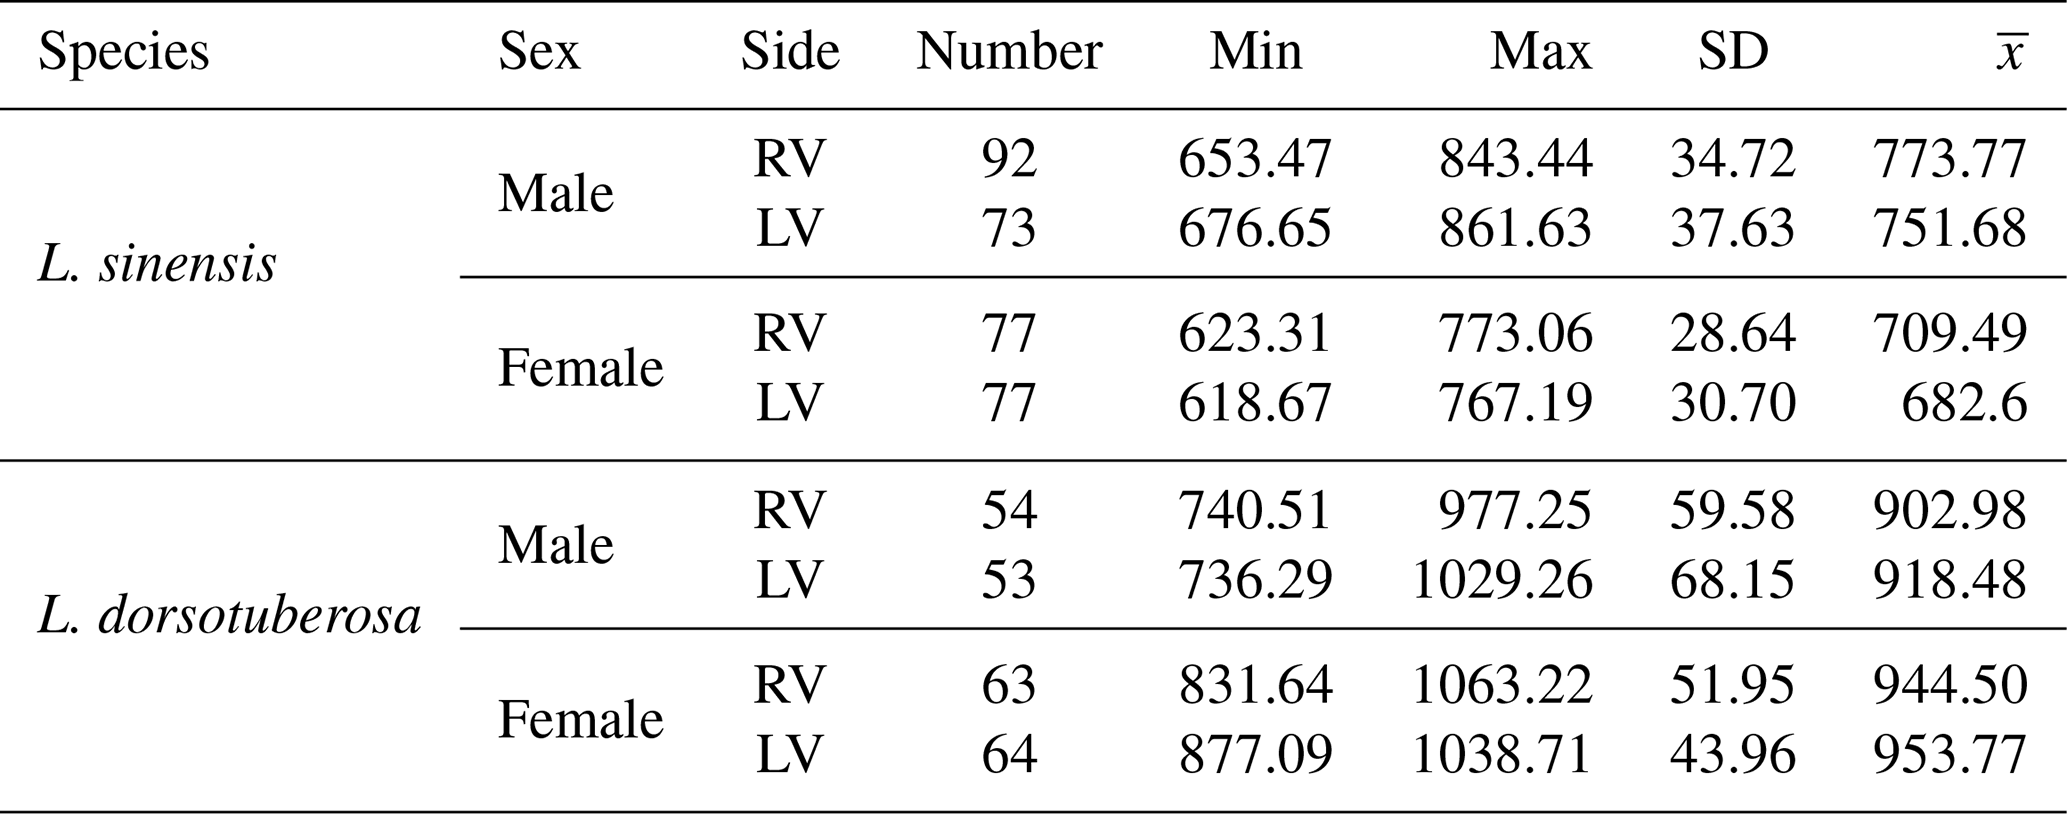
In order to exploit as much morphological information as possible, we used left and right valves from adults. Adults were identified based on size and outline by visual inspection (Fürstenberg et al., 2015; Akita et al., 2016). In total, 553 valves (234 L. dorsotuberosa and 319 L. sinensis) were analyzed (L. dorsotuberosa: female LV 64, female RV 63; male LV 53, male RV 54; L. sinensis: female LV and RV each 77; males LV 73, male RV 92; see Table 1).
Table 1Information on sample size (number) of valves and minimum (min), maximum (max), SD, and mean ) length (in µm) of Leucocytheridella sinensis and Leucocythere dorsotuberosa, derived from the automated size measurements.
3.1 Imaging and AutoMorph
Specimens were divided into sub-datasets according to species (L. sinensis or L. dorsotubrosa), sex (male or female), and valve (left or right). The panorama function of a Keyence VHX 7000 microscope was used to photograph all specimens from a sub-dataset at once (bulk images) for faster processing. The microscope was centered, and images were captured in a 4×4 grid around the central position at a 150× magnification. The microscope software automatically generates images with extended depth of focus (EDF). This procedure yielded composite overview images (bulk images) for each sub dataset at each locality (Fig. 2).
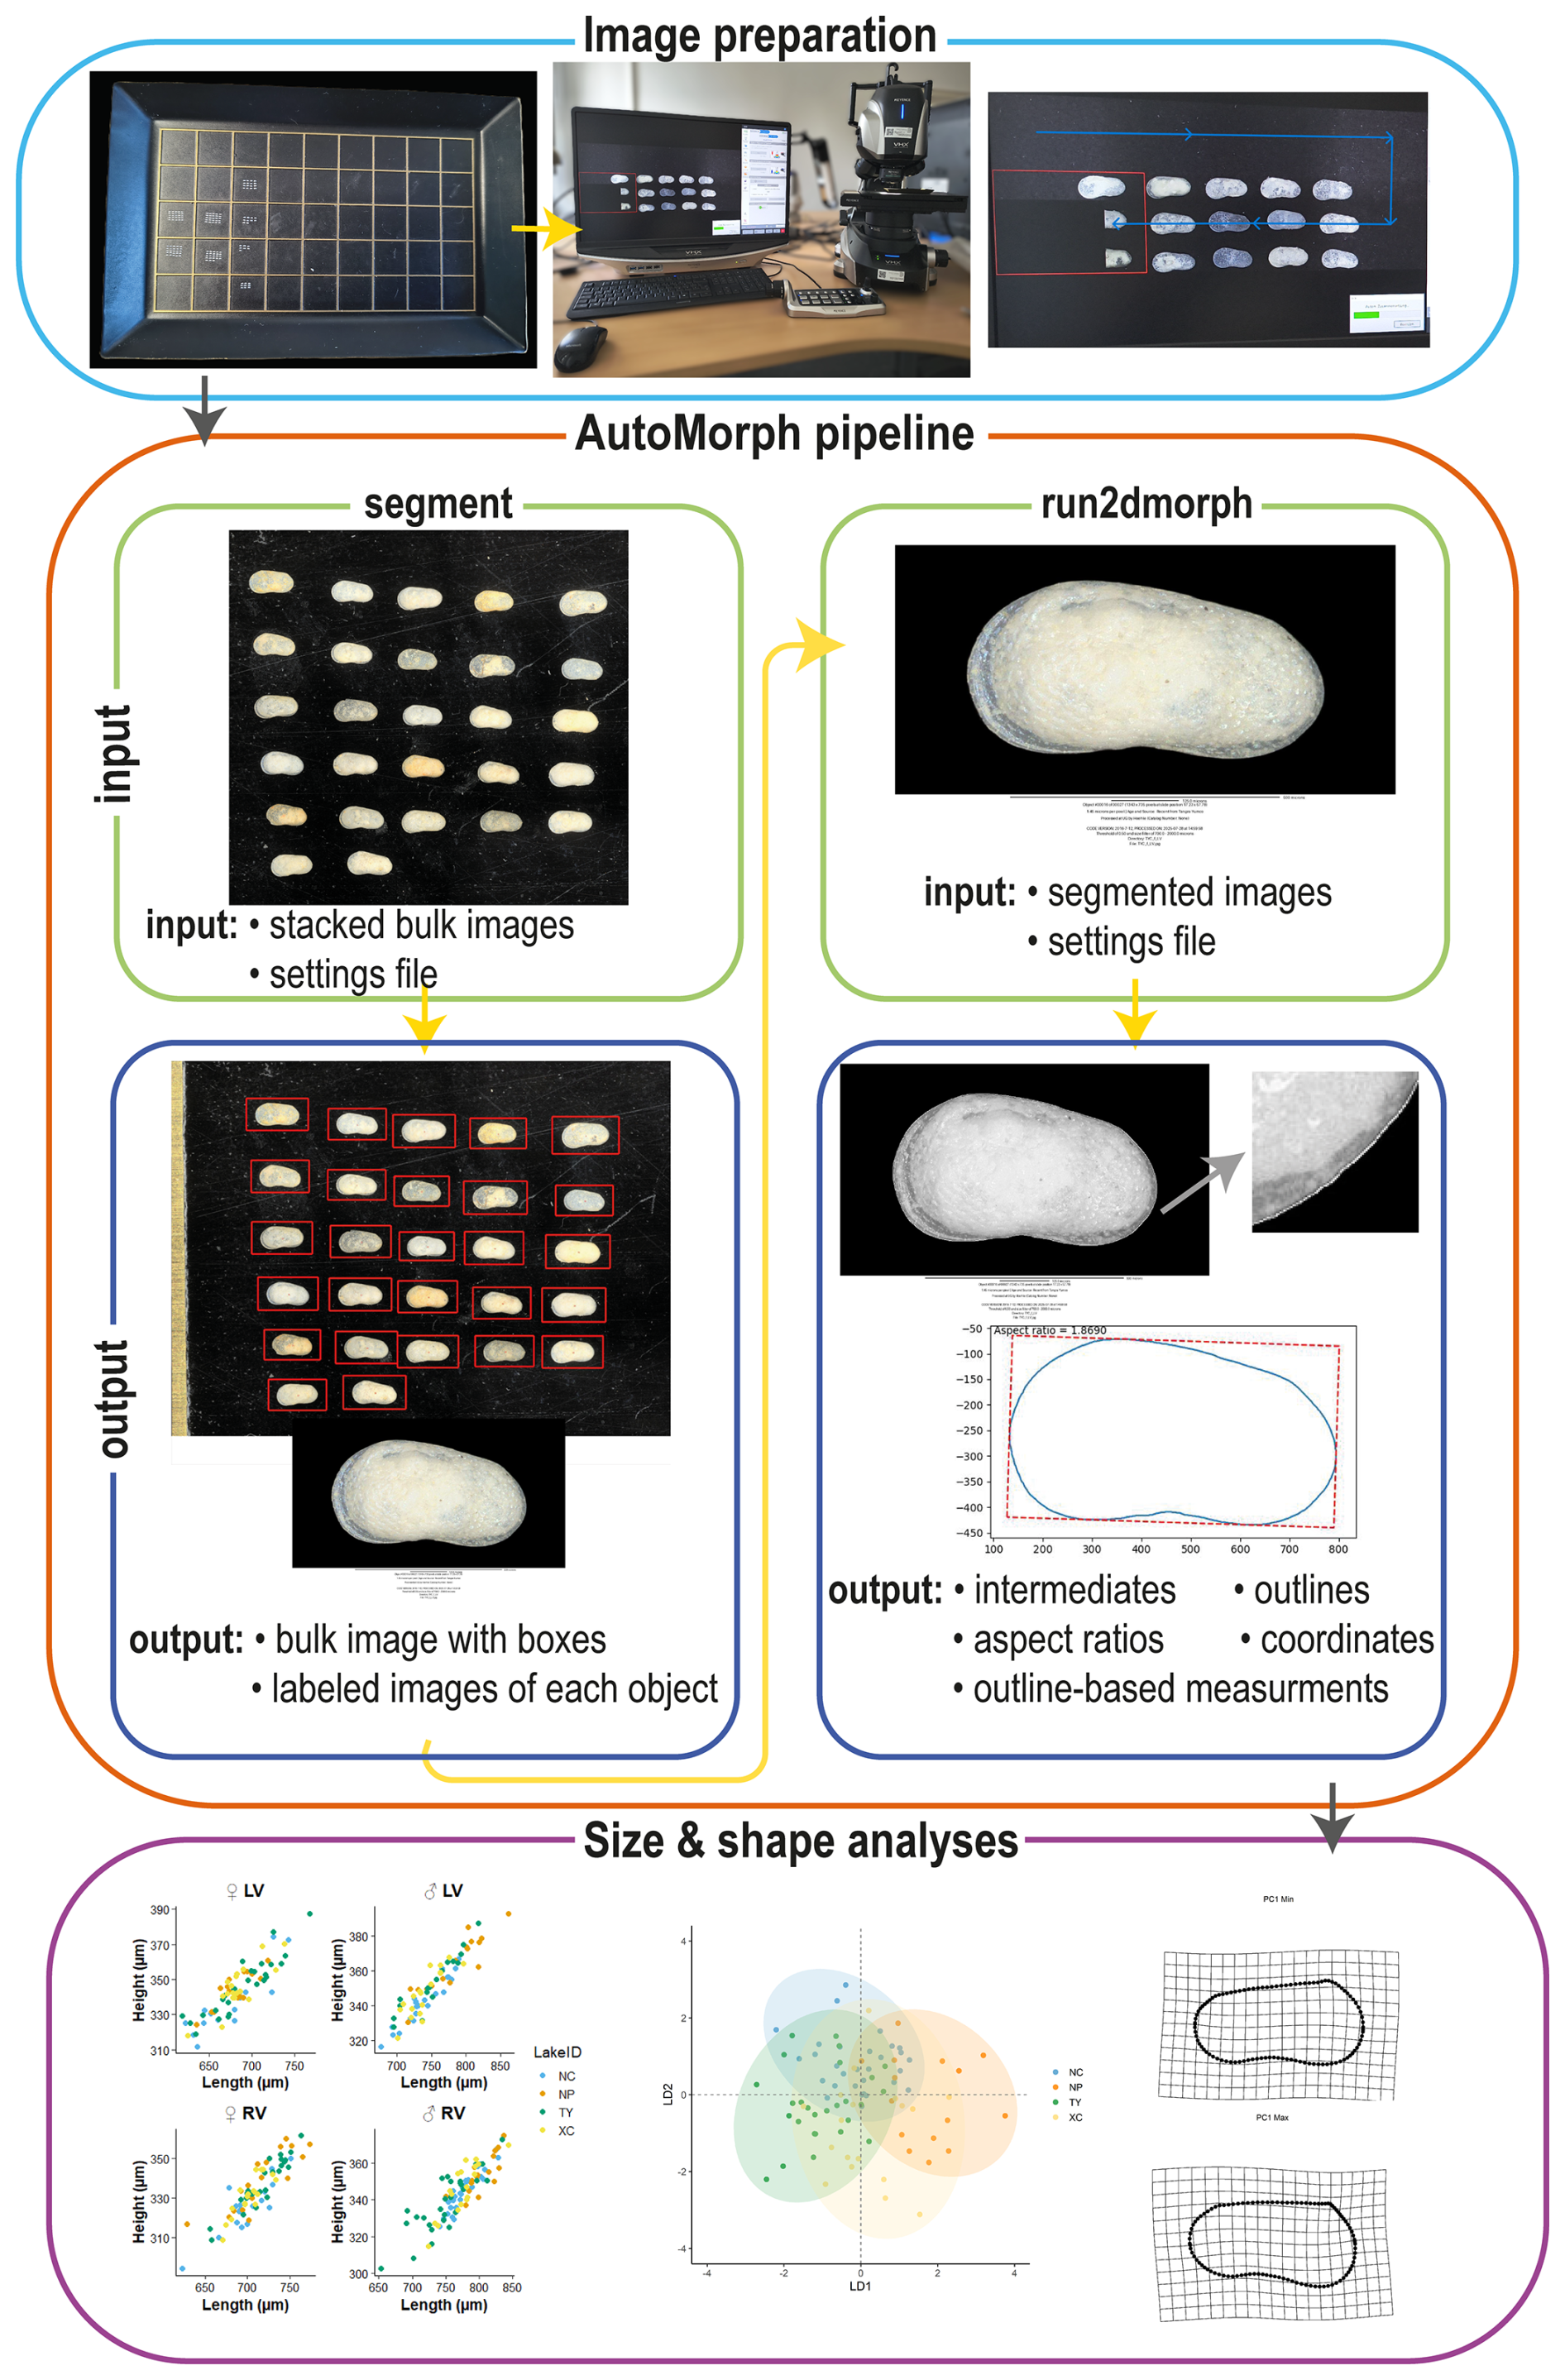
Figure 2Visual pipeline illustrating the steps of the automated data acquisition. The process starts with image preparation and taking bulk images, which are then further processed using the segment module. The outline of the segmented images is extracted using the run2dmorph software. The extracted size and coordinate data can then be used for geometric morphometric analyses.
These bulk images were subsequently processed using the AutoMorph pipeline (Hsiang et al., 2018) (Fig. 2). Processing began with the segment module, created to segment detected objects of a bulk image. While this module was originally designed for images with multiple focal planes, our dataset consisted of already focus-stacked images, and the script was modified according to Kahanamoku-Meyer et al. (2024). Optimal settings for ostracods were determined and refined using the sample mode in the “control file” of the segment module. Crucial settings for the successful segmentation of ostracod valves are threshold and the size range (minimum size and maximum size). For our microscope settings (e.g., light settings) the most effective segmentation results were achieved with a threshold value between 0.3 and 0.4. Furthermore, defining an appropriate size range for object detection proved to be essential to maximize recognition of individual specimens within each bulk image. This range was species-specific and set to 400 to 1500 µm for L. sinensis and 700 to 2000 µm for L. dorsotubrosa. The script was further adapted to test these settings across all images within each sub-dataset folder. To facilitate this, the saving routine was modified so that the original image file name was used instead of the unique ID from the “control file”. This allowed batch processing of all images belonging to a sub-dataset (e.g., different waterbodies or core section) without the need to manually change the control file (i.e., change the unique ID) for each bulk image or perform segmentation testing separately for each image. As a picking tray was used as the background during imaging, the background was insufficiently dark and sometimes contained scratches, irregularities, or particles (e.g., dust, fiber, sediment), which obstructed outline detection. To account for this, an additional step was implemented in which, after segmentation in the final mode, the image background was set to black, prior to saving each object as a single file. This step was necessary to ensure more accurate outline detection in the subsequent run2dmorph execution (Fig. 3). For each processed image, a “settings file” was generated, providing an overview image that displays all identified objects with assigned numbers and individual segmented images of each object labeled with its corresponding number and associated object-specific information from the control file.
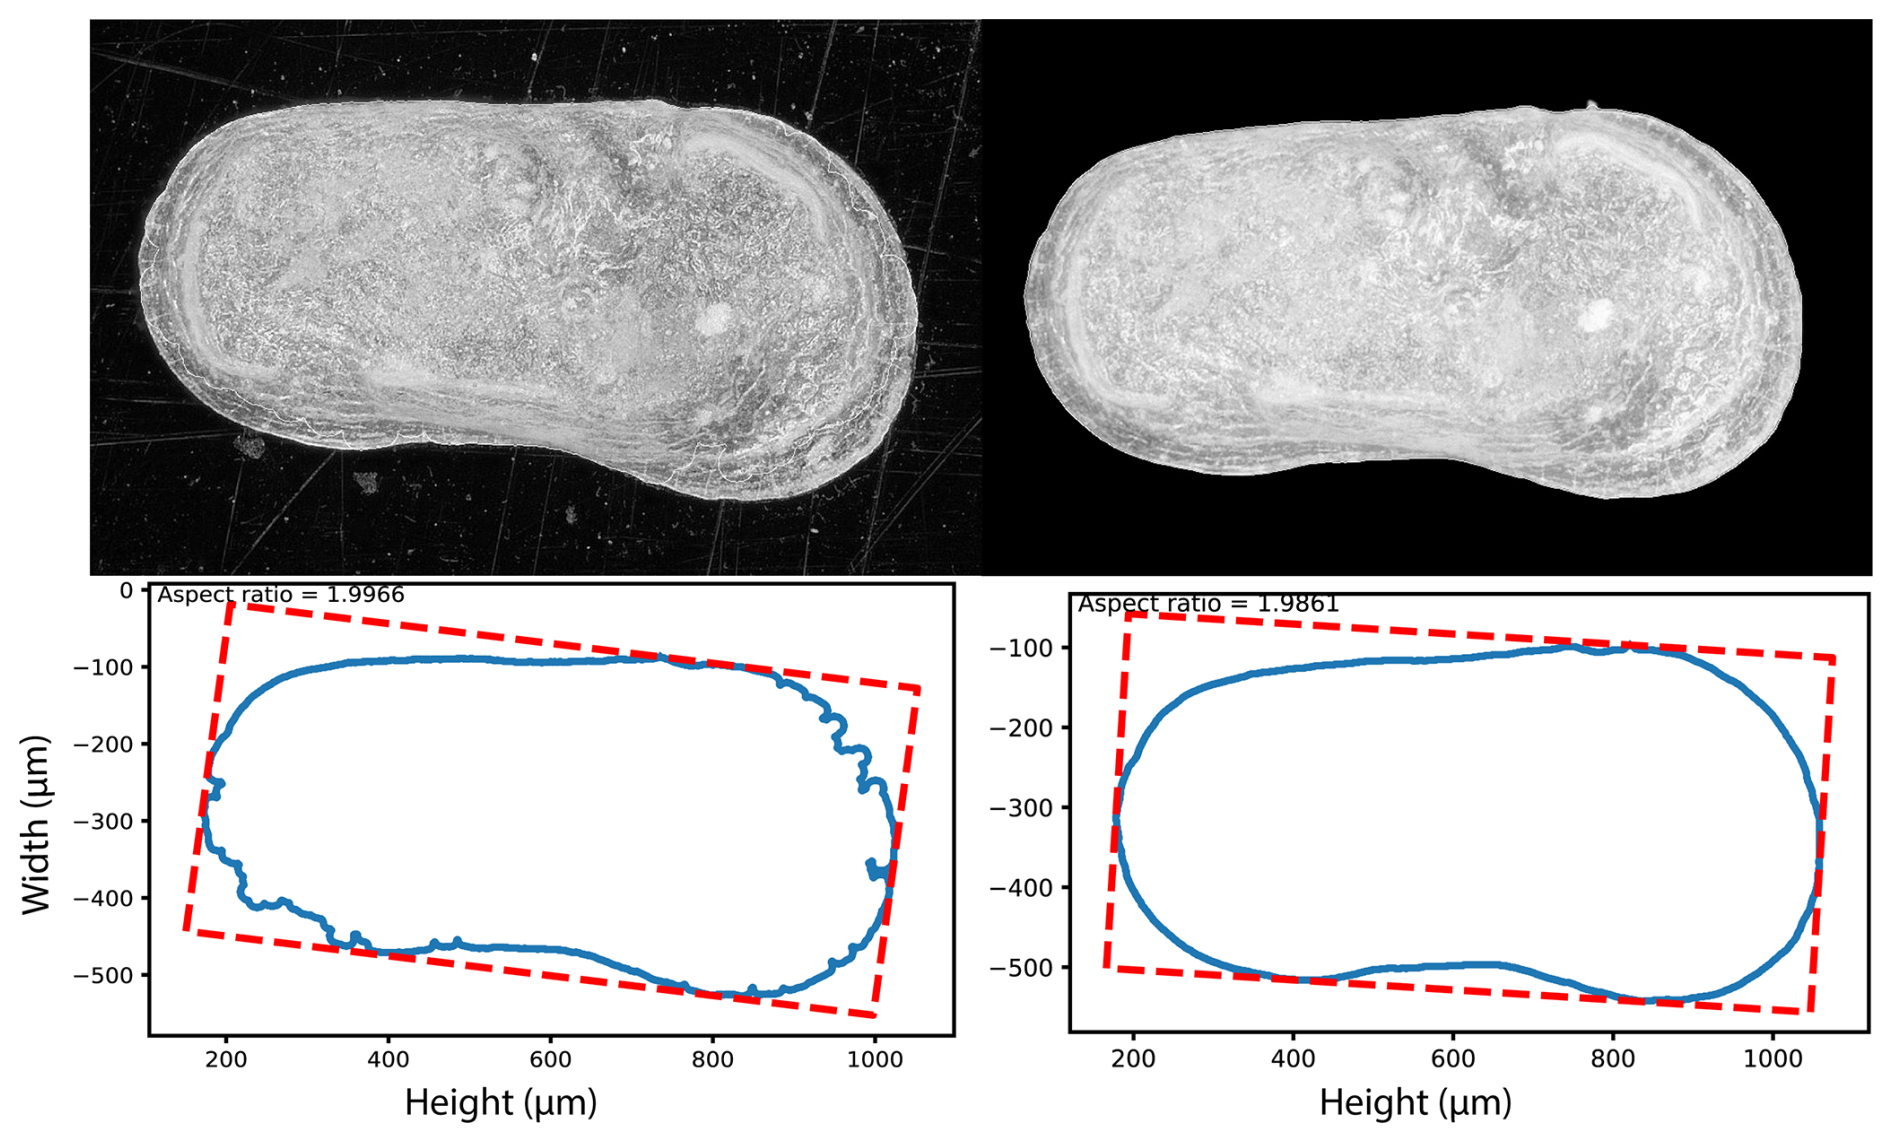
Figure 3Comparison of outline extraction before (left panels) and after (right panels) black background.
The segmented images were used as input for the run2dmorph module. This module was created to detect object outlines through pixel brightness, extract the outline, measure object parameters (like area, major and minor axes, height, and width), and place a predefined number of points along the outline. Several modifications were implemented in this module to enable subsequent geometric morphometric analyses of ostracod valves. For analyses of valve shape using outlines, it is crucial that the coordinate points are consistently positioned and follow the same directional sequence. The number of coordinate points, describing each specimen's outline, was set to 100 in the settings file. However, the outline orientation differs between left and right valves. For left valves, the starting point was defined at the maximum anterior margin on the left side of the image, proceeding counterclockwise along the dorsal margin. In contrast, for right valves, the maximum anterior margin is located on the right side of the image, and the point sequence runs clockwise along the dorsal margin. In order to account for these orientation differences, two separate run2dmorph scripts were created, one for left valves and one for right valves. The run2dmorph output includes folders containing files for aspect ratio, coordinates, intermediates, and outlines, as well as for the settings used for each run. Additionally, a summary file was generated, listing specimen-specific parameters such as SampleID, ObjectID, area, eccentricity, perimeter, major axis length, minor axis length, rugosity, height, width, and aspect ratio.
The automated height and width measurements of the object correspond to the length and height of the ostracod valves, respectively. These measurements were exported in a CSV output file and directly used from the summary file without further modification. For subsequent analyses of the coordinate data, several adjustments were required. The run2dmorph module produced a CSV file for each successfully segmented specimen, containing the specified quantity (100 in this study) of coordinate points describing the valve outline. However, most geometric morphometric software requires a single file that includes all specimens from a dataset (e.g., a TPS file used in tpsRelw; Rohlf, 2015), meaning that all of the specimen files must be merged into a single file. Additionally, the outline coordinates were further processed as sliding semi-landmarks. For this approach, fixed landmarks are required to provide the reference points between which the semi-landmarks can slide. Therefore, an additional Python script was developed to read the coordinate CSV files for each specimen and to identify the maximum rightmost and leftmost points, which serve as fixed landmarks (LM1 and LM2), depending on the valve side. The 100 outlined coordinate points are listed sequentially, resulting in a set of a total of 102 coordinate points per specimen.
The resulting dataset can be used for a generalized procrustes analysis (GPA) of the coordinates, for instance, in tpsRelw (Rohlf, 2015) or within the R packages geomorph (Adams et al., 2025) or gmShiny (Baken et al., 2021).
3.2 Technical validation
Object selection: bulk images of the sub datasets were first processed in the segment module using the sample mode. According to the chosen threshold settings, a series of images were generated in which all detected objects were boxed and numbered. These images were visually inspected to verify which and how many objects were successfully identified under the given settings. If too few objects were detected, the parameters were adjusted accordingly to optimize segmentation performance. Each boxed image was visually checked to ensure that the majority, if not all, specimens were correctly identified and segmented before proceeding to the final processing step.
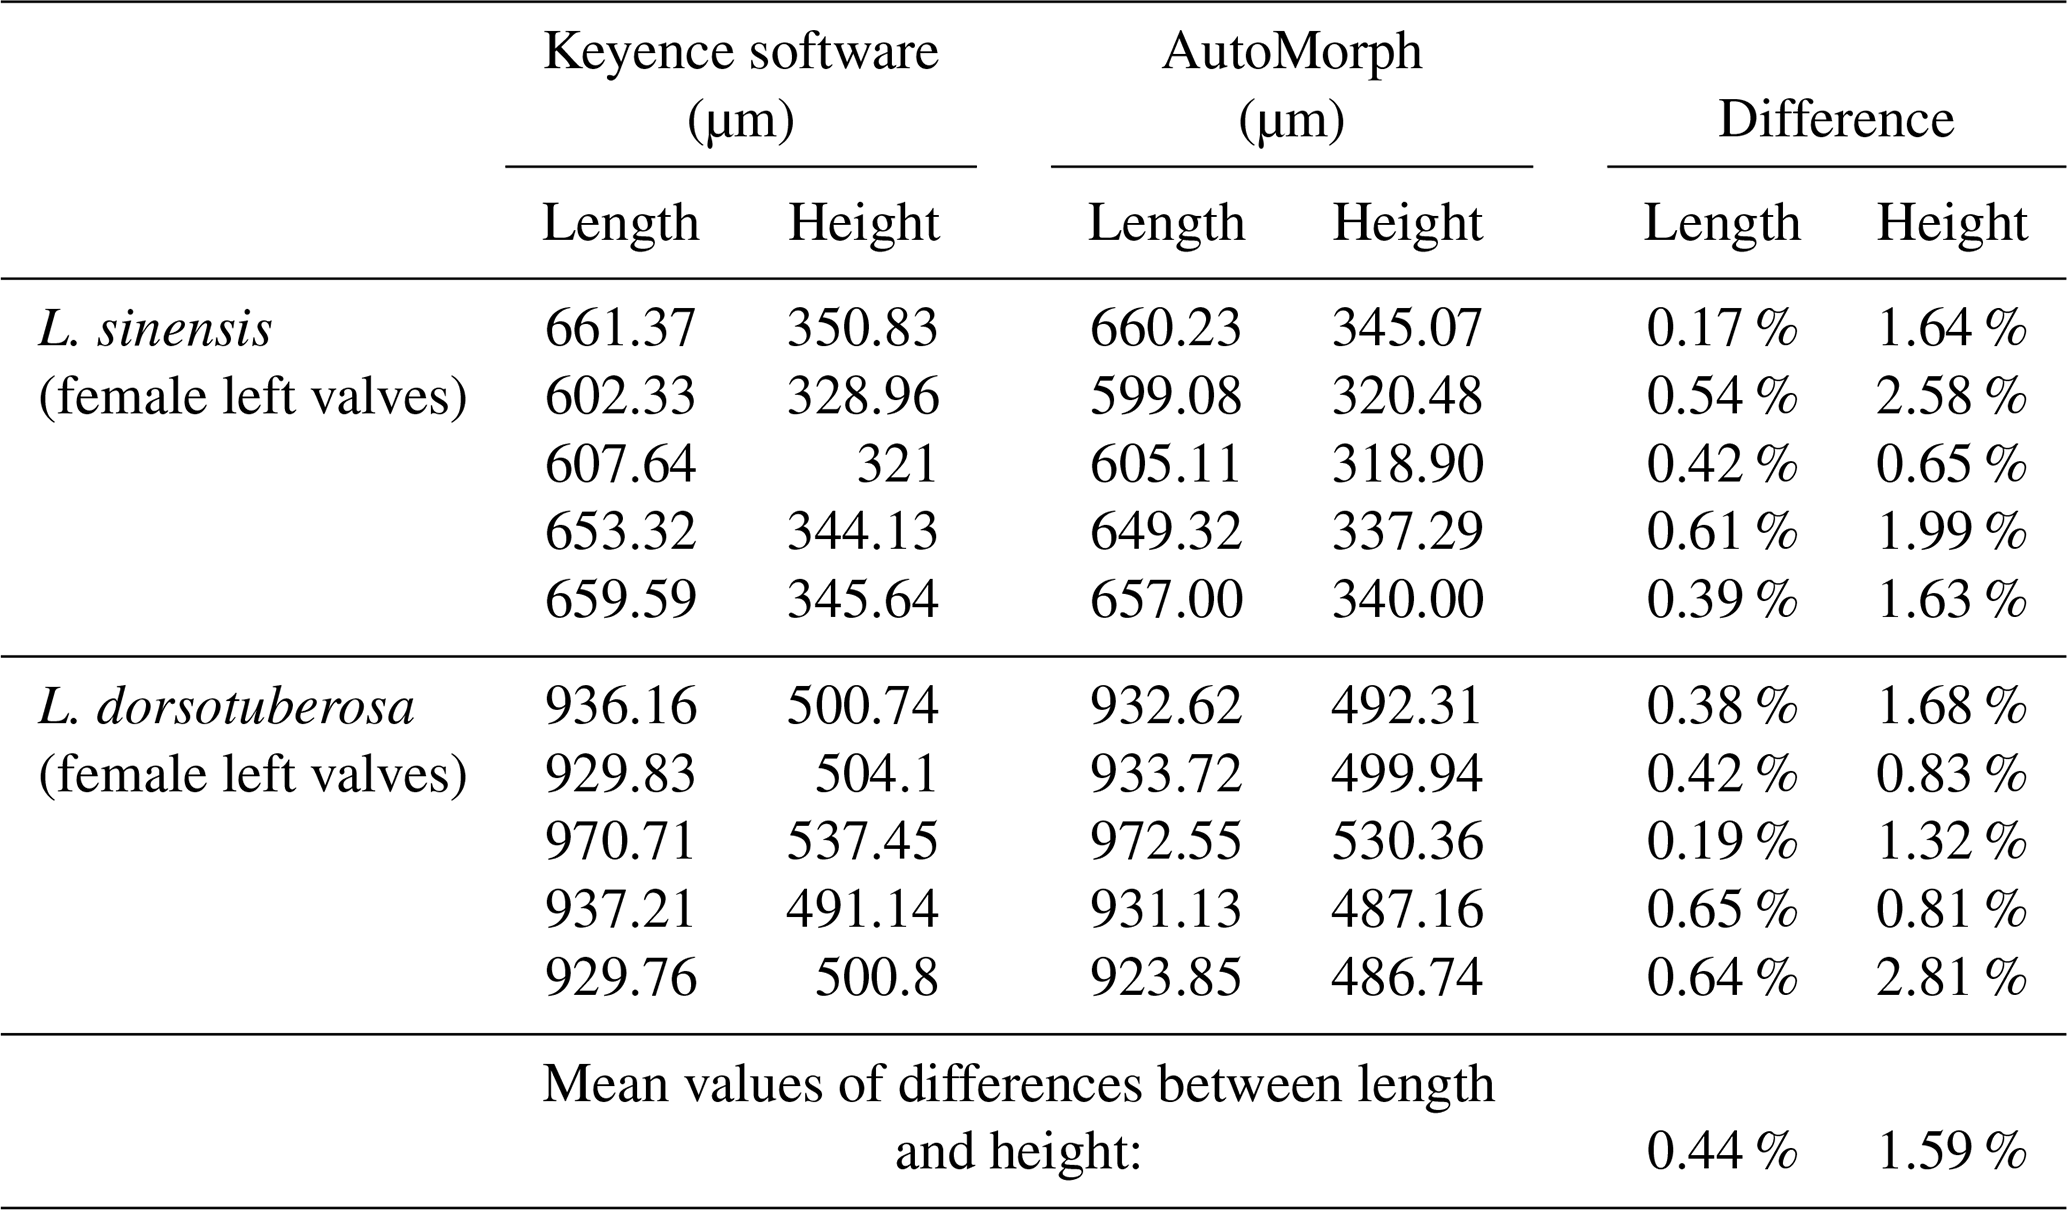
Table 2Comparison of automated and manual size measurements of 10 randomly selected valves. Length and height of each valve were measured manually using the Keyence VHX-7000 microscope software and compared to automated size measurements from run2dmorph.
Outline extraction: the outline extraction of the run2dmorph module generates images displaying the extracted outlines superimposed on the original specimens. This output allows visual verification of the accuracy of outline extraction for each specimen. Due to the additional function implemented in our modified segment module, which replaces the image background with black, outline extraction was consistently successful and did not produce false or incomplete contours for any specimen.
Size and shape measurements: the accuracy of size measurements was validated by comparing automated measurements from AutoMorph with manual measurements performed using the Keyence VHX-7000 microscope and its integrated measurement software. Automated and manual measurements were comparable, with an average deviation of less than 2 % (Table 2). For the shape measurements, the coordinate order and orientation were verified by inspecting the coordinate outputs for the first three specimens of each sub-dataset. The correctness of the semi-landmark configuration and point direction was further confirmed using thin-plate-spline (TPS) deformation grids for visualization, which demonstrated consistency across specimens.
3.3 Statistical analyses
Normality of length and height was assessed for each subset (female/male, LV/RV) using the Shapiro–Wilk's test, and multivariate normality for the combined data was evaluated with the Henze–Zirkler test. To test for significant differences, we applied a permutational multivariate analysis of variance (PerMANOVA) as the normality assumption was not met (L. dorsotuberosa). All analyses were performed in R using the MVN package (version 6.2, Korkmaz et al., 2014) and the vegan package (version 2.8, Oksanen et al., 2026).
We used the R package geomorph (version 4.0.10, Adams et al., 2025) to perform a GPA on the 102 generated coordinate points to align all specimens. The TPS deformation grids were generated to visualize shape changes. Principal component analysis (PCA) was conducted based on the procrustes coordinates to explore the morphospace variability within and among species and sexes. Finally, the coordinates for all specimens are merged into a single tps file. The “sliders file”, used to determine the sliding direction of the semi-landmarks, was created in TpsUtil v. 1.82 (Rohlf, 2015). Procrustes analyses of variance (procrustes ANOVA) and linear discriminant analysis (LDA) were used to test for significant differences between the sub-datasets on the first 15 components.
To identify undersampling or oversampling of coordinate points and to assess the robustness of the morphological characterization, we applied the Landmark Sampling Evaluation Curve (LaSEC) function of the LandMark-Based Data Assessment (LaMBDA) R package (Watanabe, 2018) on the left- and right-valve datasets.
The result of LaSEC shows that approximately 80 landmarks (fit = 0.99) are sufficient for characterizing shape variation in left and right datasets (Fig. 4).

4.1 Size variability
Generally, L. dorsotuberosa valves are larger than those of L. sinensis (Table 1, Fig. 5). Valves of L. dorsotuberosa males are generally shorter and narrower than those of females, while, in L. sinensis, male valves are larger in length and height. Size differences and the separation into males and females are more pronounced for L. dorsotuberosa than for L. sinensis. Left and right valves of both males and females of L. dorsotuberosa are similar in their size distribution, while differences in the left and right valves of both sexes of L. sinensis are more pronounced (Table 1).
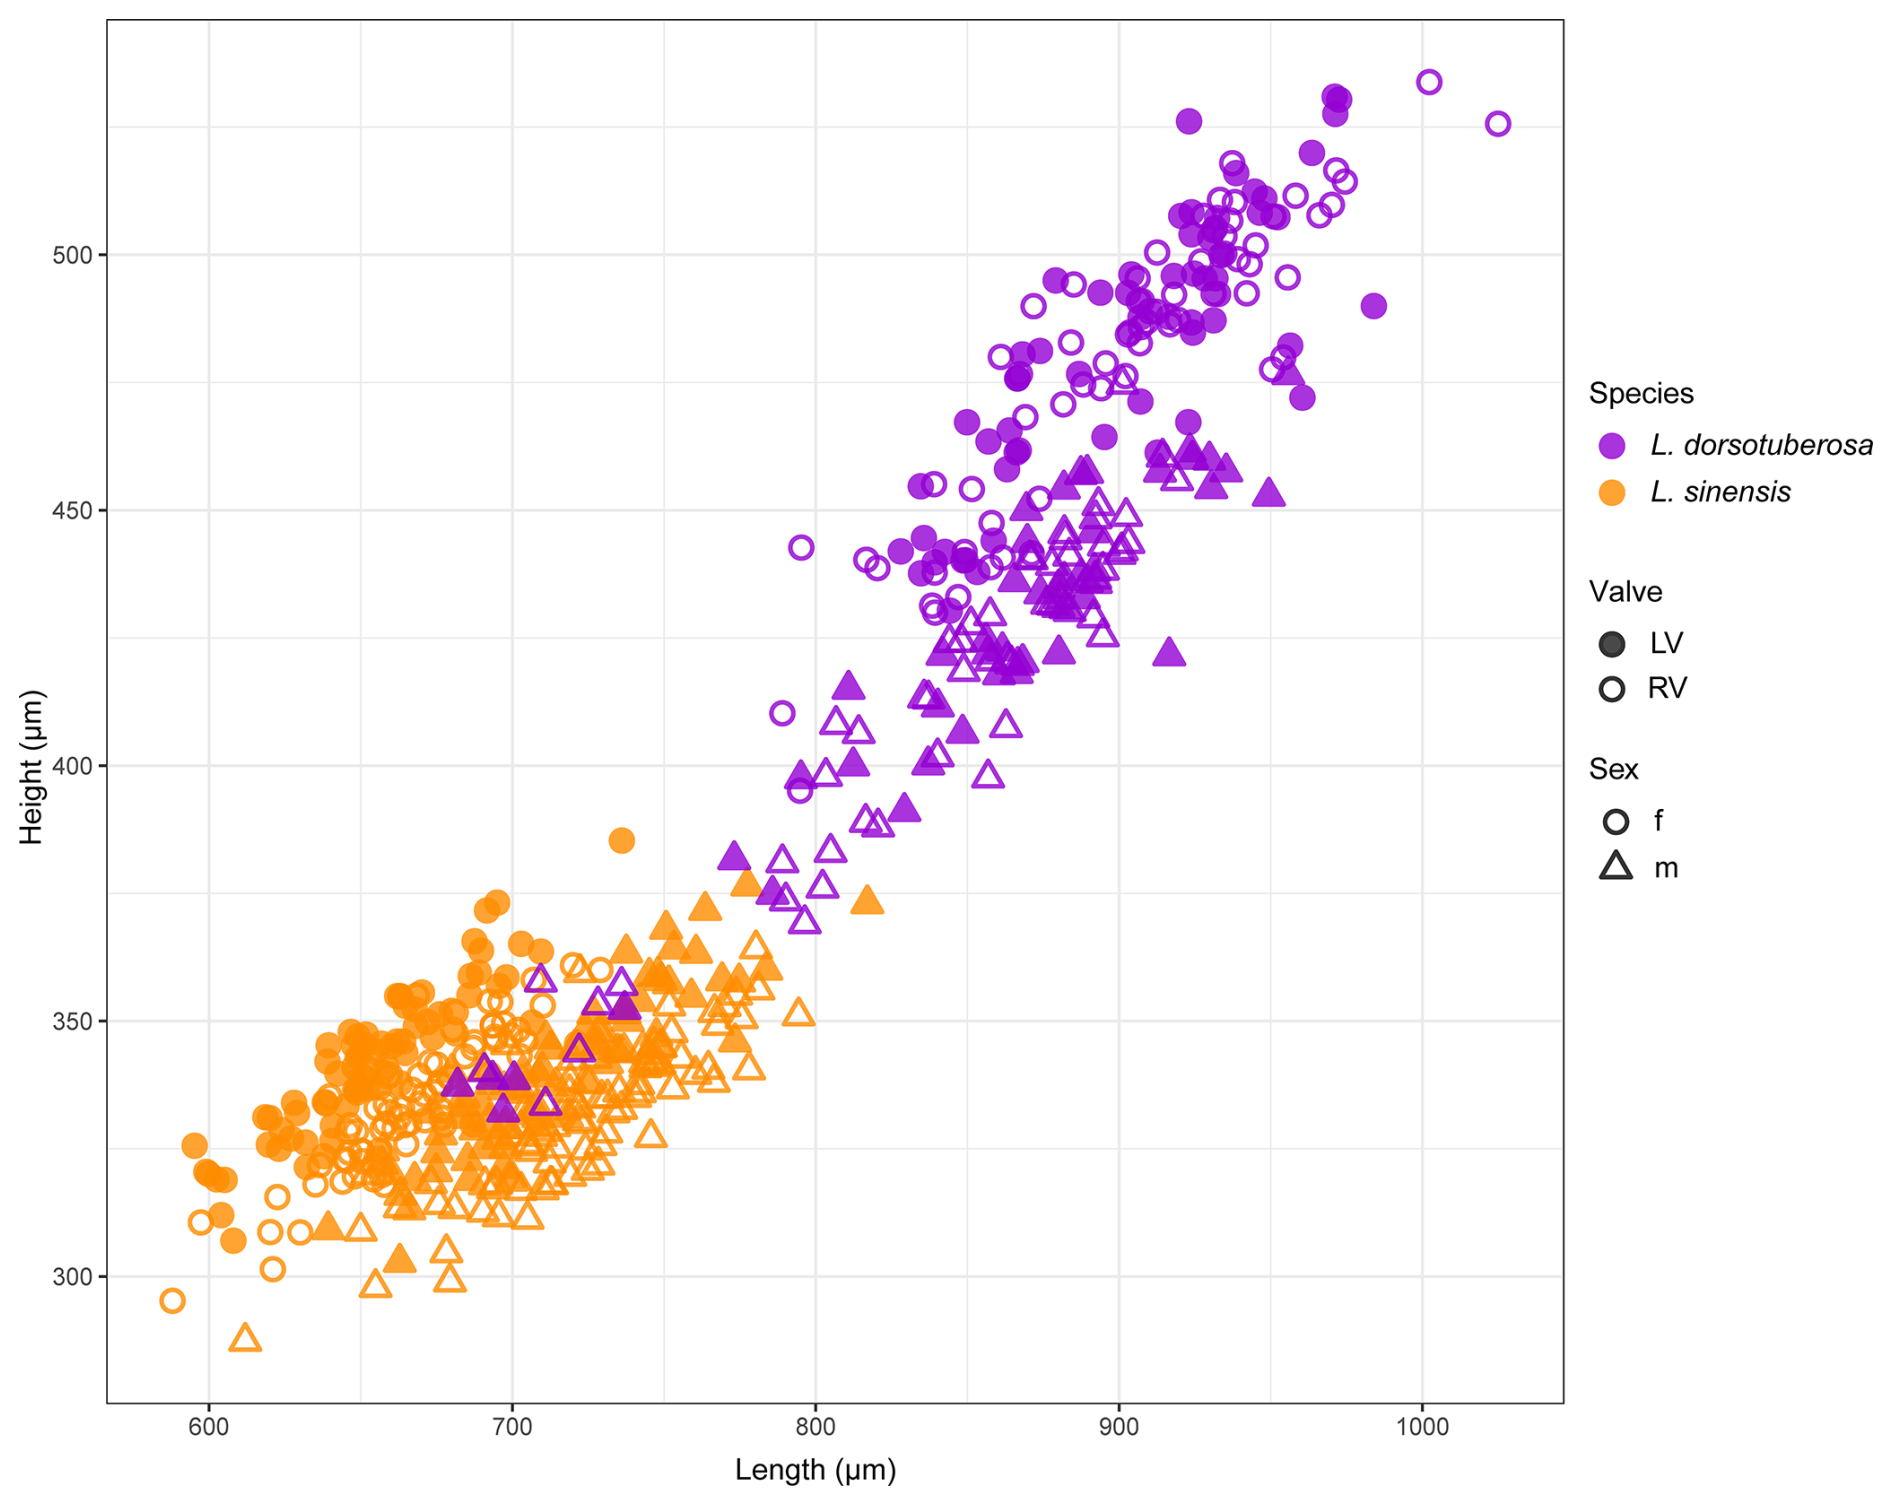
Figure 5Length and height plots for female and male left and right valves of L. sinensis and L. dorsotuberosa.
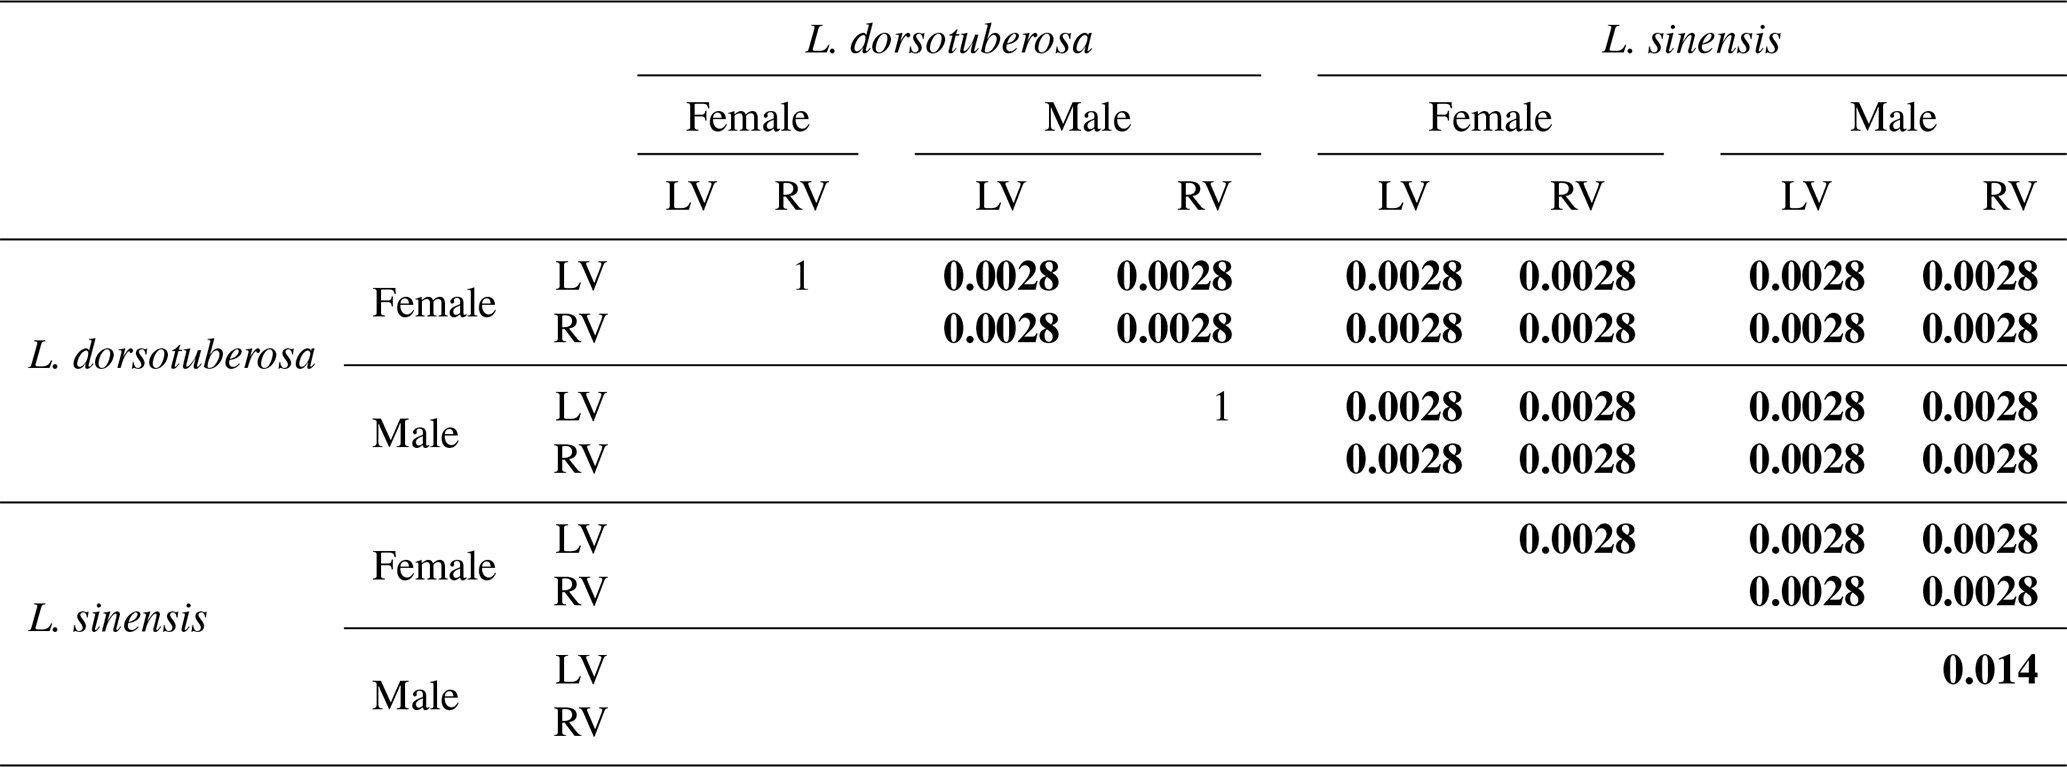
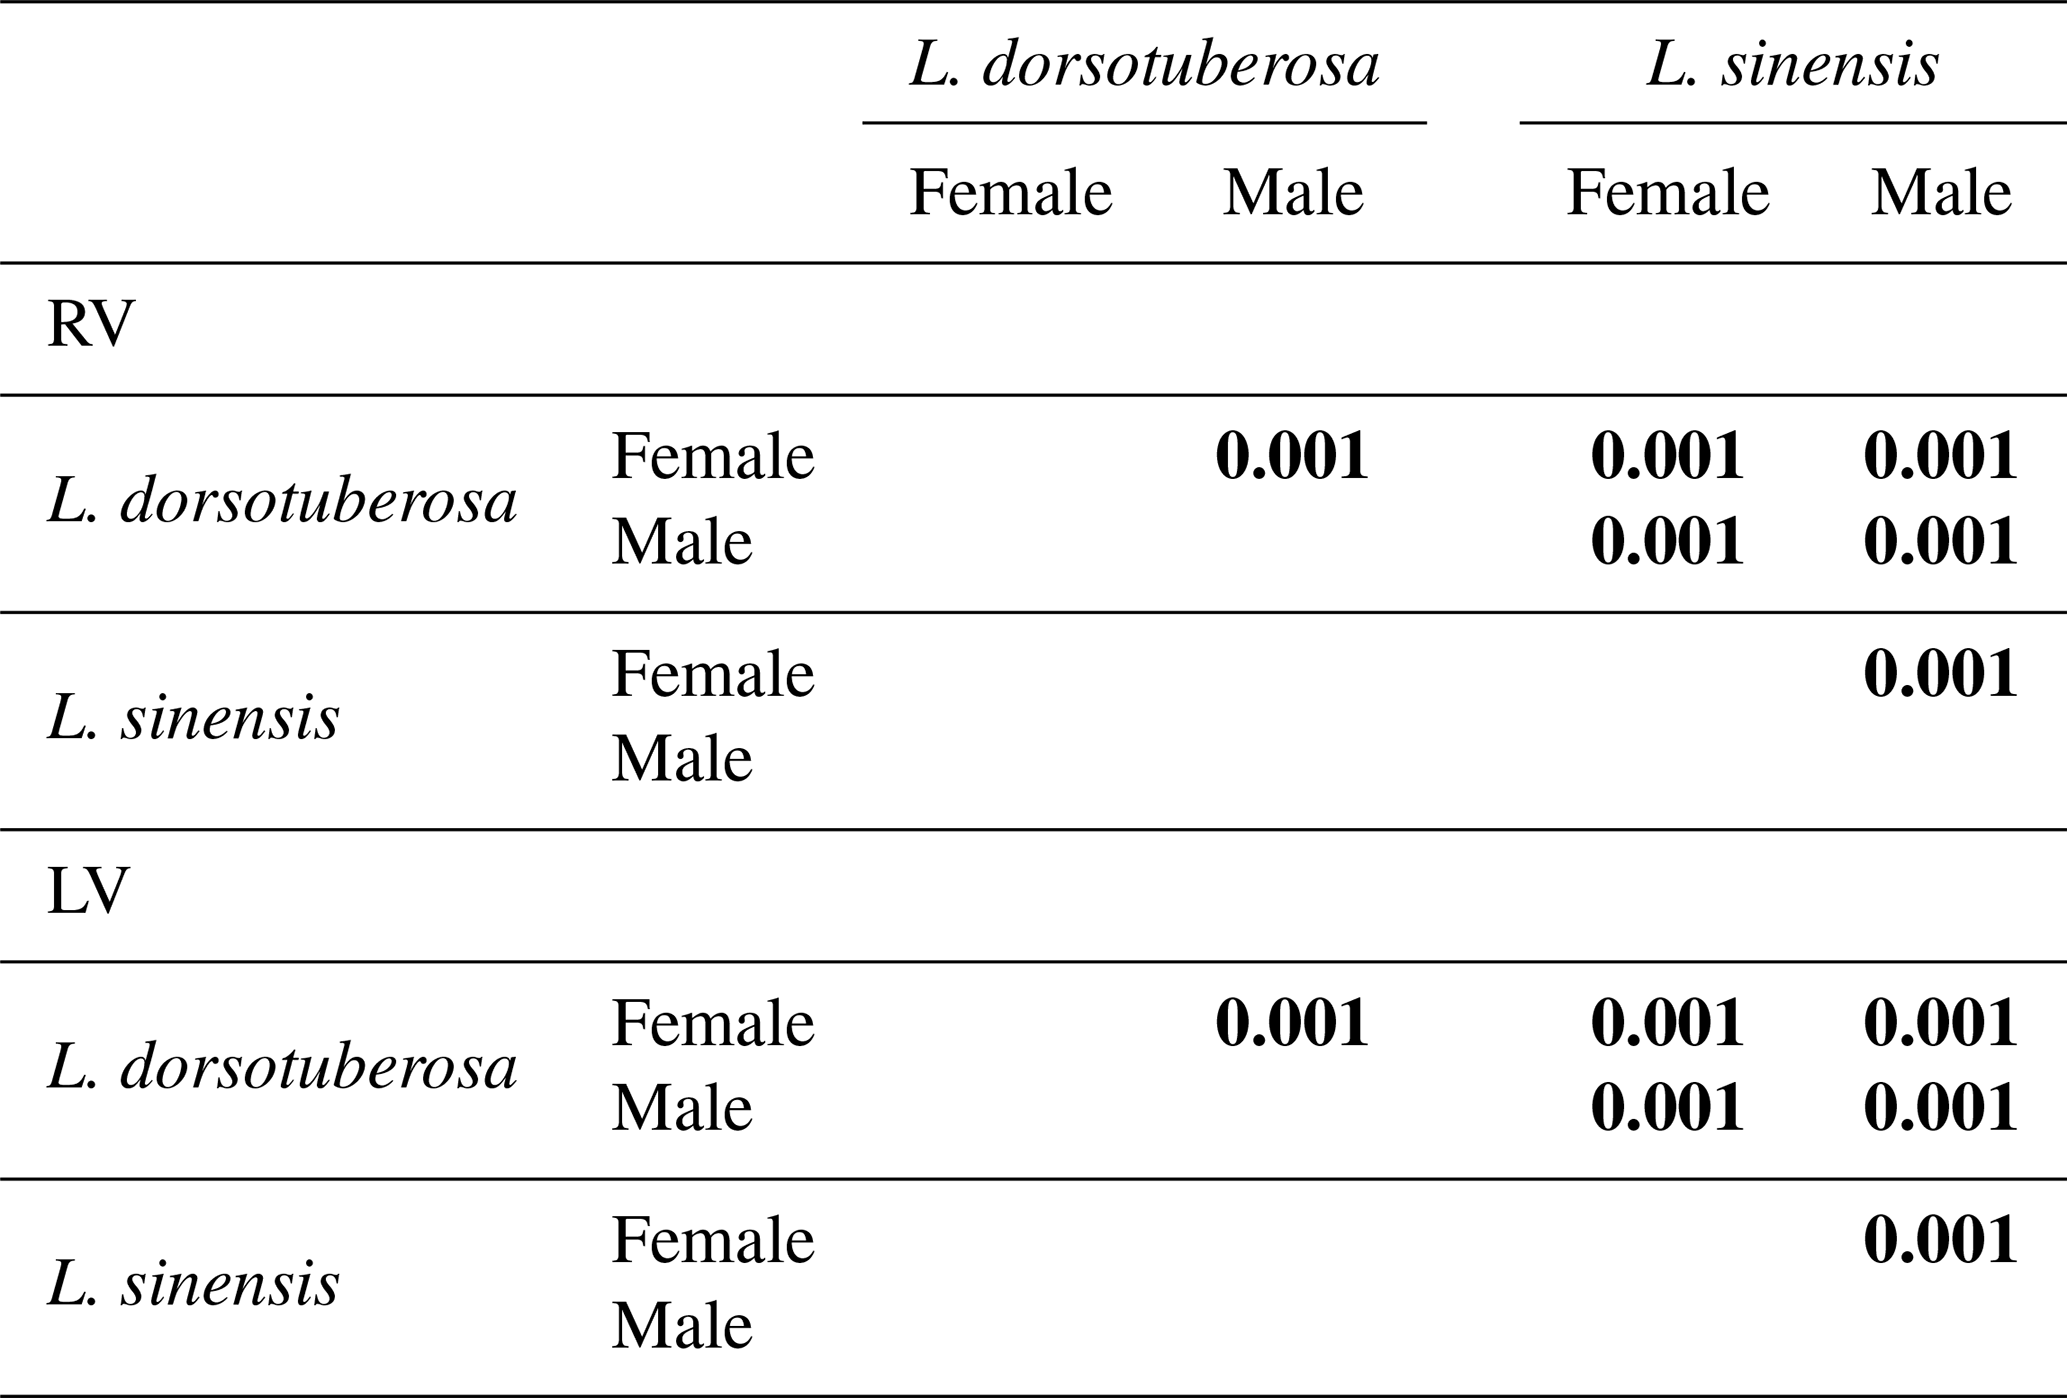
According to Shapiro–Wilk's test, all datasets of L. sinensis exhibit a normal distribution, while L. dorsotuberosa shows a non-normal distribution, with exceptions regarding the height of female left valves and the length of female right valves (Table 3a). The Henze–Zirkler test for multivariate normality exhibits normal distribution data for L. sinensis and non-normal distribution data for L. dorsotuberosa (Table 3b). The Bonferroni-corrected p values of the PerMANOVA show that all investigated groups (species, sex, and valve side) are significantly different from each other, except for female left and right valves and male left and right valves of L. dorsotuberosa (Table 4).
Table 3Overview of (a) Shapiro–Wilks's test for univariate normal distribution for, separately, the length and height of male and female left (LV) and right (RV) valves of L. dorsotuberosa and L. sinensis and (b) Henze–Zirkler test for multivariate normal distribution of valves for, separately, species, sex, and side.
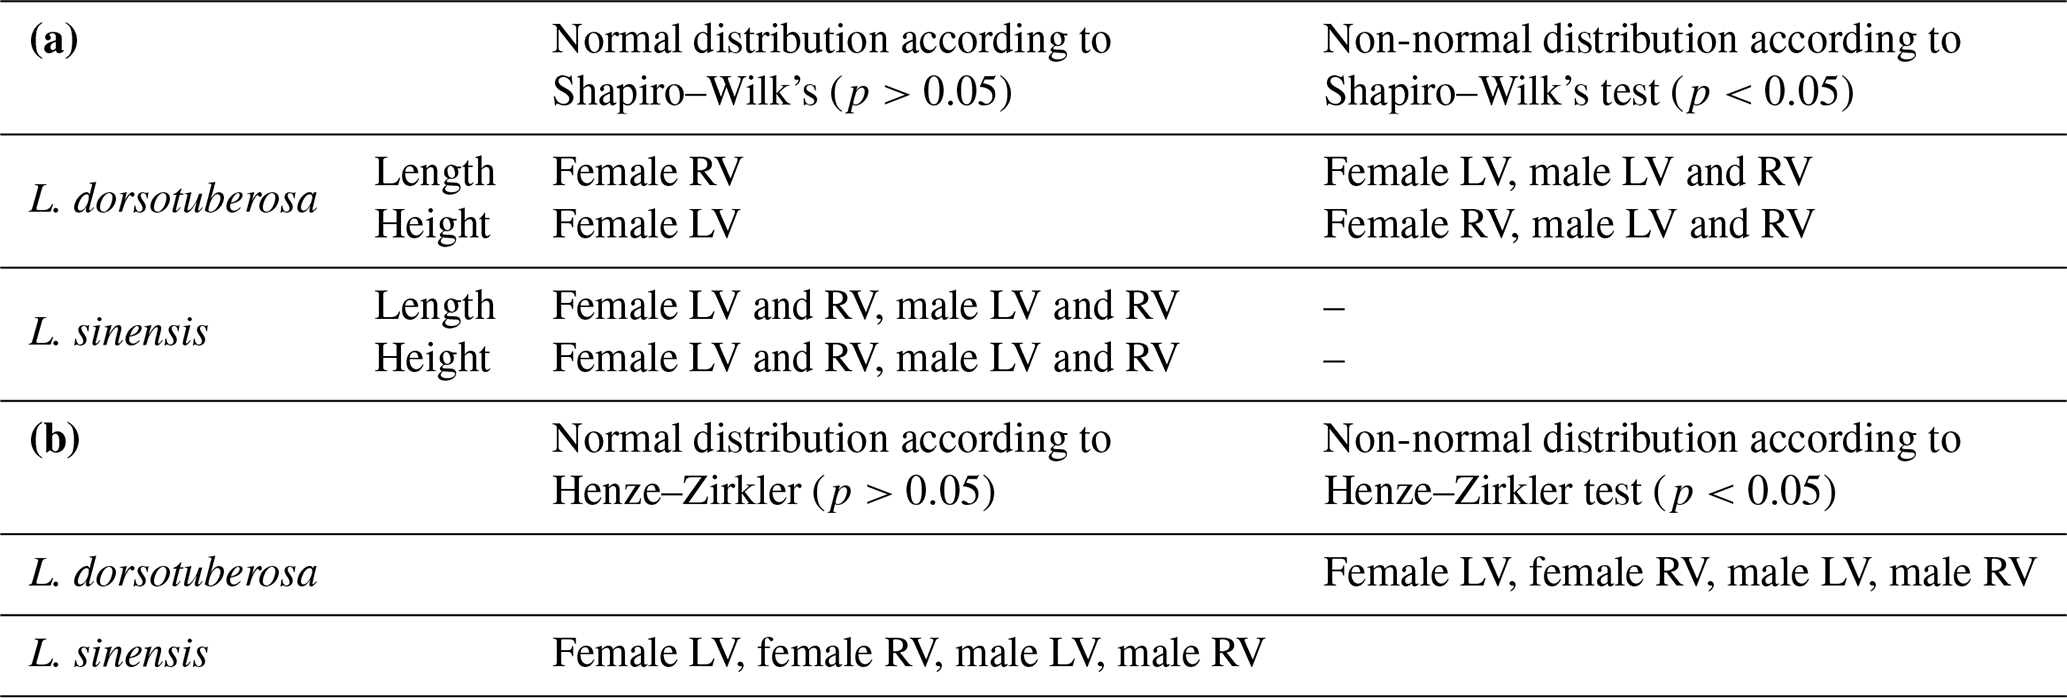
Table 4Bonferroni-corrected p values of the PerMANOVA of length and height for all datasets (species, sex, and side). Statistically significant differences are highlighted in bold.
4.2 Shape variation
The PCA reveals clear distinction between adult specimens of species and sexes in both left and right valves despite minor overlap (Figs. 6 and 7). For left valves (LVs), the first three principal components (PC) explain 51.99 %, 14.77 %, and 7.41 % of shape variation, while right valves (RVs) account for 60.81 %, 13.4 %, and 6.36 %.
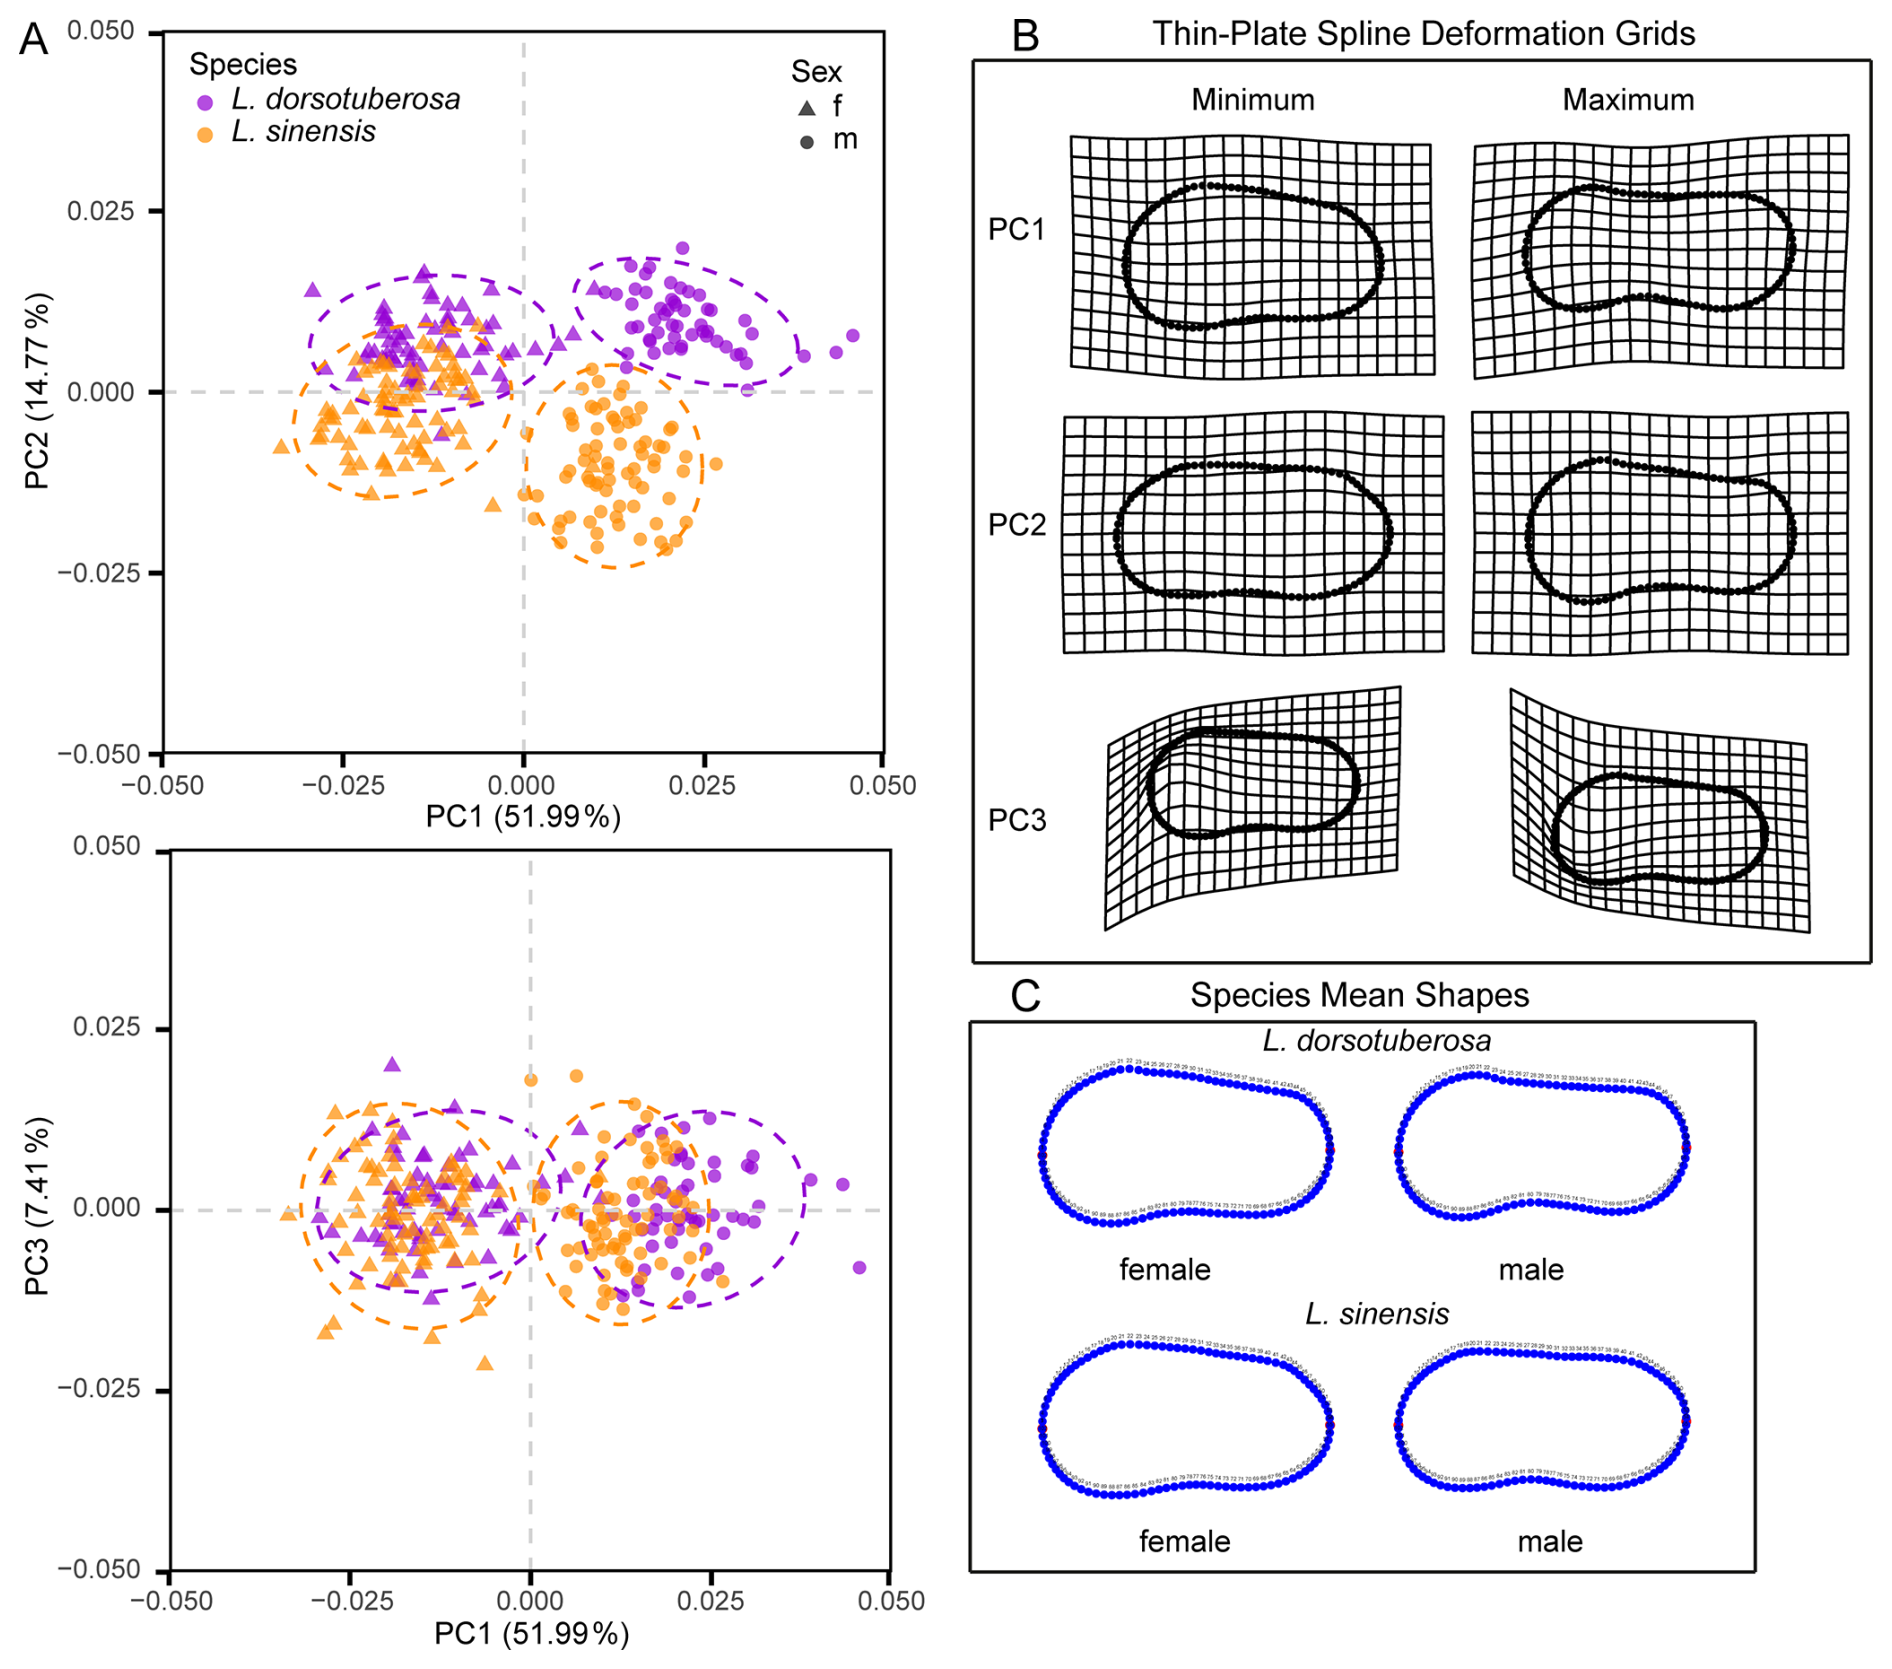
Figure 6Principal component analyses of the shape variability of male and female left valves of L. dorsotuberosa and L. sinensis (A). Thin-plate-spline deformation grid (B) and mean shapes (C) of left valves of male and female L. dorsotuberosa and L. sinensis.
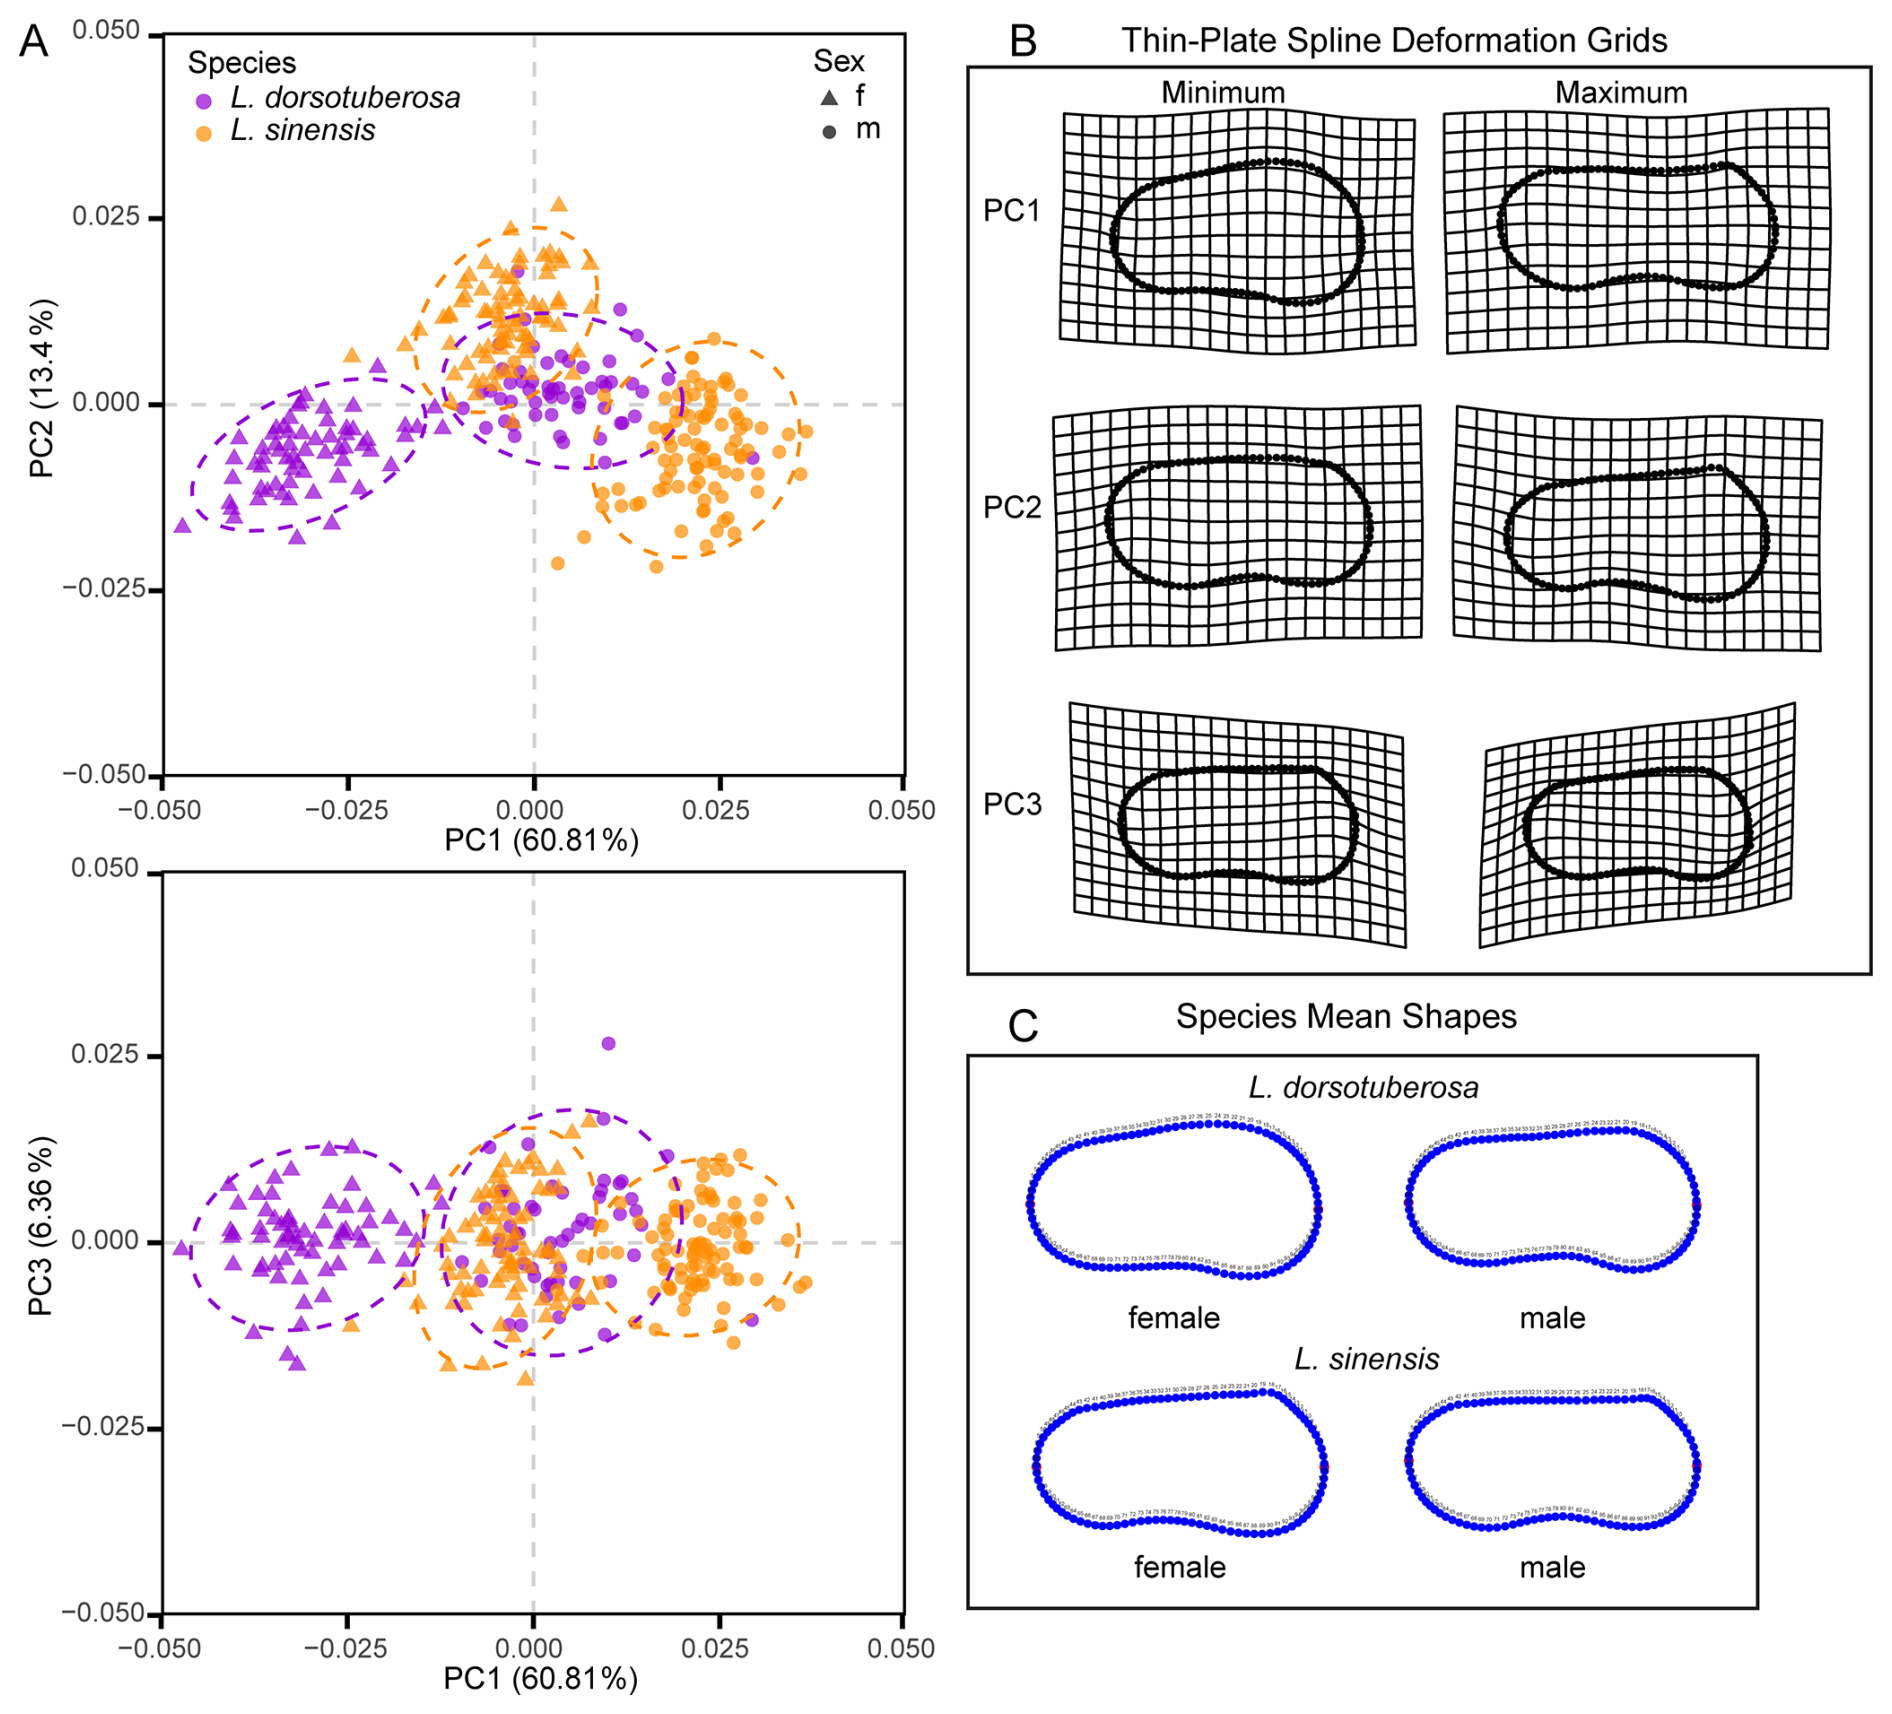
Figure 7Principal component analyses of the shape variability of male and female right valves of L. dorsotuberosa and L. sinensis (A). Thin-plate-spline deformation grid (B) and mean shapes (C) of right valves of male and female L. dorsotuberosa and L. sinensis.
Regarding left valves, PC1 primarily differentiates between sexes, with positive values being associated with males and negative values being associated with females, whereas PC2 distinguishes between species, with L. dorsotuberosa at positive scores and L. sinensis at negative scores (Fig. 6a). Thin-plate-spline deformation grids reveal that negative PC1 scores correspond to shorter specimens with steep, straight dorsal margins and concave ventral margins (Fig. 6b). Conversely, positive scores indicate elongated, narrow forms with strongly concave dorsal margins and sigmoidal ventral margins. The comparison with the mean shapes (Fig. 6c) of the sub-datasets confirms that these extremes align most closely with female L. sinensis (negative scores) and male L. dorsotuberosa (positive scores). Along PC2, negative values reflect elongated shapes tapering posteriorly, with straight dorsal and slightly sigmoidal ventral margins, while positive values show broader, rounded anterior regions with steep dorsal and strongly concave ventral margins, corresponding to male L. sinensis and female L. dorsotuberosa, respectively. PC3 primarily captures variations in LM1 positioning, shifting upward (negative) or downward (positive).
Right valves, similarly to left ones, differentiate sexes along PC1 and species along PC2, though this pattern is less distinct due to the centered position of L. dorsotuberosa males (Fig. 7a). PC1 distinguishes short specimens with broad anterior regions, tapering posteriorly, and steep dorsal margins (negative) against strongly elongated specimens with straight dorsal and sigmoidal ventral margins (positive), matching female L. dorsotuberosa and male L. sinensis as endmembers (Fig. 7b and c). PC2 opposes slightly convex dorsal with strongly sigmoidal ventral margins (negative) to broader anterior forms tapering rearward with steep dorsal margins (positive), corresponding to male L. dorsotuberosa and female L. sinensis. As in left valves, PC3 reflects upward or downward shifts in LM1 position.
The LDA based on the first 15 principal components of the full dataset clearly distinguished species and sexes for both valves. For left valves, the first axis separated the species, while the second axis discriminated between the sexes (Fig. 8). The right valves also show clear species- and sex-level separation but with a slightly different pattern: the first axis again differentiates the species, whereas the second axis differentiates only male from female L. sinensis, with both sexes of L. dorsotuberosa showing more similar shapes (Fig. 9). Procrustes ANOVA confirms that group means differ significantly for both valves (Table 5).
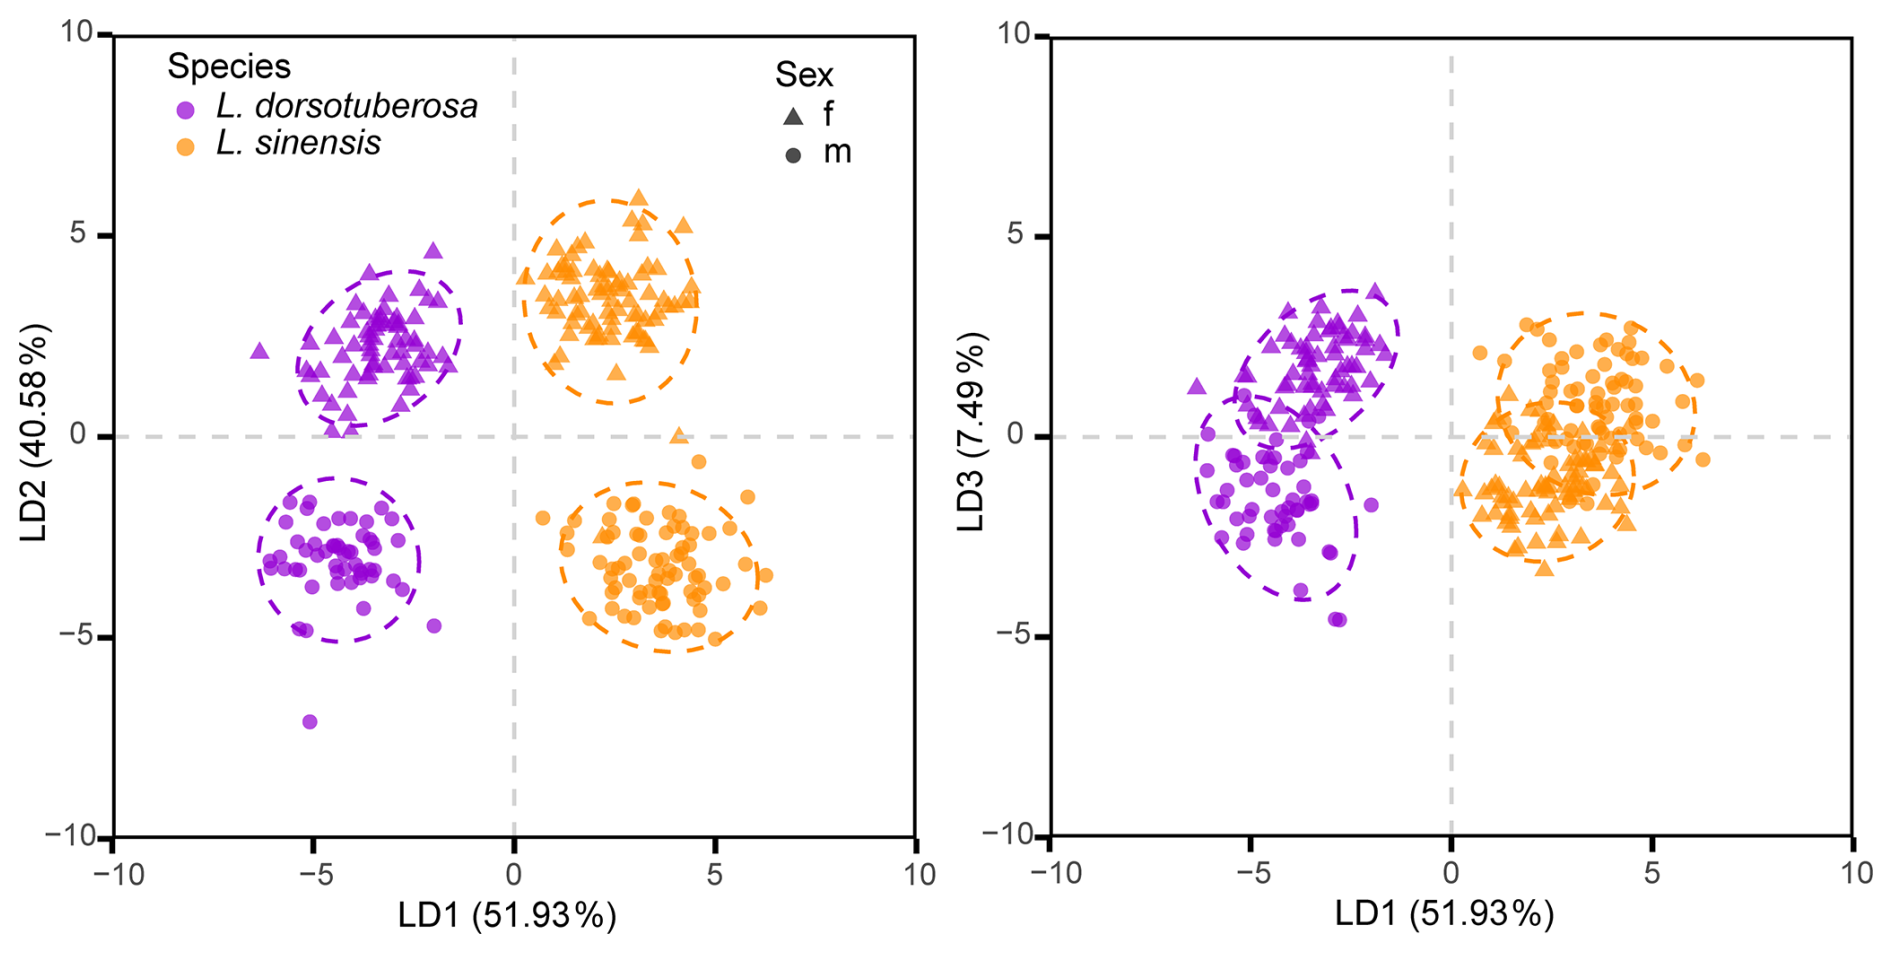
Figure 8Linear discriminant analysis of male and female left valves of L. dorsotuberosa and L. sinensis.
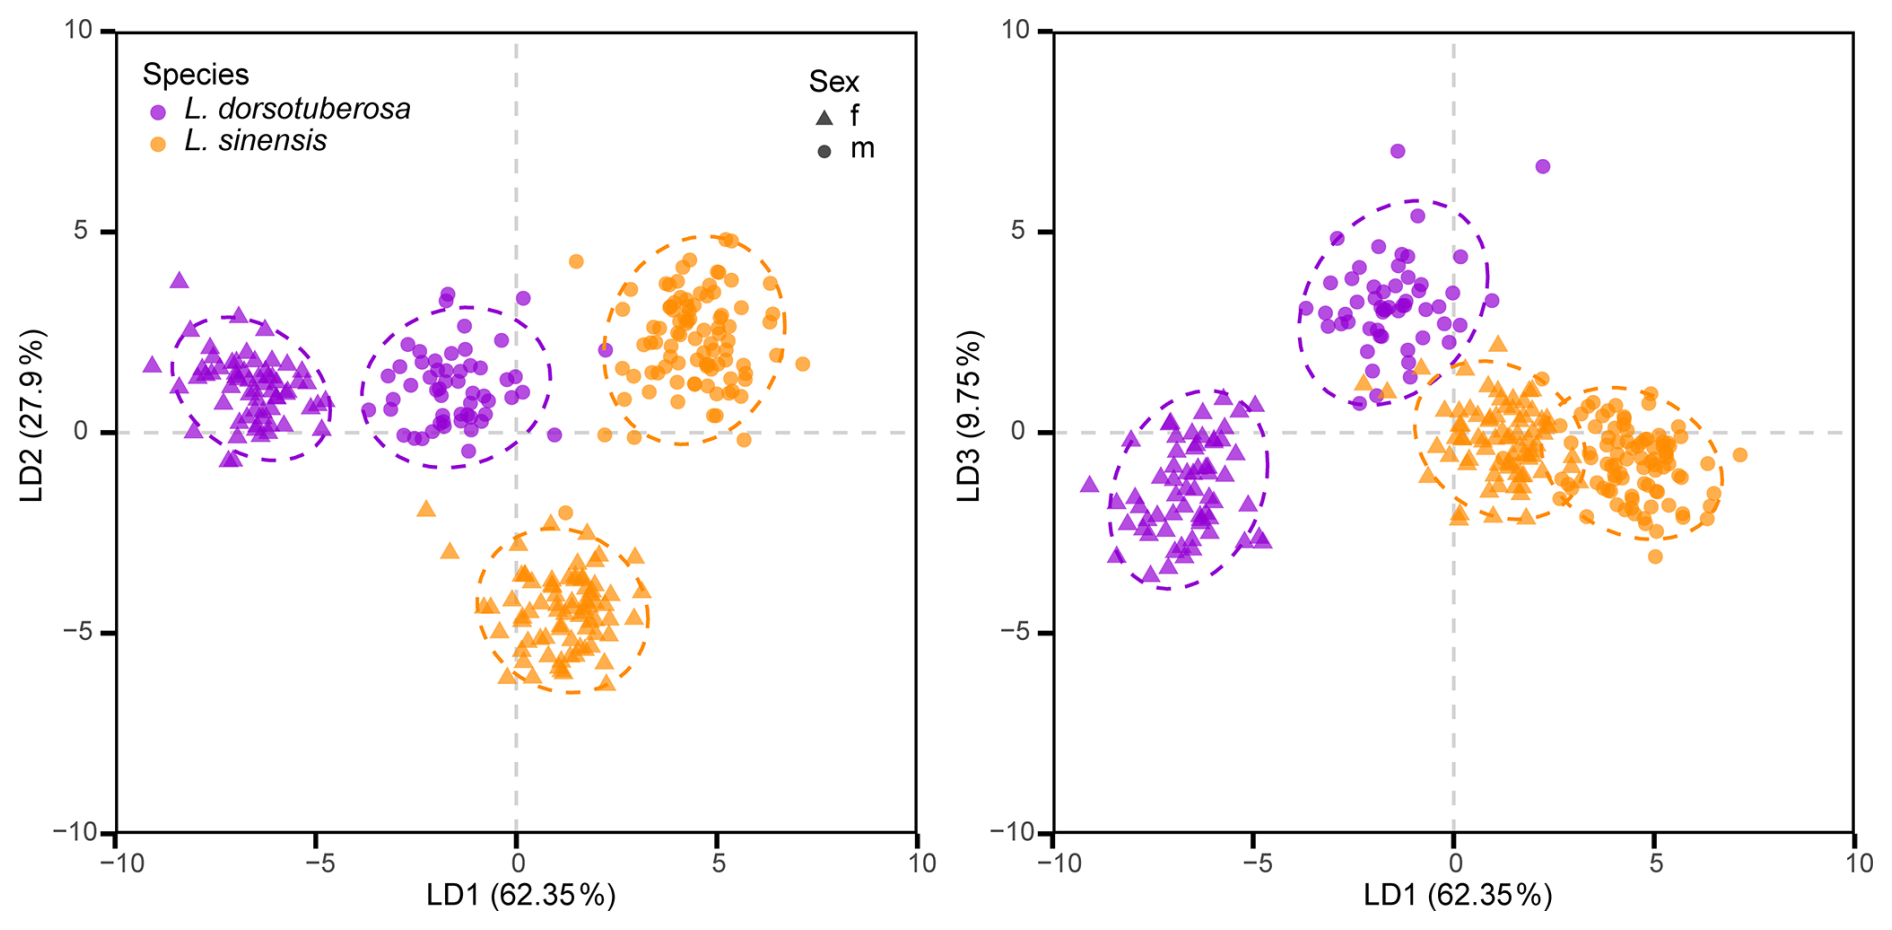
Figure 9Linear discriminant analysis of male and female right valves of L. dorsotuberosa and L. sinensis.
Table 5Pairwise comparison of the procrustes ANOVA p values for all datasets (species, sex, and side). Statistically significant differences are highlighted in bold.
This study demonstrates that automated data acquisition of size and shape data can be successfully applied to ostracod valves. The technical validation of the method confirms that outline extraction works precisely and results in clear differentiation between species and sexes, confirming that the method provides results comparable to previous studies employing manually digitized landmarks and semi-landmarks (Wrozyna et al., 2016). These findings validate the application of AutoMorph to ostracod morphometrics and establish a basis for spatial and temporal large-scale analyses.
5.1 Biological and ecological implications
The distribution of the data (normal vs. non-normal) is inconsistent among the individual datasets (species, males, females, left and right valves) and traits (length, height). Several factors may contribute to this variability: (1) environmental differences among waterbodies, (2) morphological differentiation between left and right valves, and (3) sex-specific morphological patterns.
In the present dataset, individuals originate from different waterbodies where varying conditions may influence specimen size and lead to the occurrence of distinct morphotypes between and/or within waterbodies, as has been documented for C. torosa (Hoehle et al., 2025a; Wrozyna et al., 2022). Furthermore, in L. sinensis and L. dorsotuberosa, the degree of differentiation between species and sexes differs between left and right valves. Similar observations have been reported in previous studies on various taxa, for example, at the population level in Cytheridella and C. torosa (Hoehle et al., 2025b; Wrozyna et al., 2016, 2022). Although the reasons for these pronounced differences between left and right valves remain unclear, these findings indicate that both left and right valves (and both sexes) should be examined as they capture different morphological patterns. Differences between the sexes can be attributed to differences in development due to the different reproductive roles between the sexes, as is known from other groups of organisms. These can also vary in expression between species.
The spatial distribution of ostracods from the Tibetan Plateau has already been investigated through multi-year sampling campaigns (Akita et al., 2016; Mischke et al., 2007; Peng et al., 2013; Wang et al., 2022; Wrozyna et al., 2009; Zhang et al., 2013), but comparative studies between populations of different lake systems are widely missing so far. With nearly 10 000 water bodies (>0.01 km2) spread across a total area of approximately 2.5 ×10⁶ km2 (Chen et al., 2024), the Tibetan Plateau provides ideal conditions for studying and understanding morphological adaptations of species to different environmental conditions at a spatial scale. Previous studies have demonstrated that morphological variability in ostracods can be considerable, both within and particularly between habitats, although the underlying causes, whether genetic, environmental, or attributable to phenotypic plasticity, remain poorly understood. Despite the populations originating from distinct waterbodies and the intragroup variability (at the species and sex level) being substantial, the examined groups can nonetheless be clearly distinguished from one another. Whether the observed intragroup variability reflects differences in size and shape across waterbodies and whether these differences may be attributable to environmental factors warrant investigation in future studies. Such research would greatly advance our understanding of the drivers of morphological variability in ostracods more broadly while also considerably enhancing the applicability of the examined species as bioindicators.
Ongoing projects, such as the International Continental Scientific Drilling Program (ICDP) project NamCore, additionally offer the opportunity to investigate much longer temporal scales (Haberzettl et al., 2019; Adolph et al., 2026). Future studies can therefore offer the opportunity to focus on morphological differences among populations in relation to environmental parameters at a spatial scale, and, furthermore, the long-term evolution of morphological variability in ostracods can be examined using sediment core records.
5.2 Point density and outline representation
For manual approaches, placement of points along specimen outlines is extremely time-consuming, necessitating careful consideration of the optimal number of points required to capture shape without oversampling, a decision influenced by dataset size. The LaSEC results confirm that at least 80 coordinate points sufficiently represent shape, which can be easily and quickly achieved using the automated approach. Due to the scarcity of homologous points in our dataset and in non-marine ostracod valves in general, only 2 of the 102 coordinate points were defined as fixed landmarks, with 100 points designated as sliding semi-landmarks. The effect of treating all 102 points as landmarks in LaSEC analyses rather than differentiating between landmarks and semi-landmarks remains unclear (Watanabe, 2018). Given that automated data acquisition incurs no additional time costs with increased point numbers, we retained all 100 sliding semi-landmarks describing the valve outlines.
For most non-marine ostracods, the relatively smooth margins require comparatively few points to adequately capture the outline geometry. In contrast, marine taxa may require substantially more points due to their more complex morphologies. Hunt et al. (2017) placed 256 points, sometimes automatically but mostly manually, to describe the outline of several marine species as taxa such as Pterygocythereis nadeauae (Hill, 1955) possess margins with spines and denticles that greatly complicate outline capture. This further highlights the relevance of automated acquisition methods.
5.3 Reduction of observer bias and measurement error
During manual landmark digitization, landmark placement can vary between digitizers (inter-observer error) and between specimens for the same digitizer (intra-observer error) (Fox et al., 2020). Combined with other error sources (specimen placement, imaging device), deviations can exceed 30 % of the total variation in biological datasets (Fox et al., 2020). According to Fox et al. (2020), inter-observer error constitutes the largest contributor, followed by specimen placement and intra-observer error.
Automated coordinate generation along the outline drastically reduces these error sources as the automated output remains consistent across specimens. Consequently, the automated approach is substantially less subjective than manual size measurements or hand-placed landmarks and semi-landmarks, thereby enhancing accuracy and reliability. The modified segmentation module, which eliminates background noise and sharpens object–background boundaries, achieves a 100 % success rate in outline extraction. This is a notable improvement over the original implementation.
5.4 Time efficiency and workflow optimization
AutoMorph implementation yields substantial time savings in image processing, reducing task completion times of weeks or months to within hours, depending on dataset size. Technical validations and manual inspections, conducted during several processing steps (object selection, outline extraction), as well as comparison of automated and manual size measurements, confirm the accuracy and robustness of this method. This dramatic reduction in processing time enables morphometric analyses at scales previously impractical for ostracod research.
5.5 Methodological limitations
A primary limitation of this approach is the requirement for specimens with optimal preservation. In manual methods, small fragments or gaps can be reconstructed or accommodated during landmark placement. In contrast, the automated approach operates with high precision, meaning that even minimally damaged valves result in altered outline extraction and consequent shape distortion. While this represents a constraint for some fossil assemblages, such specimens can be identified through outlier detection prior to generalized procrustes analysis and excluded from subsequent analyses. The trade-off between requiring better-preserved specimens and achieving substantially increased sample sizes through automation generally favors the automated approach as the ability to process large numbers of well-preserved specimens outweighs the loss of moderately damaged individuals from analysis.
An additional consideration concerns the initial specimen preparation. Unlike many other organismal groups amenable to automated morphometrics, ostracods require manual picking from sediments and careful arrangement for imaging. This necessity arises from their asymmetric valve morphology, with distinct right and left valves possessing inner and outer surfaces that must be correctly oriented for taxonomic identification and morphometric analysis. This preparatory step remains time-intensive regardless of subsequent automation.
Automated acquisition of size and shape data from ostracod valves using AutoMorph enables routine generation of large spatial and temporal datasets within comparatively short time frames. Despite the continued requirement for manual specimen preparation, separating valves from sediment and arranging them for imaging according to valve asymmetry, automated geometric morphometrics are well suited for application to large datasets. These are urgently needed for comprehensive evolutionary and ecological analyses.
Generating such large-scale datasets would enable broader comparative analyses across species, regions, and time periods. Bridging this data gap is particularly important for documenting the full range of morphological variation within ostracod species and facilitating data reuse across studies. Furthermore, establishing shared image and morphometric databases would provide valuable training and testing material for developing and validating automated image recognition and classification algorithms, including machine learning applications. Such approaches are now commonly applied to other microfossil groups, including foraminifera and diatoms, but remain underdeveloped for ostracods.
Future research should prioritize the following: (1) systematic collection of morphometric data across multiple spatial and temporal scales; (2) integration of shape data with environmental variables to elucidate drivers of morphological variation; and (3) incorporation of genetic data, where feasible, to link phenotypic and genotypic variation. The automated methodology presented here provides the necessary infrastructure for such integrative approaches, potentially transforming ostracods into model organisms for investigating evolutionary and ecological dynamics across scales previously unattainable for this group.
Raw data and code is available on Zenodo (raw data: https://doi.org/10.5281/zenodo.18887817, Hoehle, 2026 and code: https://doi.org/10.5281/zenodo.20120602, PalaeolabGreifswald, 2026).
MH: study design, data processing, data analysis, writing (original draft, review and editing). CW: conceptualization and supervision of the study, project administration, funding acquisition. PF, AS, JW, and LZ: conceptualization of field trips, sediment sample collection and provision of the ostracod material, writing (review and editing). TH: project administration, writing (review and editing).
The contact author has declared that none of the authors has any competing interests.
Publisher's note: Copernicus Publications remains neutral with regard to jurisdictional claims made in the text, published maps, institutional affiliations, or any other geographical representation in this paper. The authors bear the ultimate responsibility for providing appropriate place names. Views expressed in the text are those of the authors and do not necessarily reflect the views of the publisher.
The authors are grateful to Giuseppe Aiello and one anonymous referee for their helpful comments, which improved the paper. We would like to thank the research fellows contracted through the “Tibetan Plateau: Geodynamics and Environmental Evolution” and the special priority program (SPP 1372 TiP) for their contributions to the field trips and sample preparation, especially Lailah Gifty Akita (Accra), Nicole Börner (Jena), Sascha Fürstenberg (Erfurt), Karoline Henkel (Jena), and Ping Peng (ITP).
This research is funded by the Deutsche Forschungsgemeinschaft (DFG, German Research Foundation) – project number 537144079.
This paper was edited by Moriaki Yasuhara and reviewed by Giuseppe Aiello and one anonymous referee.
Adams, D., Collyer, M., Kaliontzopoulou, A., and Baken, E.: Geomorph: Software for geometric morphometric analyses, R package version 4.0.10, https://cran.r-project.org/package=geomorph (last access: 13 January 2026), 2025.
Adolph, M., Wang, J., Zhu, L., Clarke, L., C., Henderson, A. C. G., Vogel, H., Daut, G., Frenzel, P., Ju, J., Kou, Q., Michaelis, D., Schmitz, O., Schwarz, A., Spiess, V., Ulfers, A., Zhaxi, C., Ariztegui, D., Barbolini, N., Bauersachs, T., Braun, E., Ceriotti, G., Grivna, B., Hoehle, M., Kipfer, R., Klamt, W., Kunkel, C., Laakkonen, A., Li, M., Ma, Q., Moser-Röggla, P., Müller, K., Noren, A., O'Grady, R., Otero, S., Picard, M., Pint, A., Thomas, C., Van der Woerd, J., Vinnepand, M., Wrozyna, C., Zeeden, C., Zhu, X., and Haberzettl, T.: The ICDP Nam Co Drilling Project (NamCore), Tibet: A 510.2-m sedimentary record from the Third Pole, Sci. Drill., accepted, 2026.
Akita, L. G., Frenzel, P., Wang, J., Börner, N., and Peng, P.: Spatial distribution and ecology of the Recent Ostracoda from Tangra Yumco and adjacent waters on the southern Tibetan Plateau: A key to palaeoenvironmental reconstruction, Limnologica, 59, 21–43, https://doi.org/10.1016/j.limno.2016.03.005, 2016.
Alivernini, M., Lai, Z., Frenzel, P., Fürstenberg, S., Wang, J., Guo, Y., Peng, P., Haberzettl, T., Börner, N. and Mischke, S.: Late quaternary lake level changes of Taro Co and neighbouring lakes, southwestern Tibetan Plateau, based on OSL dating and ostracod analysis, Global Planet. Change, 166, 1–18, https://doi.org/10.1016/j.gloplacha.2018.03.016, 2018.
Baken, E. K., Collyer, M. L., Kaliontzopoulou, A., and Adams, D. C.: geomorph v4.0 and gmShiny: Enhanced analytics and a new graphical interface for a comprehensive morphometric experience, Meth. Ecol. Evol., 12, 2355–2363, https://doi.org/10.1111/2041-210X.13723, 2021.
Baltanás, A. and Danielopol, D. L.: Geometric Morphometrics and its use in ostracod research: a short guide, Joannea Geol. Paläont, 235–272, https://api.semanticscholar.org/CorpusID:56082804 (last access: 11 May 2026), 2011.
Baltanás, A., Alcorlo, P., and Danielopol, D. L.: Morphological disparity in populations with and without sexual reproduction: A case study in Eucypris virens (Crustacea: Ostracoda), Biol. J. Linnean Soc., 75, 9–19, https://doi.org/10.1046/j.1095-8312.2002.00001.x, 2002.
Baltanás, A., Brauneis, W., Danielopol, D. L., and Linhart, J.: Morphometric Methods for Applied Ostracodology: Tools for Outline Analysis of Nonmarine Ostracodes, Paleontolog. Soc. Pap., 9, 101–118, https://doi.org/10.1017/s1089332600002175, 2003.
Bookstein, F. L.: Biometrics, biomathematics and the morphometric synthesis, Bull. Math. Biol., 58, 313–365, 1996.
Börner, N., De Baere, B., Akita, L. G., Francois, R., Jochum, K. P., Frenzel, P., Zhu, L., and Schwalb, A.: Stable isotopes and trace elements in modern ostracod shells: implications for reconstructing past environments on the Tibetan Plateau, China, J. Paleolimnol., 58, 191–211, https://doi.org/10.1007/s10933-017-9971-1, 2017.
Burge, D. R. L., Edlund, M. B., and Frisch, D.: Paleolimnology and resurrection ecology: The future of reconstructing the past, Evol. Appl., 11, 42–59, https://doi.org/10.1111/eva.12556, 2018.
Chen, Z., Guo, L., Wu, Y., Zhang, B., Chen, P., Yang, X., and Guo, J.: A high-resolution dataset of water bodies distribution over the Tibetan Plateau, Sci. Data, 11, https://doi.org/10.1038/s41597-024-03290-4, 2024.
Cooke, S. B. and Terhune, C. E.: Form, Function, and Geometric Morphometrics, Anatom. Rec., 298, 5–28, https://doi.org/10.1002/ar.23065, 2015.
Danielopol, D. L., Ito, E., Wansard, G., Kamiya, T., Cronin, T. M., and Baltanas, A.: Techniques for Collection and Study of Ostracoda, in: The Ostracoda:Applications in Quaternary Research, edited by: Chivas, A. R. and Holmes, J. A., Ostracoda, 131, 65–97, https://doi.org/10.1029/131GM04, 2002.
Elder, L. E., Hsiang, A. Y., Nelson, K., Strotz, L. C., Kahanamoku, S. S., and Hull, P. M.: Data descriptor: Sixty-one thousand recent planktonic foraminifera from the Atlantic Ocean, Sci. Data, 5, https://doi.org/10.1038/sdata.2018.109, 2018.
Fox, N. S., Veneracion, J. J., and Blois, J. L.: Are geometric morphometric analyses replicable? Evaluating landmark measurement error and its impact on extant and fossil Microtus classification, Ecol. Evol., 10, 3260–3275, https://doi.org/10.1002/ece3.6063, 2020.
Fürstenberg, S., Frenzel, P., Peng, P., Henkel, K., and Wrozyna, C.: Phenotypical variation in Leucocytherella sinensis Huang, 1982 (Ostracoda): a new proxy for palaeosalinity in Tibetan lakes, Hydrobiologia, 751, 55–72, https://doi.org/10.1007/s10750-014-2171-3, 2015.
Gross, M., Minati, K., Danielopol, D. A. N. L., and Piller, W. E.: Environmental changes and diversification of Cyprideis in the Late Miocene of Styrian Basin (Lake Pannon, Austria), Senckenbergiana Lethaea, 88, 161–181, 2008.
Haberzettl, T., Daut, G., Schulze, N., Spiess, V., Wang, J., Zhu, L., St-Onge, G., Chen, F., Liu, X., Lyu, X., Ju, J., Ma, Q., Wu, Z., Wünnemann, B., Yan, D., Yi, S., Zhang, H., Zhao, Y., Zhao, H., Buylaert, J. P., Murray, A., van der Woerd, J., Frenzel, P., Gleixner, G., Harms, U., Reicherter, K., Schwalb, A., Ulfers, A., Újvári, G., Mehrotra, N., Waldmann, N., Lami, A., Ariztegui, D., Barbolini, N., Ascough, P., Clarke, L., Henderson, A., Staff, R., Noren, A., Spanbauer, T., and Stoner, J.: ICDP workshop on scientific drilling of Nam Co on the Tibetan Plateau: 1 million years of paleoenvironmental history, geomicrobiology, tectonics and paleomagnetism derived from sediments of a high-altitude lake, Sci. Drill., 25, 63–70, https://doi.org/10.5194/sd-25-63-2019, 2019.
Hall, B. K.: Evo-Devo: evolutionary developmental mechanisms, Int. J. Dev. Biol., 47, 491–495, 2003.
Hall, B. K.: Evolutionary Developmental Biology (Evo-Devo): Past, Present, and Future, Evolution, 5, 184–193, https://doi.org/10.1007/s12052-012-0418-x, 2012.
Hill, B. L.: Reclassification of winged Cythereis and winged Brachycythere, J. Paleontol., 28, 804–826, 1955.
Hoehle, M.: Morphometric Raw Data [Data set], Zenodo [data set], https://doi.org/10.5281/zenodo.18887817, 2026.
Hoehle, M., Brachert, T., Piller, W. E., and Wrozyna, C.: Scale-dependent size variability of Cyprideis torosa (Ostracoda), Limnology, 26, 55–74, https://doi.org/10.1007/s10201-024-00761-w, 2025a.
Hoehle, M., Methner, K., Hunt, G., Piller, W. E., and Wrozyna, C.: Temporal and spatial variation of sexual size and shape dimorphism of Cyprideis torosa (Ostracoda), Zool. J. Linn. Soc., 204, https://doi.org/10.1093/zoolinnean/zlaf049, 2025b.
Horne, D. J.: Ostracoda, in: Encyclopedia of Geology, edited by: Selley, R. C., Cocks, L. R. M., and Plimer, I. R., Elsevier Academic, Amsterdam, 453–463, https://doi.org/10.1016/B0-12-369396-9/00511-6, 2005.
Hsiang, A. Y., Nelson, K., Elder, L. E., Sibert, E. C., Kahanamoku, S. S., Burke, J. E., Kelly, A., Liu, Y., and Hull, P. M.: AutoMorph: Accelerating morphometrics with automated 2D and 3D image processing and shape extraction, Meth. Ecol. Evol., 9, 605–612, https://doi.org/10.1111/2041-210X.12915, 2018.
Hsiang, A. Y., Brombacher, A., Rillo, M. C., Mleneck-Vautravers, M. J., Conn, S., Lordsmith, S., Jentzen, A., Henehan, M. J., Metcalfe, B., Fenton, I. S., Wade, B. S., Fox, L., Meilland, J., Davis, C. V., Baranowski, U., Groeneveld, J., Edgar, K. M., Movellan, A., Aze, T., Dowsett, H. J., Miller, C. G., Rios, N., and Hull, P. M.: Endless Forams: > 34,000 Modern Planktonic Foraminiferal Images for Taxonomic Training and Automated Species Recognition Using Convolutional Neural Networks, Paleoceanogr. Paleoclimatol., 34, 1157–1177, https://doi.org/10.1029/2019PA003612, 2019.
Huang, B.: 1982 Ostracods from surface deposits of Recent lakes in Xizang, Ac. Micropalaeontol. Sin., 2, 369–376, 1982.
Hunt, G., Martins, M. J. F., Puckett, T. M., Lockwood, R., Swaddle, J. P., Hall, C. M. S., and Stedman, J.: Sexual dimorphism and sexual selection in cytheroidean ostracodes from the Late Cretaceous of the U.S. Coastal Plain, Paleobiology, 43, 620–641, https://doi.org/10.1017/pab.2017.19, 2017.
Jones, T. R.: A Monograph of the Tertiary Entomostraca of England, Palaeontogr. Soc. Lond. Monogr., 9, 1–68, 1857.
Ju, J. T., Zhu, L. P., Feng, J. L., Wang, J. B., Wang, Y., Xie, M. P., Peng, P., Zhen, X. L., and Lü, X. M.: Hydrodynamic process of Tibetan Plateau lake revealed by grain size: Case study of Pumayum Co, Chinese Sci. Bull., 57, 2433–2441, https://doi.org/10.1007/s11434-012-5083-5, 2012.
Jurine, L.: Histoire des Monocles, qui se trouvent aux environs de Genéve, Paschoud, Genéve, Paris, 1–260, https://doi.org/10.5962/bhl.title.10137, 1820.
Kahanamoku-Meyer, S. S., Samuels-Fair, M., Kamel, S. M., Stewart, D., Wu, B., Kahn, L. X., Titcomb, M., Mei, Y. A., Bridge, R. C., Li, Y. S., Sinco, C., Moreno, J., Epino, J. T., Gonzalez-Marin, G., Latt, C., Fergus, H., Duijnstee, I. A. P., and Finnegan, S.: An 800-year record of benthic foraminifer images and 2D morphometrics from the Santa Barbara Basin, Sci. Data, 11, https://doi.org/10.1038/s41597-024-02934-9, 2024.
Karanovic, I., Pham, H. T. M., and Sitnikova, T.: Diversification of the shell shape and size in Baikal Candonidae ostracods inferred from molecular phylogeny, Sci. Rep., 13, 1–12, https://doi.org/10.1038/s41598-023-30003-5, 2023.
Keil, A., Berking, J., Mügler, I., Schütt, B., Schwalb, A., and Steeb, P.: Hydrological and geomorphological basin and catchment characteristics of Lake Nam Co, South-Central Tibet, Quatern. Int., 218, 118–130, https://doi.org/10.1016/j.quaint.2009.02.022, 2010.
Koenders, A., Schön, I., Halse, S., and Martens, K.: Valve shape is not linked to genetic species in the Eucypris virens (Ostracoda, Crustacea) species complex, Zool. J. Linn. Soc., 180, 36–46, https://doi.org/10.1111/zoj.12488, 2017.
Korkmaz, S., Goksuluk, D., and Zararsiz, G.: MVN: An R Package for Assessing Multivariate Normality, Part of the Numerical Analysis and Scientific Computing Commons, and the Programming Languages and Compilers Commons, https://doi.org/10.32614/rj-2014-031, 2014.
Krause, P., Biskop, S., Helmschrot, J., Flügel, W. A., Kang, S., and Gao, T.: Hydrological system analysis and modelling of the Nam Co basin in Tibet, Adv. Geosci., 27, 29–36, https://doi.org/10.5194/adgeo-27-29-2010, 2010.
Li, B., Zhou, S., Murray, A. P., and Subsol, G.: Shape-changing chains for morphometric analysis of 2D and 3D, open or closed outlines, Sci. Rep., 11, https://doi.org/10.1038/s41598-021-00911-5, 2021.
Martens, K., Schön, I., Meisch, C., and Horne, D. J.: Global diversity of ostracods (Ostracoda, Crustacea) in freshwater, Hydrobiologia, 595, 185–193, https://doi.org/10.1007/s10750-007-9245-4, 2008.
Mischke, S.: Quaternary Ostracods from the Tibetan Plateau and Their Significance for Environmental and Climate-Change Studies, in: Developments in Quaternary Science, vol. 17, Elsevier Ltd, 263–279, https://doi.org/10.1016/B978-0-444-53636-5.00015-9, 2012.
Mischke, S., Herzschuh, U., Massmann, G., and Zhang, C.: An ostracod-conductivity transfer function for Tibetan lakes, J. Paleolimnol., 38, 509–524, https://doi.org/10.1007/s10933-006-9087-5, 2007.
Mitteroecker, P. and Schaefer, K.: Thirty years of geometric morphometrics: Achievements, challenges, and the ongoing quest for biological meaningfulness, Am. J. Biol. Anthropol., 178, 181–210, https://doi.org/10.1002/ajpa.24531, 2022.
Mulqueeney, J. M., Searle-Barnes, A., Brombacher, A., Sweeney, M., Goswami, A., and Ezard, T. H. G.: Smarter segmentation: Deep learning accelerates 3D morphological analysis of fossils, Past Global Changes Mag., 33, 68–69, https://doi.org/10.22498/pages.33.2.68, 2025.
Murakami, T., Terai, H., Yoshiyama, Y., Tezuka, T., Zhu, L., Matsunaka, T., and Nishimura, M.: The second investigation of Lake Puma Yum Co located in the Southern Tibetan Plateau, China, Limnology, 8, 331–335, https://doi.org/10.1007/s10201-007-0208-2, 2007.
Oksanen, J., Simpson, G., Blanchet, F., Kindt, R., Legendre, P., Minchin, P., O'Hara, R., Solymos, P., Stevens, M., Szoecs, E., Wagner, H., Barbour, M., Bedward, M., Bolker, B., Borcard, D., Borman, T., Carvalho, G., Chirico, M., De Caceres, M., Durand, S., Evangelista, H., FitzJohn, R., Friendly, M., Furneaux, B., Hannigan, G., Hill, M., Lahti, L., Martino, C., McGlinn, D., Ouellette, M., Ribeiro Cunha, E., Smith, T., Stier, A., Ter Braak, C., Weedon, J.: vegan: Community Ecology Package, R package version 2.8-0, https://vegandevs.github.io/vegan/ (last access: 13 January 2026), 2026.
PalaeolabGreifswald: PalaeolabGreifswald/AutoMorph-Ostracods: AutoMorph-Ostracods, Zenodo [code], https://doi.org/10.5281/zenodo.20120602, 2026.
Peng, P., Zhu, L., Frenzel, P., Wrozyna, C., and Ju, J.: Water depth related ostracod distribution in Lake Pumoyum Co, southern Tibetan Plateau, Quatern. Int., 313–314, 47–55, https://doi.org/10.1016/j.quaint.2013.08.054, 2013.
Qiao, B., Wang, J., Huang, L., and Zhu, L.: Characteristics and seasonal variations in the hydrochemistry of the Tangra Yumco basin, central Tibetan Plateau, and responses to the Indian summer monsoon, Environ. Earth Sci., 76, https://doi.org/10.1007/s12665-017-6479-y, 2017.
Raff, R. A.: Evo-devo: the evolution of a new discipline, Nat. Rev. Genet. 1, 74–79, https://doi.org/10.1038/35049594, 2000.
Rohlf, F. J.: The tps series of software, Hystrix, 26, 1–4, https://doi.org/10.4404/hystrix-26.1-11264, 2015.
Slice, D. E.: Geometric morphometrics, Annu. Rev. Anthropol., 36, 261–281, https://doi.org/10.1146/annurev.anthro.34.081804.120613, 2007.
Smith, A. J., Horne, D. J., Martens, K., and Schön, I.: Class Ostracoda, in: Thorp and Covich's Freshwater Invertebrates, vol. 1, edited by: Thorp, J. H. and Rogers, C. D., Academic Press, Cambridge, Massachusetts, 757–780, https://doi.org/10.1016/B978-0-12-385026-3.00030-9, 2015.
Verpoorter, C., Kutser, T., Seekell, D. A., and Tranvik, L. J.: A global inventory of lakes based on high-resolution satellite imagery, Geophys. Res. Lett., 41, 6396–6402, https://doi.org/10.1002/2014GL060641, 2014.
von Daday, E.: Untersuchungen über die Süßwasser-Mikrofauna Paraguays, Zoologica, 44-IV, 243–270, 1905.
von Grafenstein, U., Erlernkeuser, H., and Trimborn, P.: Oxygen and carbon isotopes in modern fresh-water ostracod valves: Assessing vital offsets and autecological effects of interest for palaeoclimate studies, Palaeogeogr. Palaeocl. Palaeoecol., 148, 133–152, https://doi.org/10.1016/S0031-0182(98)00180-1, 1999.
von Oheimb, P. V., Albrecht, C., Riedel, F., Du, L., Yang, J., Aldridge, D. C., Bößneck, U., Zhang, H., and Wilke, T.: Freshwater biogeography and limnological evolution of the tibetan plateau – insights from a plateau-wide distributed gastropod taxon (radix spp.), PLoS One, 6, https://doi.org/10.1371/journal.pone.0026307, 2011.
Wang, C., Kuang, X., Shan, J., Zhang, Q., Zhou, Z., Tong, Y., and Zou, Y.: Recent ostracods as ecological indicators and its applications: An example from the southern Tibetan Plateau, Ecol. Indicat., 143, 109326, https://doi.org/10.1016/j.ecolind.2022.109326, 2022.
Wang, J., Huang, L., Ju, J., Daut, G., Ma, Q., Zhu, L., Haberzettl, T., Baade, J., Mäusbacher, R., Hamilton, A., Graves, K., Olsthoorn, J., and Laval, B. E.: Seasonal stratification of a deep, high-altitude, dimictic lake: Nam Co, Tibetan Plateau, J. Hydrol., 584, https://doi.org/10.1016/j.jhydrol.2020.124668, 2020.
Watanabe, A.: How many landmarks are enough to characterize shape and size variation?, PLoS One, 13, https://doi.org/10.1371/journal.pone.0198341, 2018.
Wrozyna, C., Frenzel, P., Steeb, P., Zhu, L., and Schwalb, A.: Recent lacustrine Ostracoda and a first transfer function for palaeo-water depth estimation in Nam Co, southern Tibetan Plateau, Revista Espanola de Micropaleontologia, 41, 1–20, 2009.
Wrozyna, C., Piller, W. E., and Gross, M.: Morphotypes of Cytheridella ilosvayi (Ostracoda) detected by soft and hard part analyses, Crustaceana, 87, 1043–1071, https://doi.org/10.1163/15685403-00003342, 2014.
Wrozyna, C., Neubauer, T. A., Meyer, J., and Piller, W. E.: Shape variation in neotropical Cytheridella (Ostracoda) using semilandmarks-based geometric morphometrics: A methodological approach and possible biogeographical implications, PLoS One, 11, 1–16, https://doi.org/10.1371/journal.pone.0168438, 2016.
Wrozyna, C., Meyer, J., Gross, M., Ramos, M. I. F., and Piller, W. E.: Definition of regional ostracod (Cytheridella) morphotypes by use of landmark-based morphometrics, Freshwater Sci., 37, 573–592, https://doi.org/10.1086/699482, 2018a.
Wrozyna, C., Neubauer, T. A., Meyer, J., Ramos, M. I. F., and Piller, W. E.: Significance of climate and hydrochemistry on shape variation – A case study on Neotropical cytheroidean Ostracoda, Biogeosciences, 15, 5489–5502, https://doi.org/10.5194/bg-15-5489-2018, 2018b.
Wrozyna, C., Meyer, J., Gross, M., Ramos, M. I. F., and Piller, W. E.: Sexual, ontogenetic, and geographic variation of the Neotropical freshwater ostracod Cytheridella ilosvayi, BMC Zool., 4, 1–19, https://doi.org/10.1186/s40850-019-0042-0, 2019.
Wrozyna, C., Mischke, S., Hoehle, M., Gross, M., and Piller, W. E.: Large-Scale Geographic Size Variability of Cyprideis torosa (Ostracoda) and Its Taxonomic and Ecologic Implications, Front. Ecol. Evol., 10, 1–16, https://doi.org/10.3389/fevo.2022.857499, 2022.
Zhang, W., Mischke, S., Zhang, C., Gao, D., and Fan, R.: Ostracod distribution and habitat relationships in the Kunlun Mountains, northern Tibetan Plateau, Quatern. Int., 313–314, 38–46, https://doi.org/10.1016/j.quaint.2013.06.020, 2013.
Zhu, L., Ju, J., Wang, Y., Xie, M., Wang, J., Peng, P., Zhen, X., and Lin, X.: Composition, spatial distribution, and environmental significance of water ions in Pumayum Co catchment, southern Tibet, J. Geogr. Sci., 20, 109–120, https://doi.org/10.1007/s11442-010-0109-x, 2010.