the Creative Commons Attribution 4.0 License.
the Creative Commons Attribution 4.0 License.
 | 30 Jun 2026
Benthic foraminiferal assemblages as proxies for paleoenvironmental indicators in the Indo-Pacific (Indonesia)
Ria Fitriany
Khoiril Anwar Maryunani
Purna Sulastya Putra
Septriono Hari Nugroho
Sri Ardhyastuti
This study tests the hypothesis that benthic foraminiferal assemblages in Indonesian seas exhibit systematic depth zonation, with environmental controls shifting from physical factors in shallow waters to biochemical factors in deep waters. We established a comprehensive regional indicator set spanning six bathymetric zones (transitional, inner neritic, middle neritic, outer neritic, upper bathyal, and lower bathyal) based on 35 surface sediment samples collected from 0–4327 m water depths across the Indonesian seas. Statistical analysis, combining indicator value (IndVal), detrended correspondence analysis (DCA), and hierarchical cluster analysis using Bray–Curtis dissimilarity, successfully discriminated assemblages with 89 % classification accuracy based on bathymetric zones. Results demonstrate a systematic increase in the percentage of planktonic foraminifera in relation to the whole fauna (%P) from 0 %–0.6 % in transitional environments to > 90 % in lower bathyal settings. Benthic species richness peaked at middle-neritic depths (47 species per sample) before declining in deeper waters, while planktonic diversity increased continuously with depth. Primary indicator taxa show clear bathymetric segregation: Amphistegina and Sphaerogypsina dominate transported assemblages in transitional settings; substrate-dependent communities characterize inner neritic environments; Quinqueloculina and Pseudorotalia indicate middle-neritic environments; Brizalina, Gyroidina, and Cibicides mark outer neritic environments; while Uvigerina, Bulimina, and Globobulimina typify bathyal depths. The shift from physical to biogeochemical environmental controls appears to take place in outer neritic environments on the shelf and provides a robust, locally calibrated framework for paleobathymetric reconstruction in Indonesian seas.
- Article
(5873 KB) - Full-text XML
-
Supplement
(2786 KB) - BibTeX
- EndNote


Marine sedimentary sequences contain valuable paleoenvironmental information, with benthic foraminifera serving as key indicators for reconstructing ancient depositional environments. Foraminifera, which are single-celled protists with usually either calcareous or agglutinated shells, are widely used to estimate past ocean depths. This is largely because they are abundant in marine environments, are preserved well in the fossil record, and have depth-specific distributions that are well understood (Murray, 2006). Benthic species, in particular, tend to follow clear depth-related patterns as they respond sensitively to environmental factors that change in predictable ways with increasing depth. These are location-dependent and include shifts in temperature, pressure, sediment type, light availability, oxygen concentration, and the type and quantity of organic material (Jorissen et al., 2007).
The Indo-Pacific region, particularly the Indonesian Archipelago, represents a complex oceanographic system characterized by the Indonesian Throughflow (ITF), the most important current system transporting water between the Pacific Ocean and the Indian Ocean (Gordon, 2005). The area has a wide variation of marine habitats, from shallow coastal seas to oceanic basins more than 7000 m deep. The existence of such bathymetric diversity over relatively short distances makes this region an attractive location to investigate the vertical distribution of marine life. Despite being a hotspot of marine diversity on a global scale, the deep biodiversity of this area has been less studied and investigated for depth-specific indicator species in comparison to cooler water depths in the tropics (Renema, 2018).
Studies of the distribution of foraminifera in Indonesian seas have usually been restricted to certain sites or depth intervals. For instance, Renema and Troelstra (2001) looked at large benthic foraminiferal populations present on the Spermonde Shelf, while Dewi and Darlan (2008) analyzed foraminiferal communities in the Arafura Sea. Other local studies, such as that of Natsir (2010) on the modern foraminifera of Jakarta Bay and that of Putra and Nugroho (2019) on benthic foraminifera of the Sumba Strait, address focused research topics.
Understanding the environmental controls on foraminiferal distribution across depth gradients is crucial for developing reliable paleobathymetric proxies. The TROX (TRophic-OXygen) model proposed by Jorissen et al. (1995) provides a conceptual framework for interpreting benthic foraminiferal distribution in relation to environmental factors. This model posits that foraminiferal assemblages in shallow marine environments are primarily controlled by physical factors such as wave energy, substrate type, and hydrodynamic disturbance, whereas, in deeper settings, biogeochemical factors including oxygen availability and organic matter flux become the dominant controls. While the TROX model has been validated in temperate Atlantic and Mediterranean settings (Jorissen et al., 2007), its applicability to tropical Indo-Pacific environments, particularly the complex oceanographic regime of Indonesian seas characterized by the Indonesian Throughflow and monsoon-driven circulation, remains to be systematically tested.
This research aims to distinguish foraminiferal species specific to different bathymetric zones of the Indo-Pacific region, especially in the Indonesian seas, by testing three hypotheses: first, that specific foraminiferal taxa consistently indicate particular bathymetric zones after controlling for substrate variability; second, that environmental controls on foraminiferal distribution shift systematically from physical factors in shallow waters to biochemical factors in deep waters, as predicted by the TROX (TRophic-OXygen) model; and, third, that a statistically robust and regionally calibrated set of indicator species can be established for paleobathymetric reconstruction in the Indo-Pacific region. The study analyzes recent sediment data from multiple depth zones across Indonesian seas and employs a range of statistical techniques to identify a robust suite of key species that can serve as a template for paleobathymetric interpretations in the area while also investigating the principal environmental factors influencing the foraminiferal distribution across the bathymetric gradient and evaluating TROX model applicability in tropical settings.
2.1 Sample collection and study area
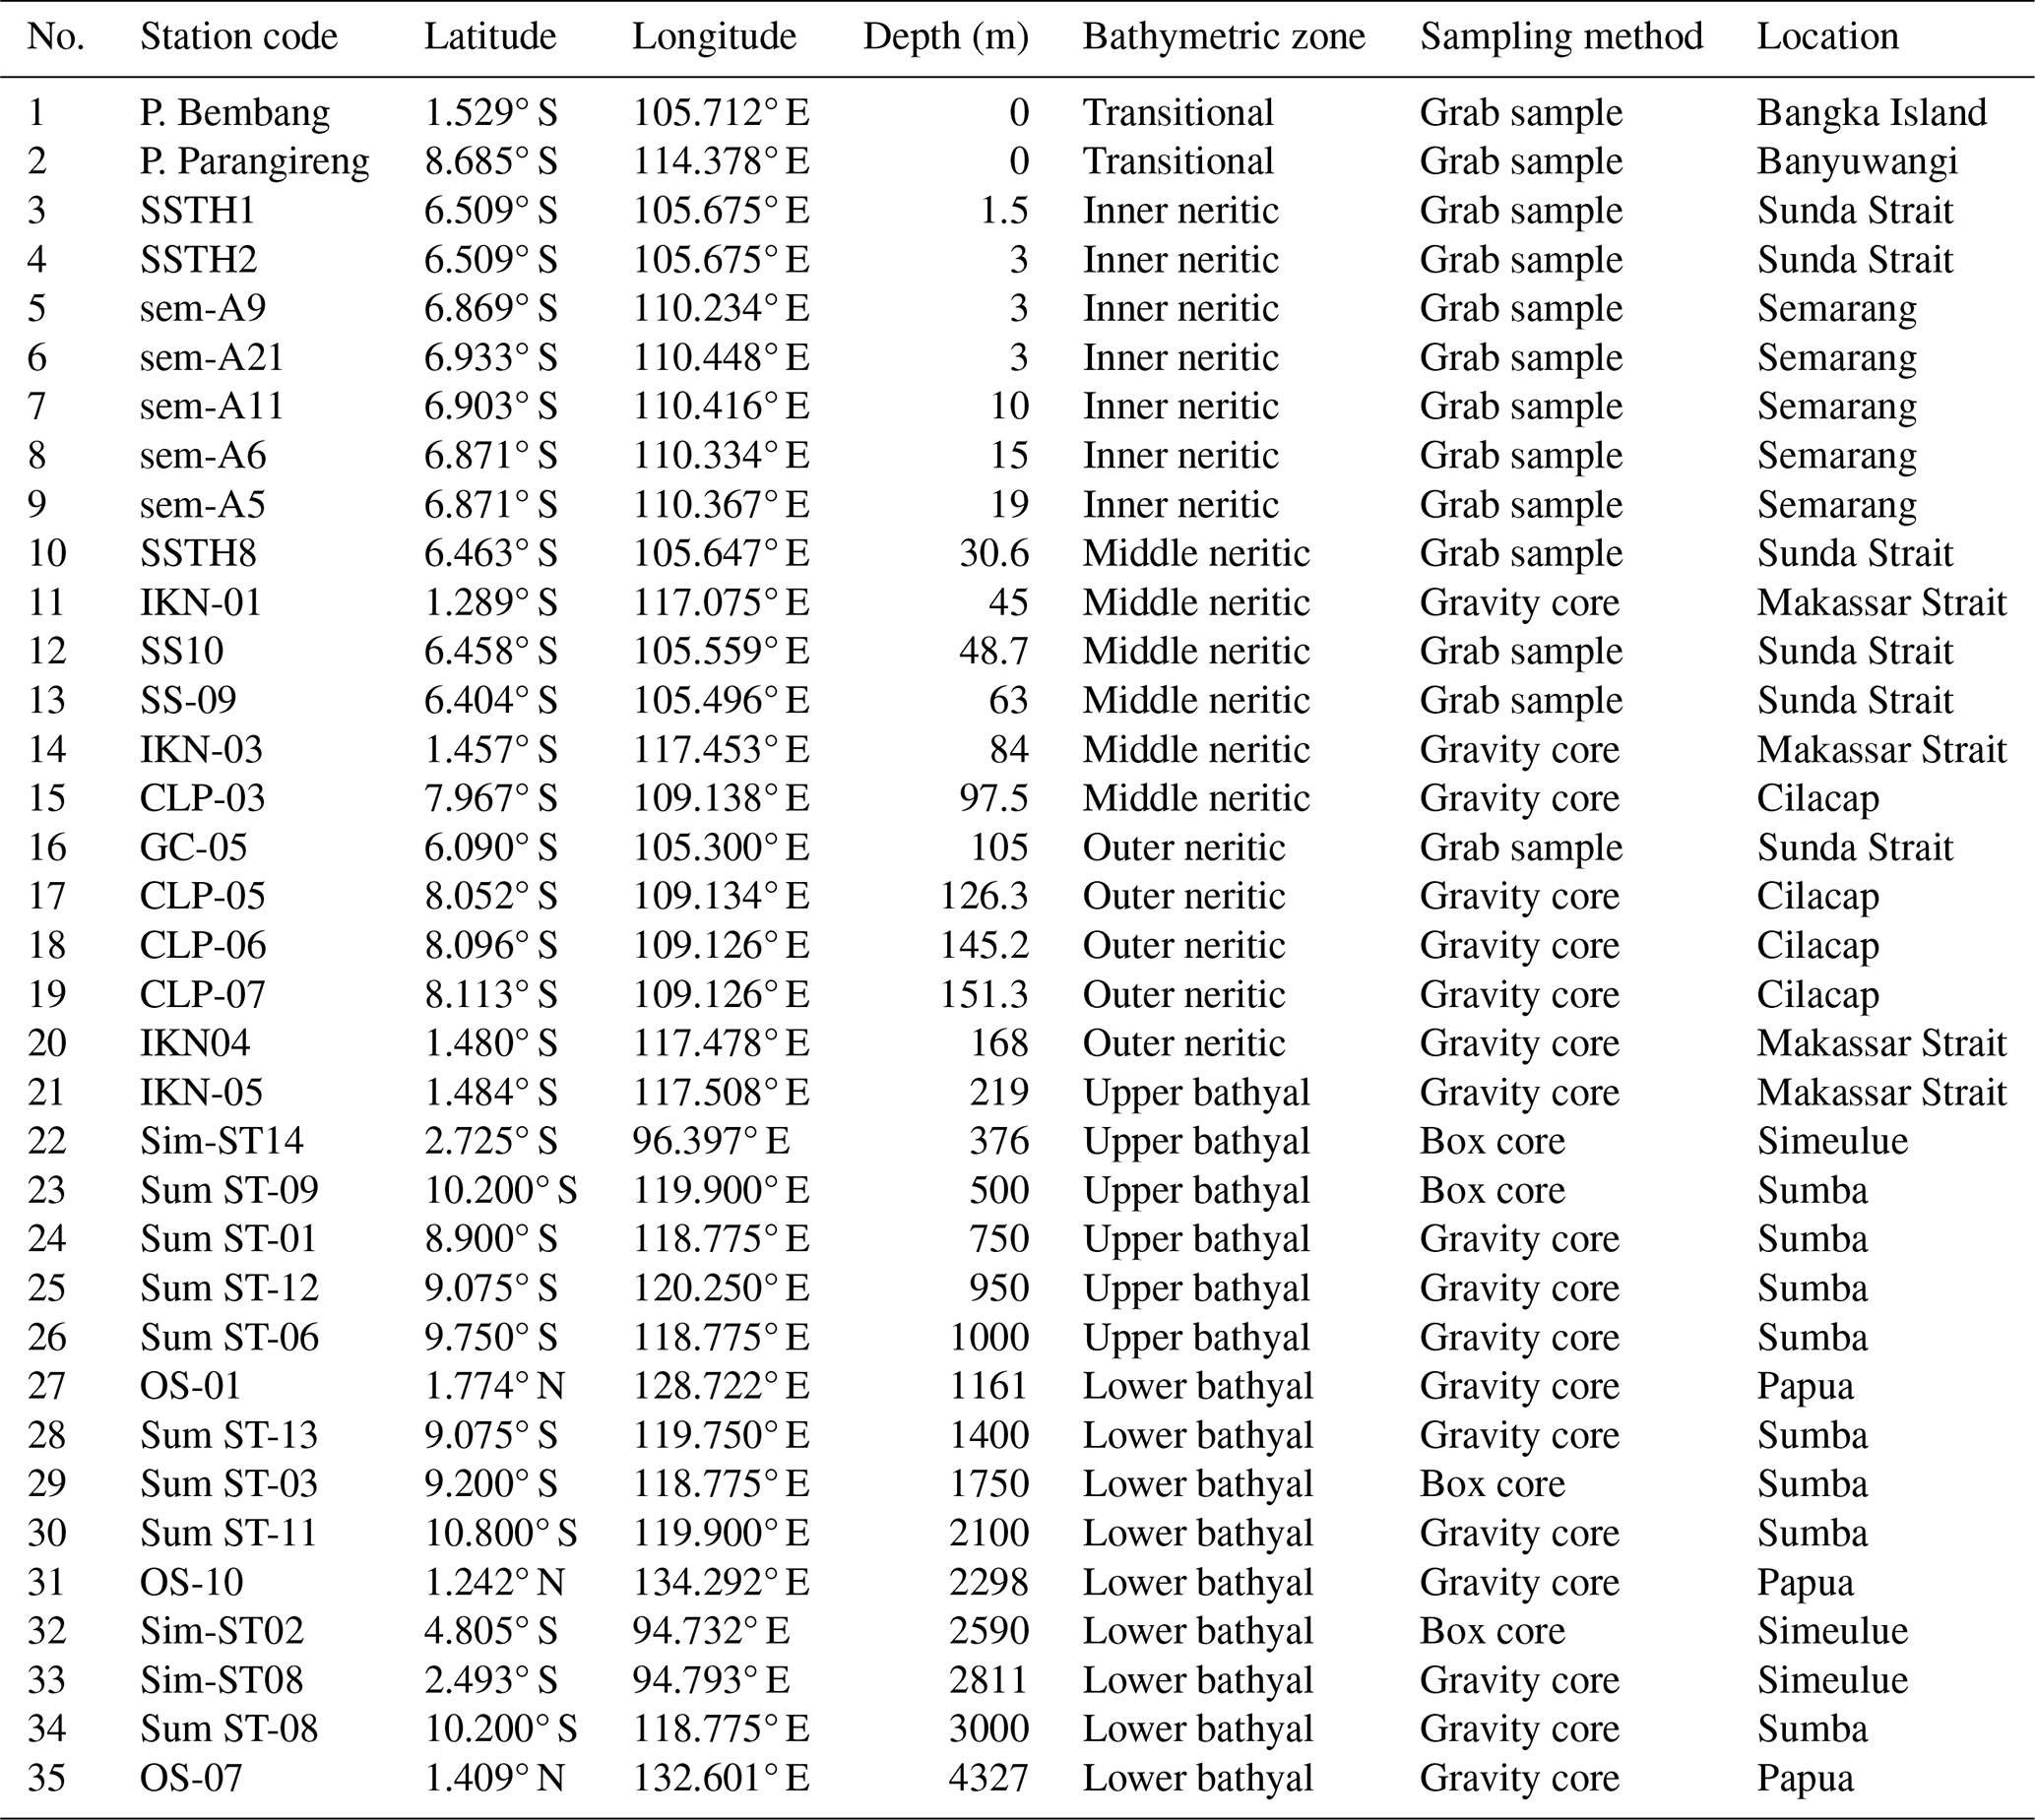
A total of 35 recent surface sediment samples were collected from nine distinct locations across the Indonesian Marine Region, as shown in Fig. 1, spanning a bathymetric transect from 0 to 4327 m water depth (Fig. 2). The sampling locations cover various oceanographic conditions, from the Java Sea, Sunda Strait, Makassar Strait, Sumba Strait, and island of Simeulue to offshore Papua. This spatial coverage represents the environmental heterogeneity across the Indonesian Archipelago, ranging from shallow shelves to deep basins. Complete station metadata including coordinates, sampling dates, and environmental conditions are provided in Table 1. It is important to note that data on the two most important environmental factors within the TROX model – organic carbon flux and dissolved oxygen concentration – were not recorded at the sites.
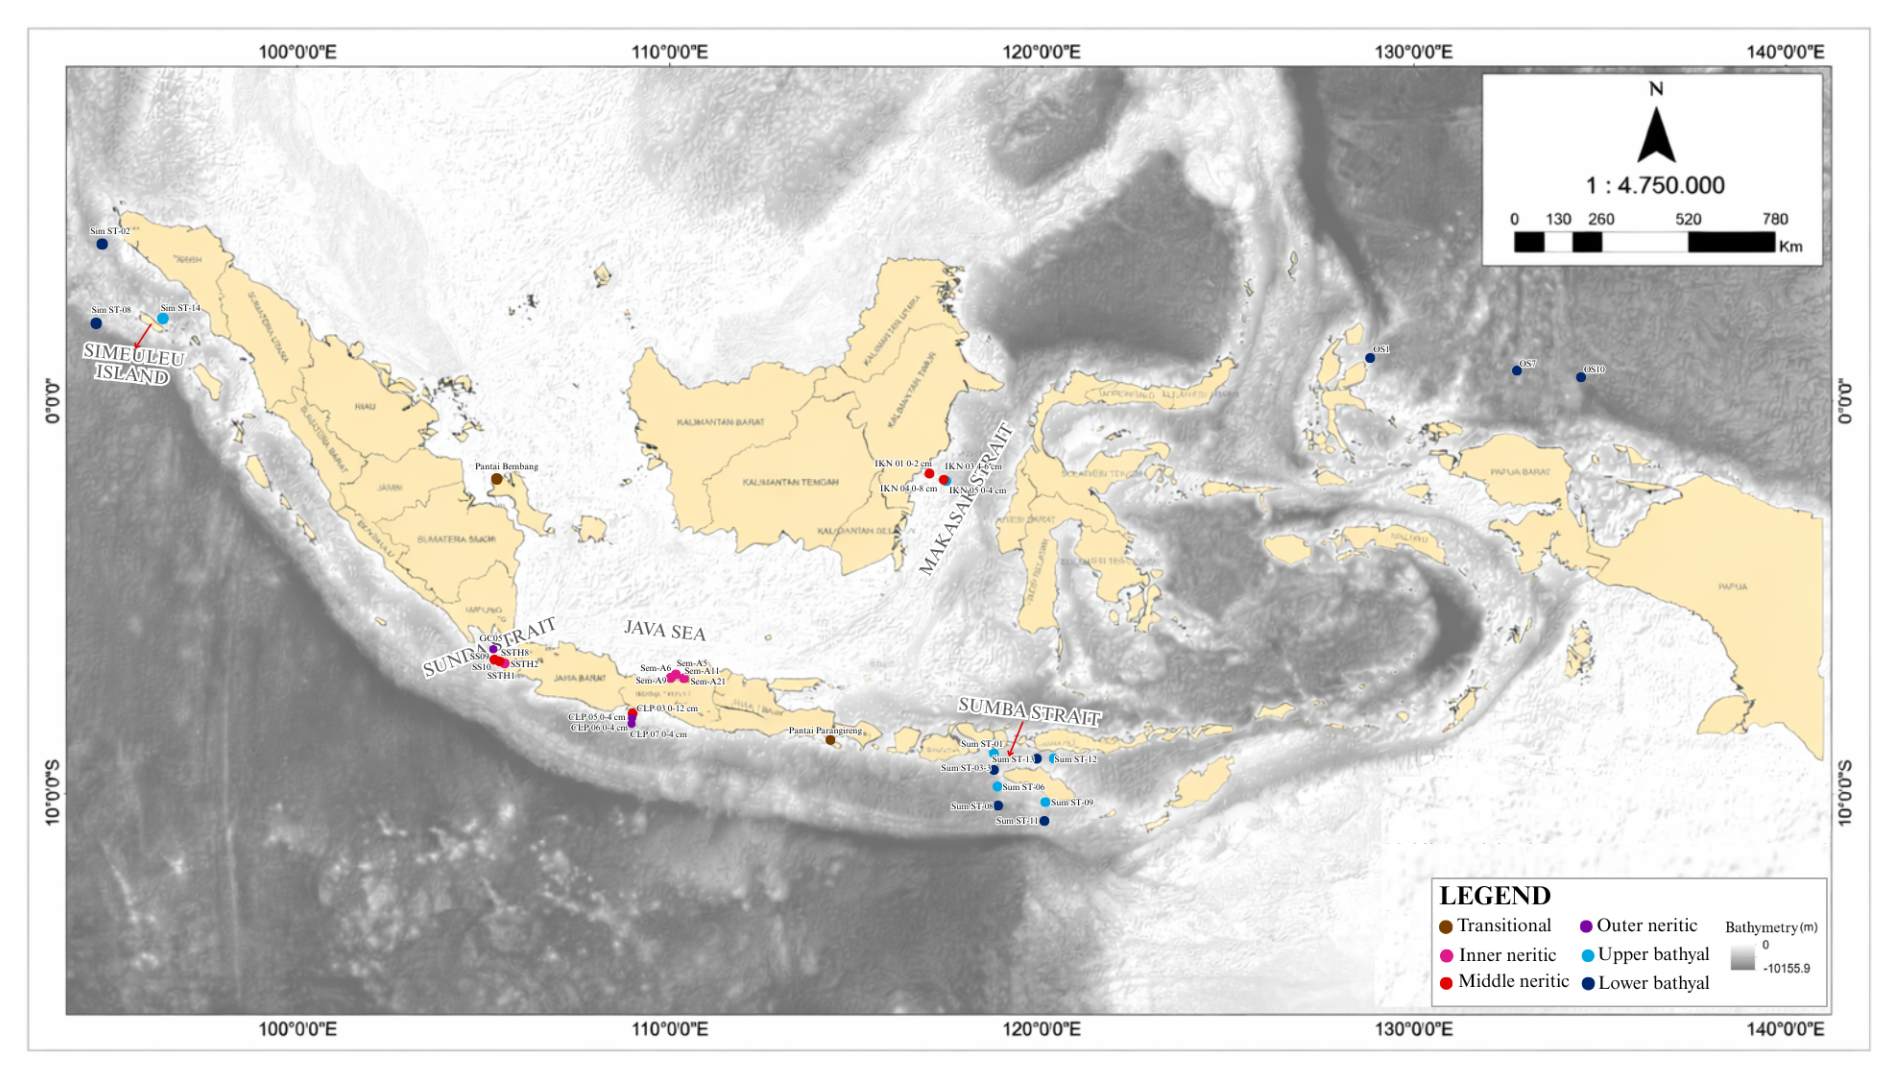
Figure 1Location of the study area showing sampling sites across Indonesian seas, including the Java Sea, the Sunda Strait, the Makassar Strait, the Sumba Strait, waters around Simeulue Island, and off the coast of Papua (basemap: Geospatial Information Agency, 2025).
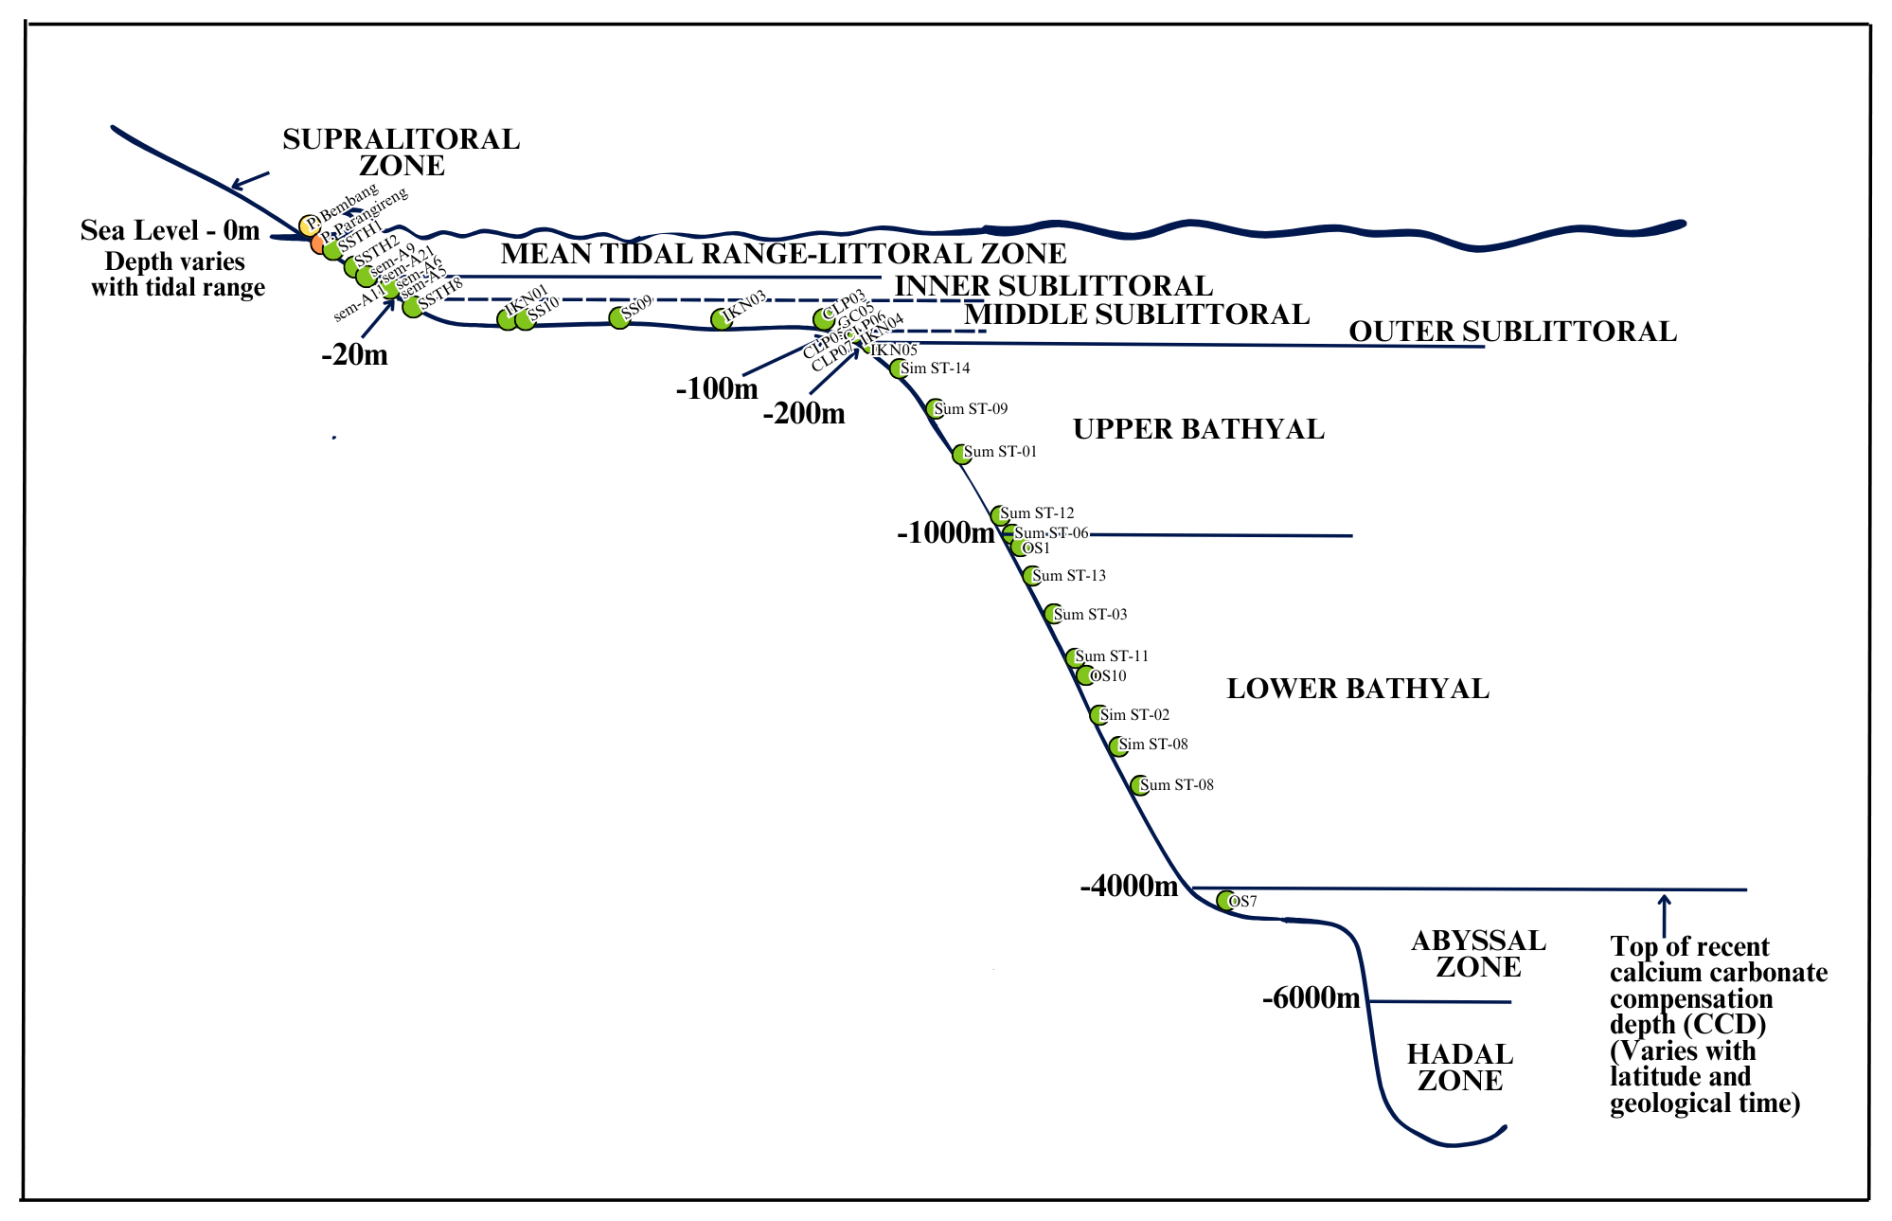
Figure 2Sample locations plotted on bathymetric zones following the classification scheme adapted from Tipsword et al. (1966), Ingle (1980), and van Morkhoven et al. (1986).
Table 1Station metadata including coordinates, water depth, bathymetric zone, and sampling method for all 35 sampling locations across Indonesian seas.
Based on the classification scheme adapted from Tipsword et al. (1966), Ingle (1980), and van Morkhoven et al. (1986), samples were grouped into six bathymetric zones with regional adaptations for Indonesian oceanographic conditions as shown in Table 2. The transitional zone represents beach face to shallow subtidal environments above a fair-weather wave base, characterized by frequent sediment reworking, high-energy conditions, and a strong influence of wave action and long-shore currents. These stations experience active hydrodynamic winnowing and potential onshore transport of biogenic material, which significantly affect foraminiferal assemblage composition.
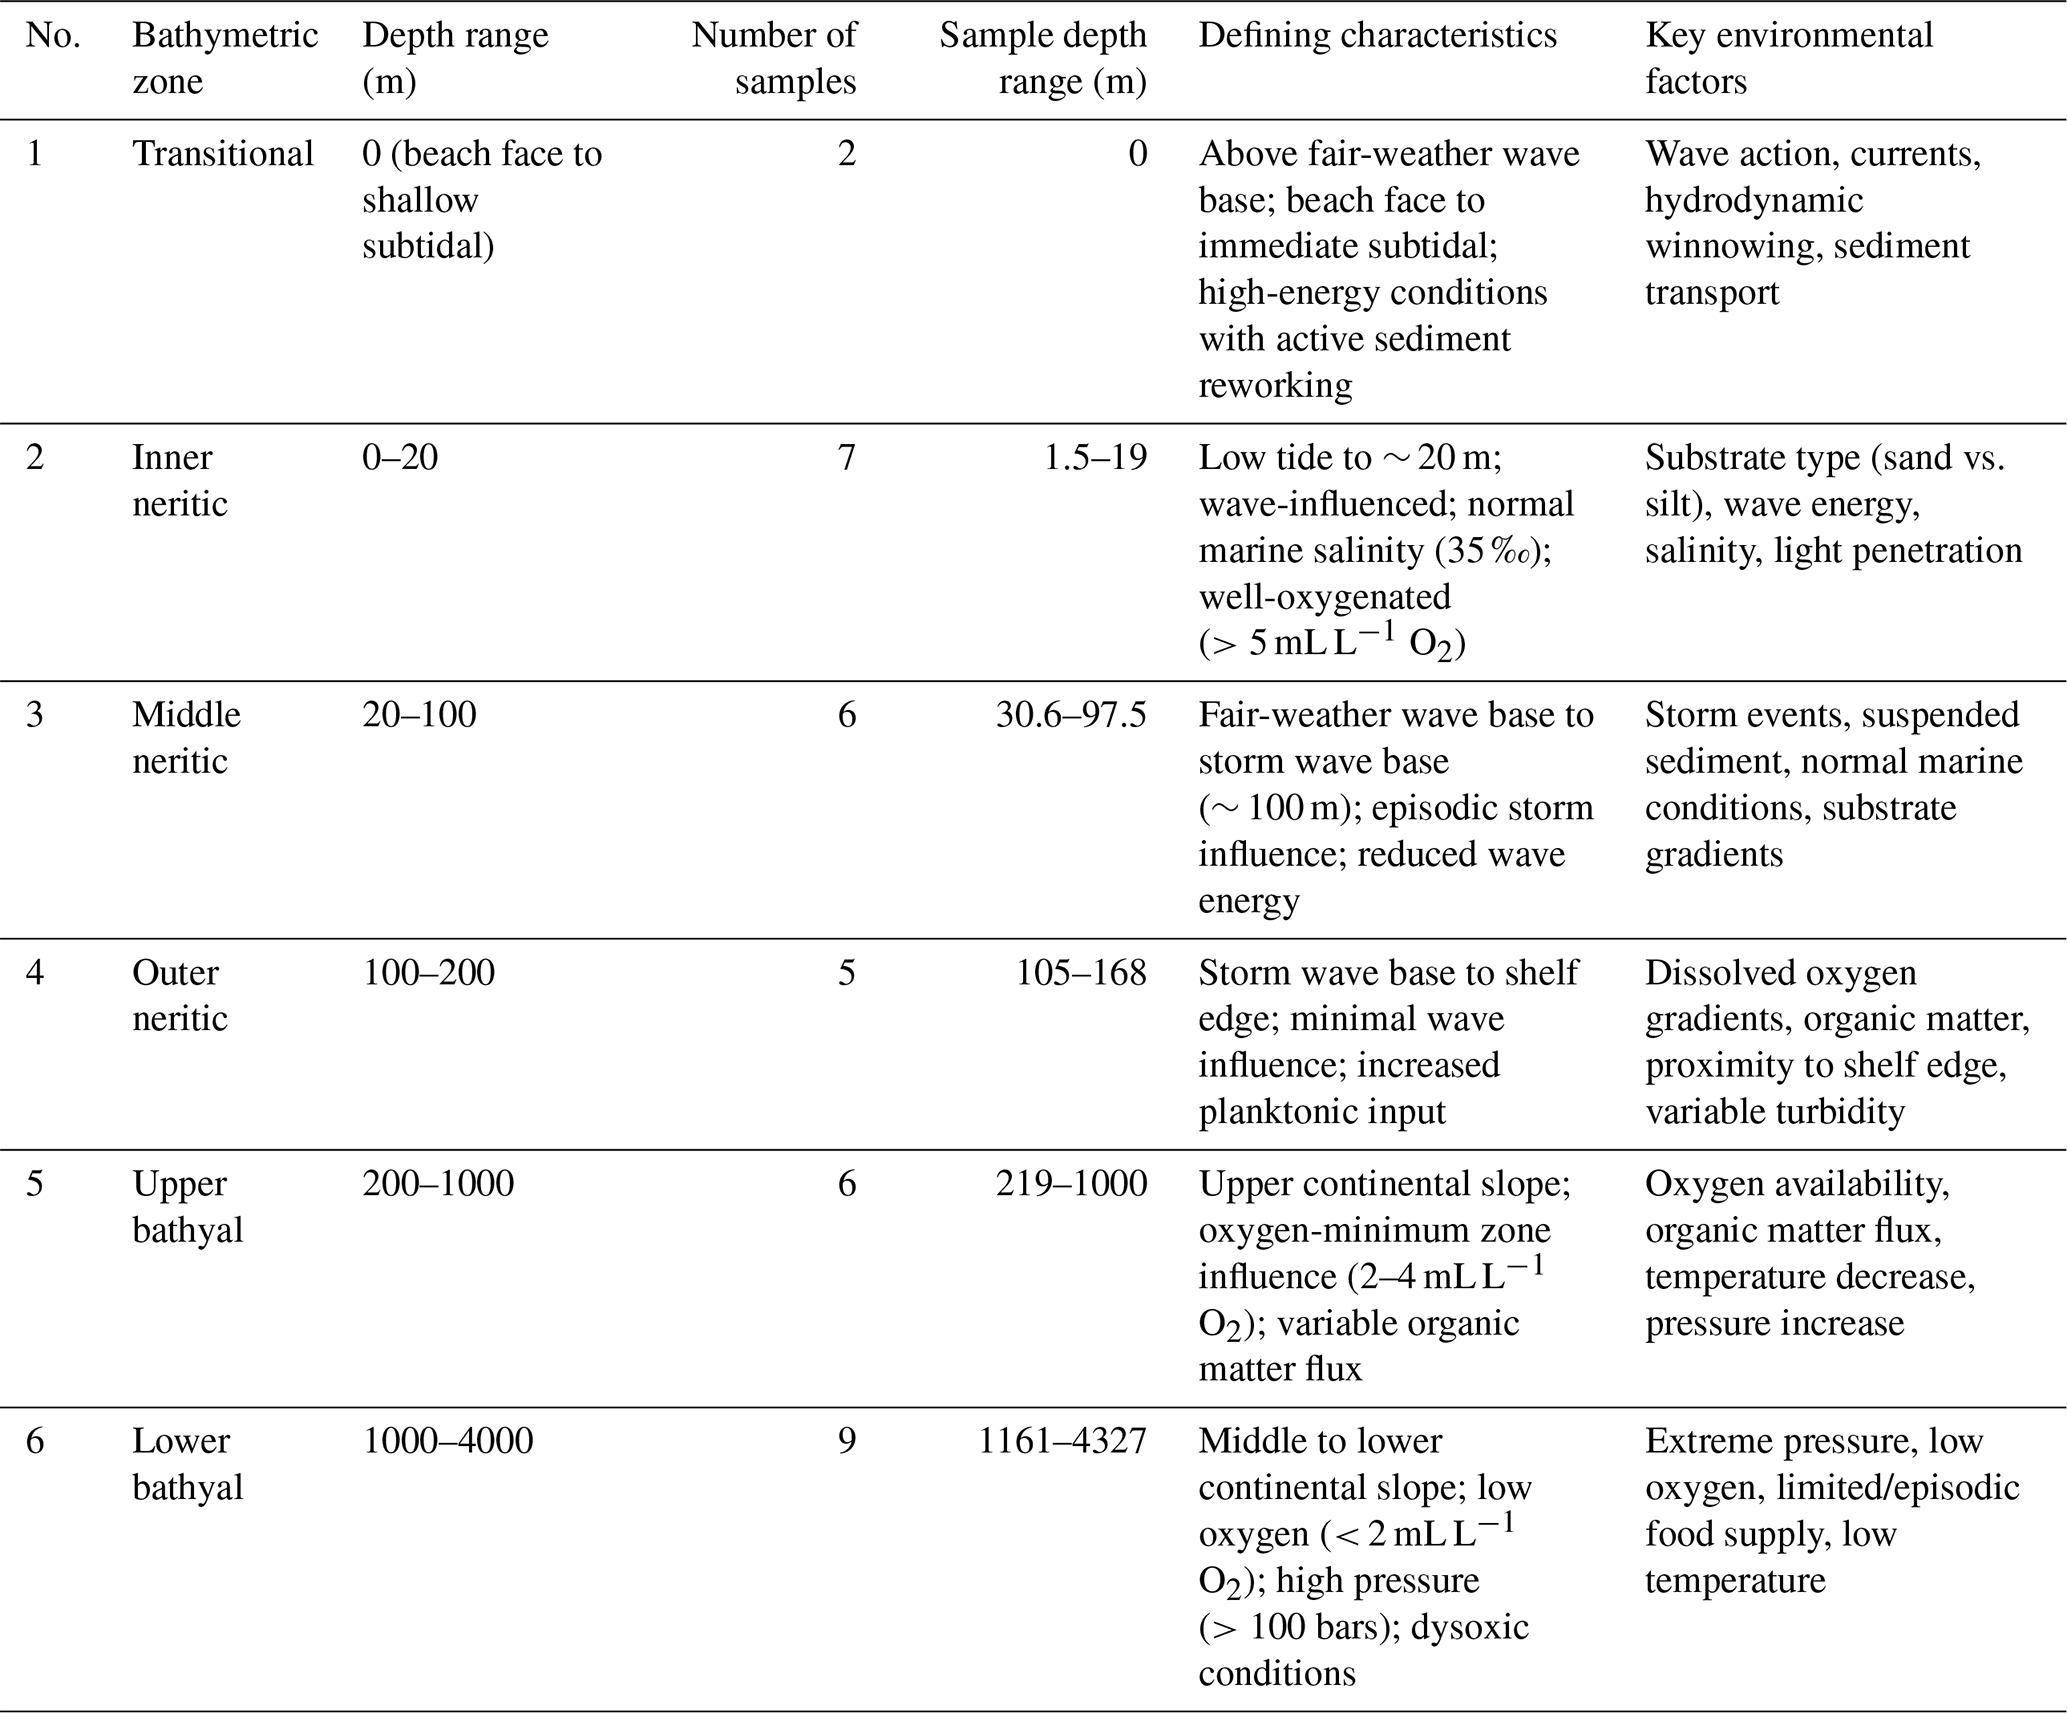
The neritic classification follows Tipsword et al. (1966). The inner neritic zone extends from low tide to the fair-weather wave base, characterized by wave influence, normal marine salinity (35 ‰), and well-oxygenated conditions (>5 mL L−1 O2). The food supply is abundant in the inner neritic zone, driven by terrestrial input and primary productivity in the photic zone, and decreases toward the outer neritic zone. The middle neritic zone spans from the fair-weather wave base to the storm wave base (∼ 100 m), where episodic storm influence occurs with reduced wave energy. The outer neritic zone extends from the storm wave base to the shelf edge, characterized by minimal wave influence and increased planktonic input (Murray, 2006).
The bathyal zone combines classifications from Ingle (1980) and van Morkhoven et al. (1986). The upper bathyal zone represents the upper continental slope with oxygen-minimum zone influence (2–4 mL L−1 O2) and variable organic matter flux. The lower bathyal zone is characterized by low-oxygen conditions (< 2 mL L−1 O2), high hydrostatic pressure (>100 bars), and specialized deep-water assemblages adapted to dysoxic and variable organic carbon flux conditions (Murray, 2006). This regional adaptation is scientifically justified for the Indo-Pacific where different oceanographic conditions create bathyal environments extending to approximately 4000 m depth, differing from the traditional 2000 m limit used in Atlantic-based schemes.
Sample collection employed grab samplers for shallow waters (0–168 m), box cores for mid-depth sampling (219–1750 m), and gravity cores for deeper areas (750–4327 m). For all sampling methods, only the uppermost sediment layer (0–10 cm) was analyzed to ensure examination of (sub)recent assemblages. While this depth represents different temporal spans across the bathymetric gradient (shorter time periods in high-energy shallow environments, potentially several thousand years in deeper, low-sedimentation environments), this approach provides the most recent assemblages available and maintains consistency in methodology across all sample sites. As such, our samples will contain a better representative time-averaged “dead assemblage” for comparison with downcore studies.
2.2 Laboratory analysis
2.2.1 Sediment analysis
Grain size analysis was performed using a Malvern Mastersizer 2000 laser diffraction particle size analyzer. Results were processed using Gradistat v.4.0 software to determine mean grain size and percentages of sand and mud. Classifications followed the Wentworth (1922) scale.
2.2.2 Foraminiferal analysis
Standard micropaleontological techniques were applied for foraminiferal analysis following Hayward et al. (2004). Samples were standardized to 50 g dry weight, washed over a 63 µm sieve, and dried at 30 °C. A standardized picking protocol was employed using microsplitter techniques to ensure statistical reliability and comparability between samples.
The picking procedure involved (1) preparing the >63 µm size fraction from 50 g standardized samples, (2) using a microsplitter to obtain representative subsamples containing approximately 300 foraminiferal specimens per split (following the recommendations of Hayward et al. (2004) for statistical reliability), (3) picking and identifying all foraminifera (both benthic and planktonic) from each split under a Nikon SMZ 1500 stereo microscope, and (4) standardizing all counts back to the original 50 g sample weight using the appropriate split factors.
This methodology ensures that all samples are quantitatively comparable regardless of original foraminiferal concentrations. Species richness (S) was calculated as the total number of species per standardized 50 g sample. The percentage of planktonic foraminifera (%P) was calculated as the percentage of planktonic specimens relative to the total foraminiferal assemblage per 50 g sample. All samples contained ≥ 300 specimens after microsplitter standardization, ensuring statistical reliability for subsequent analyses. Taxonomic identification was conducted at both genus and species levels following the systematic frameworks of Barker (1960), Postuma (1971), Bolli and Saunders (1985), Loeblich and Tappan (1988, 1994), and McCulloh (1977).
Rose Bengal staining was not employed in this study to discriminate living from dead foraminiferal assemblages. Therefore, all foraminiferal counts represent total (living and dead) assemblages, which introduces potential taphonomic biases including differential preservation between planktonic and benthic taxa, time-averaging effects across the 0–10 cm sampling interval (as discussed in Sect. 2.1), overrepresentation of robust tests relative to fragile forms, and transport of tests from original habitats in high-energy environments. However, the use of total assemblages presents specific challenges when applying the TROX model, which was originally formulated to describe the microhabitat preferences of living assemblages. In the upper and lower bathyal zones, post-mortem transport can cause shallow-water taxa to be advected downslope into deeper environments. The influx of these taxa can obscure the biochemical thresholds defined by the TROX model because the presence of transported specimens can falsely suggest living depths or oxygen tolerances that do not align with the local environment. Despite these limitations, the use of total assemblages is appropriate for paleoenvironmental applications because fossil assemblages are inherently time-averaged and subject to similar taphonomic processes, making our modern reference dataset directly comparable to ancient counterparts (Murray, 2006).
2.3 Statistical analysis
Statistical analyses were conducted using PAST (Paleontological Statistics) software (Hammer et al., 2001). Samples were standardized by sample totals prior to analysis to account for variations in total foraminiferal counts between samples. Hierarchical cluster analysis was performed to group samples based on foraminiferal compositional similarity using Bray–Curtis dissimilarity with average linkage (UPGMA) clustering. Bray–Curtis dissimilarity is appropriate for ecological abundance data because it excludes joint absences (double zeros) and focuses on shared species presence, making it more ecologically meaningful than Euclidean distance for community data (Legendre and Legendre, 2012). Unlike Euclidean distance, which treats shared absences as evidence of similarity, Bray–Curtis recognizes that the mutual absence of species provides no information about ecological similarity. The dissimilarity ranges from 0 (identical communities) to 1 (completely different communities). Cluster stability was assessed using cophenetic correlation coefficients to evaluate how faithfully the dendrogram preserves the original dissimilarity relationships.
Detrended correspondence analysis (DCA) was employed as the primary ordination method to visualize the relationship between samples along environmental gradients. DCA is particularly suitable for ecological data exhibiting unimodal species responses along environmental gradients, where species show peak abundances at intermediate values of environmental variables (Hill and Gauch, 1980). The method employs detrending by segments to remove the arch effect commonly observed in correspondence analysis and uses reciprocal averaging to simultaneously ordinate both samples and species. DCA axis lengths were calculated to confirm gradient length, and the relationship between DCA axis-1 scores and water depth was quantified using linear regression to validate depth as the primary environmental gradient. Principal component analysis (PCA) was performed separately for each bathymetric zone at both the genus and species levels to identify additional environmental factors controlling foraminiferal assemblages within zones. PCA results for zones with fewer than five samples are presented as descriptive only and are not interpreted as robust ecological signals due to rank limitations. Detailed PCAs are in Document S1 in the Supplement.
Indicator value (IndVal) analysis following Dufrêne and Legendre (1997) was used to identify indicator species for each bathymetric zone. IndVal combines specificity (how concentrated a species occurrence is in particular groups) with fidelity (the faithfulness of the occurrence of a species in particular groups), providing a robust measure of species–environment associations. The IndVal method calculates the product of the relative frequency and relative average abundance of species in each group, with values ranging from 0 % to 100 %. Species with IndVal values ≥ 25 % were classified as primary indicators. The 25 % threshold represents taxa with approximately 50 % occurrence within their preferred environment and has been established as a conservative cutoff for identifying ecologically meaningful indicator species (Dufrêne and Legendre, 1997). Primary indicator taxa were defined as those appearing consistently in both DCA/PCA factor loadings and IndVal analyses, while secondary indicators were identified through either ordination loadings or IndVal analysis alone. To ensure robustness of these classifications, all identified taxa were independently validated through ordination analyses, where primary indicators consistently appeared as strong axis loadings. Complete IndVal results for all taxa at the genus and species levels are provided in Tables S2–S3 in the Supplement.
3.1 Sample characteristics and bathymetric trends
Complete foraminiferal data, including specimen counts, species richness, and %P for all samples, are presented in Table 3, while sediment characteristics are provided in Table 4. The %P values in Table 3 provide the exact quantitative values for each sample, while Fig. 3 illustrates the overall bathymetric trend of these ratios and the derived paleobathymetric equation.
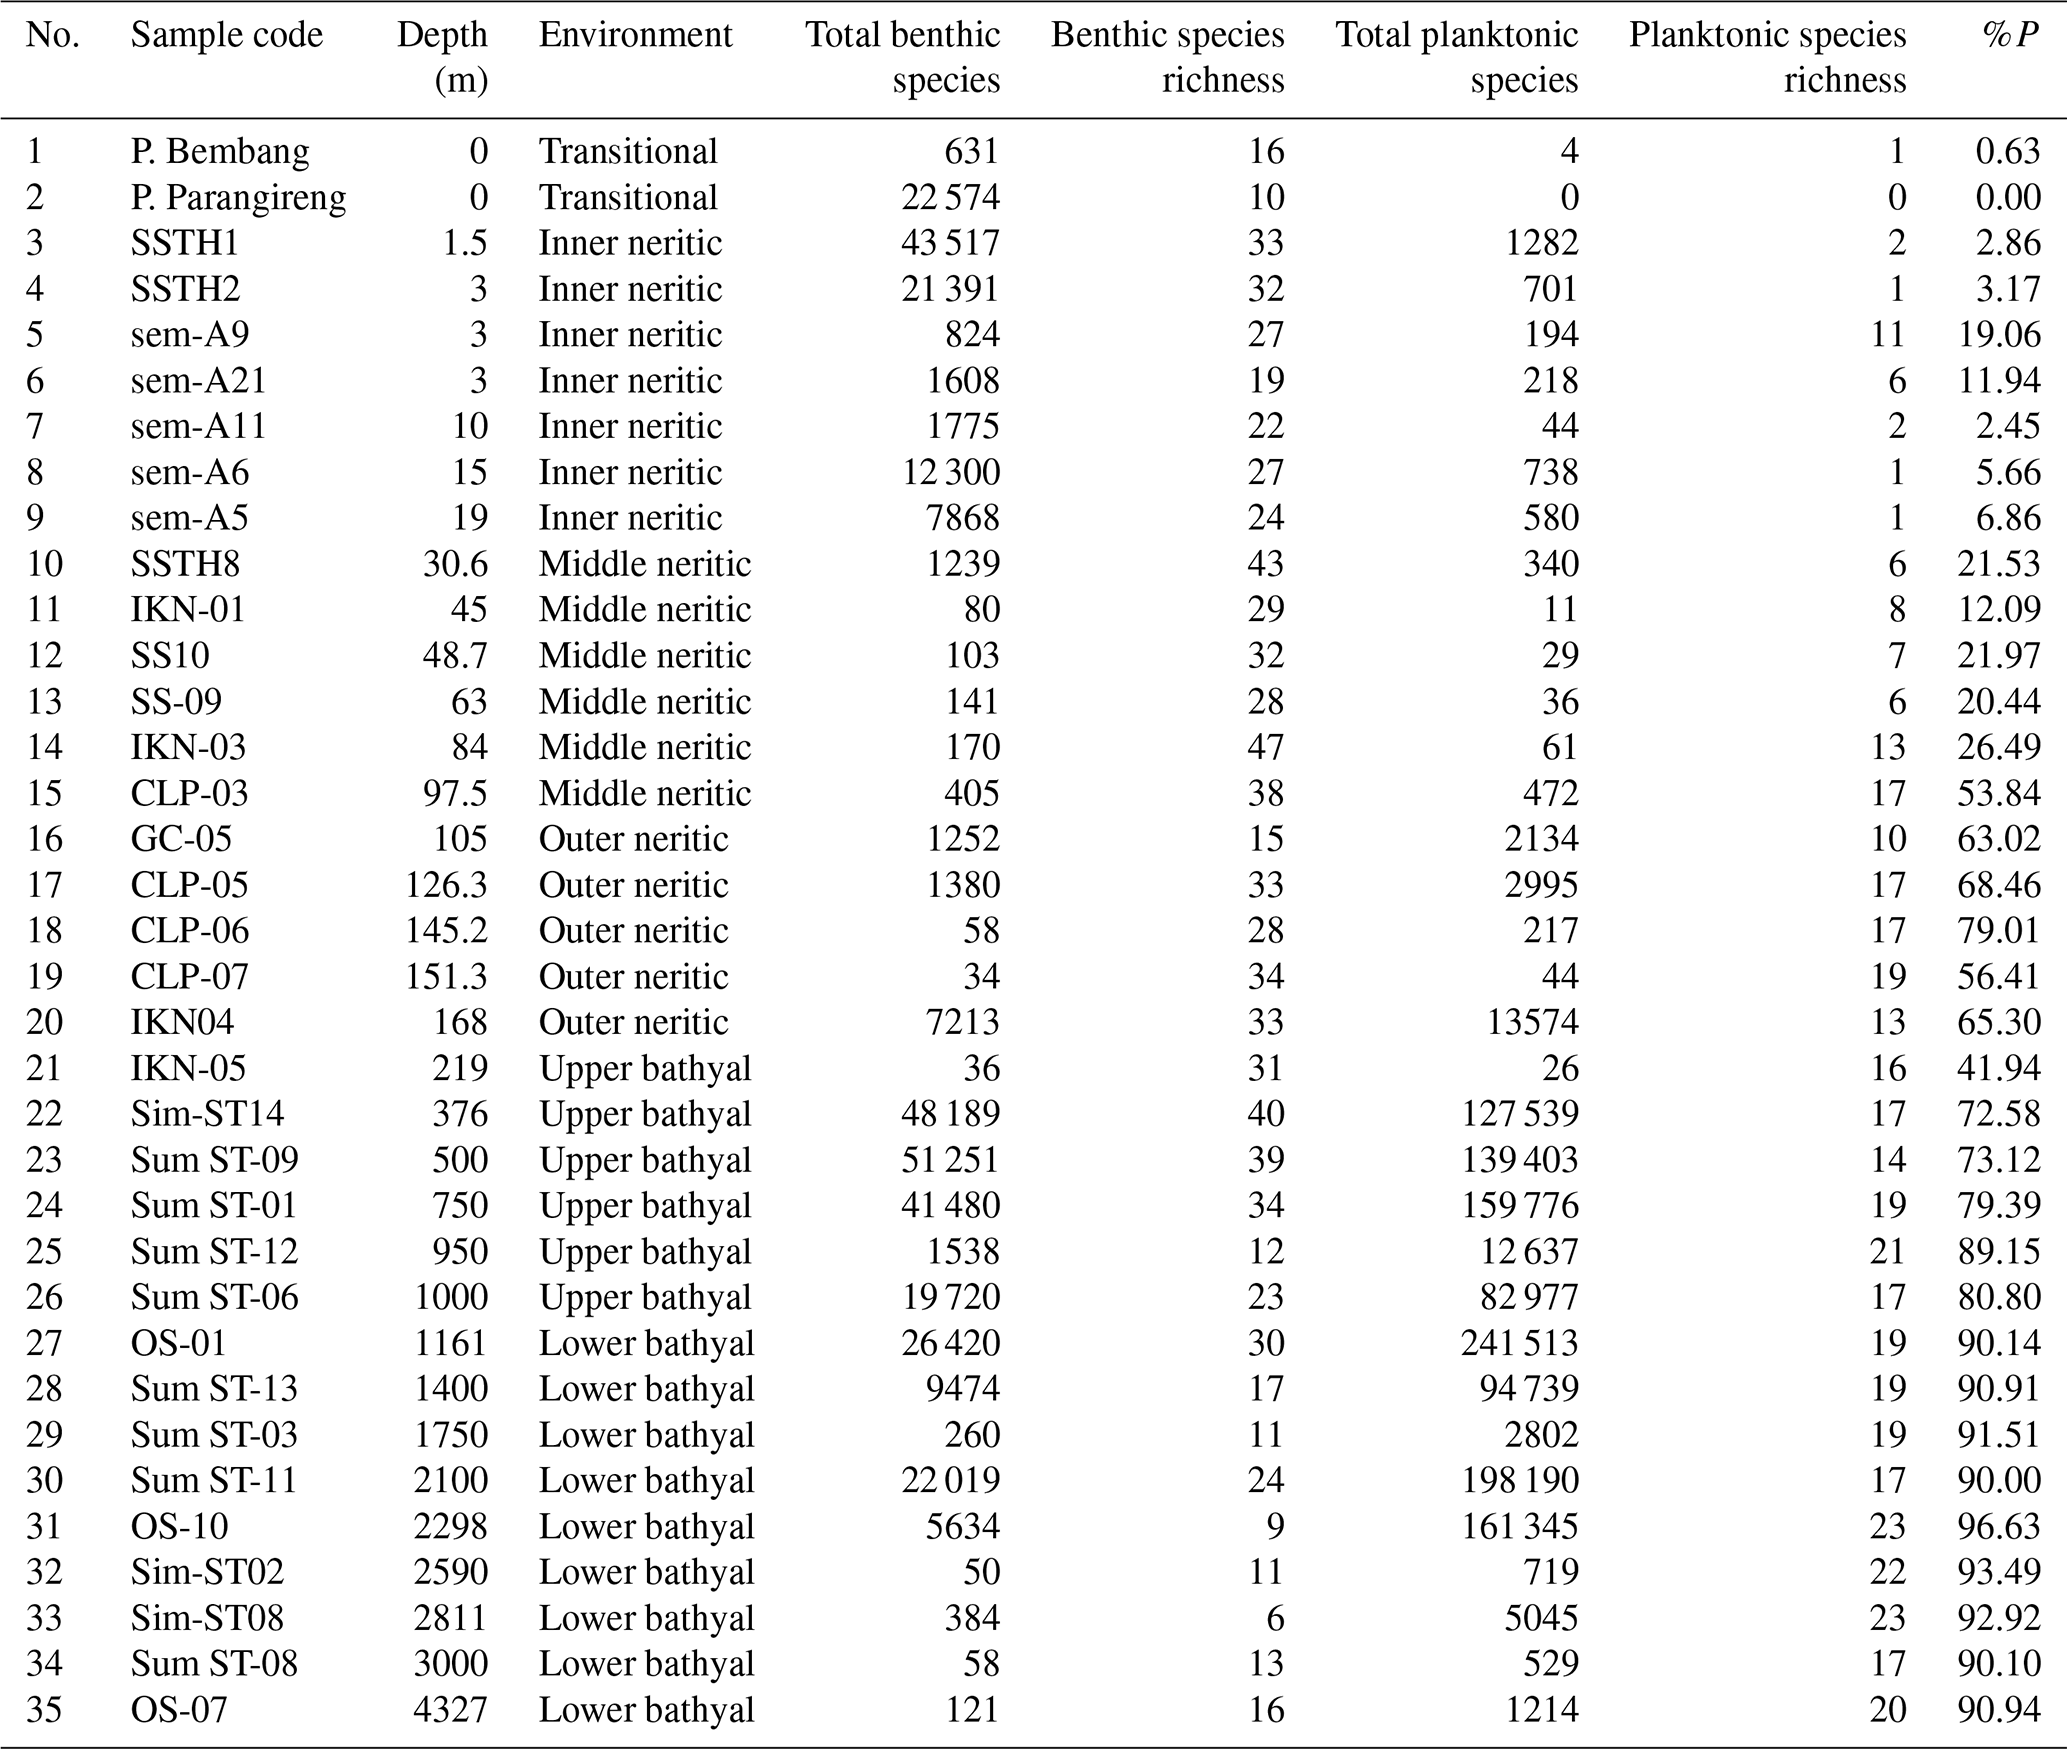
Table 4Grain size analysis result showing sample codes, bathymetric zones, mean grain size values and descriptions, percentages of sand and mud, and grain size classifications according to the Wentworth (1922) scale for 35 sediment samples collected from Indonesian seas.
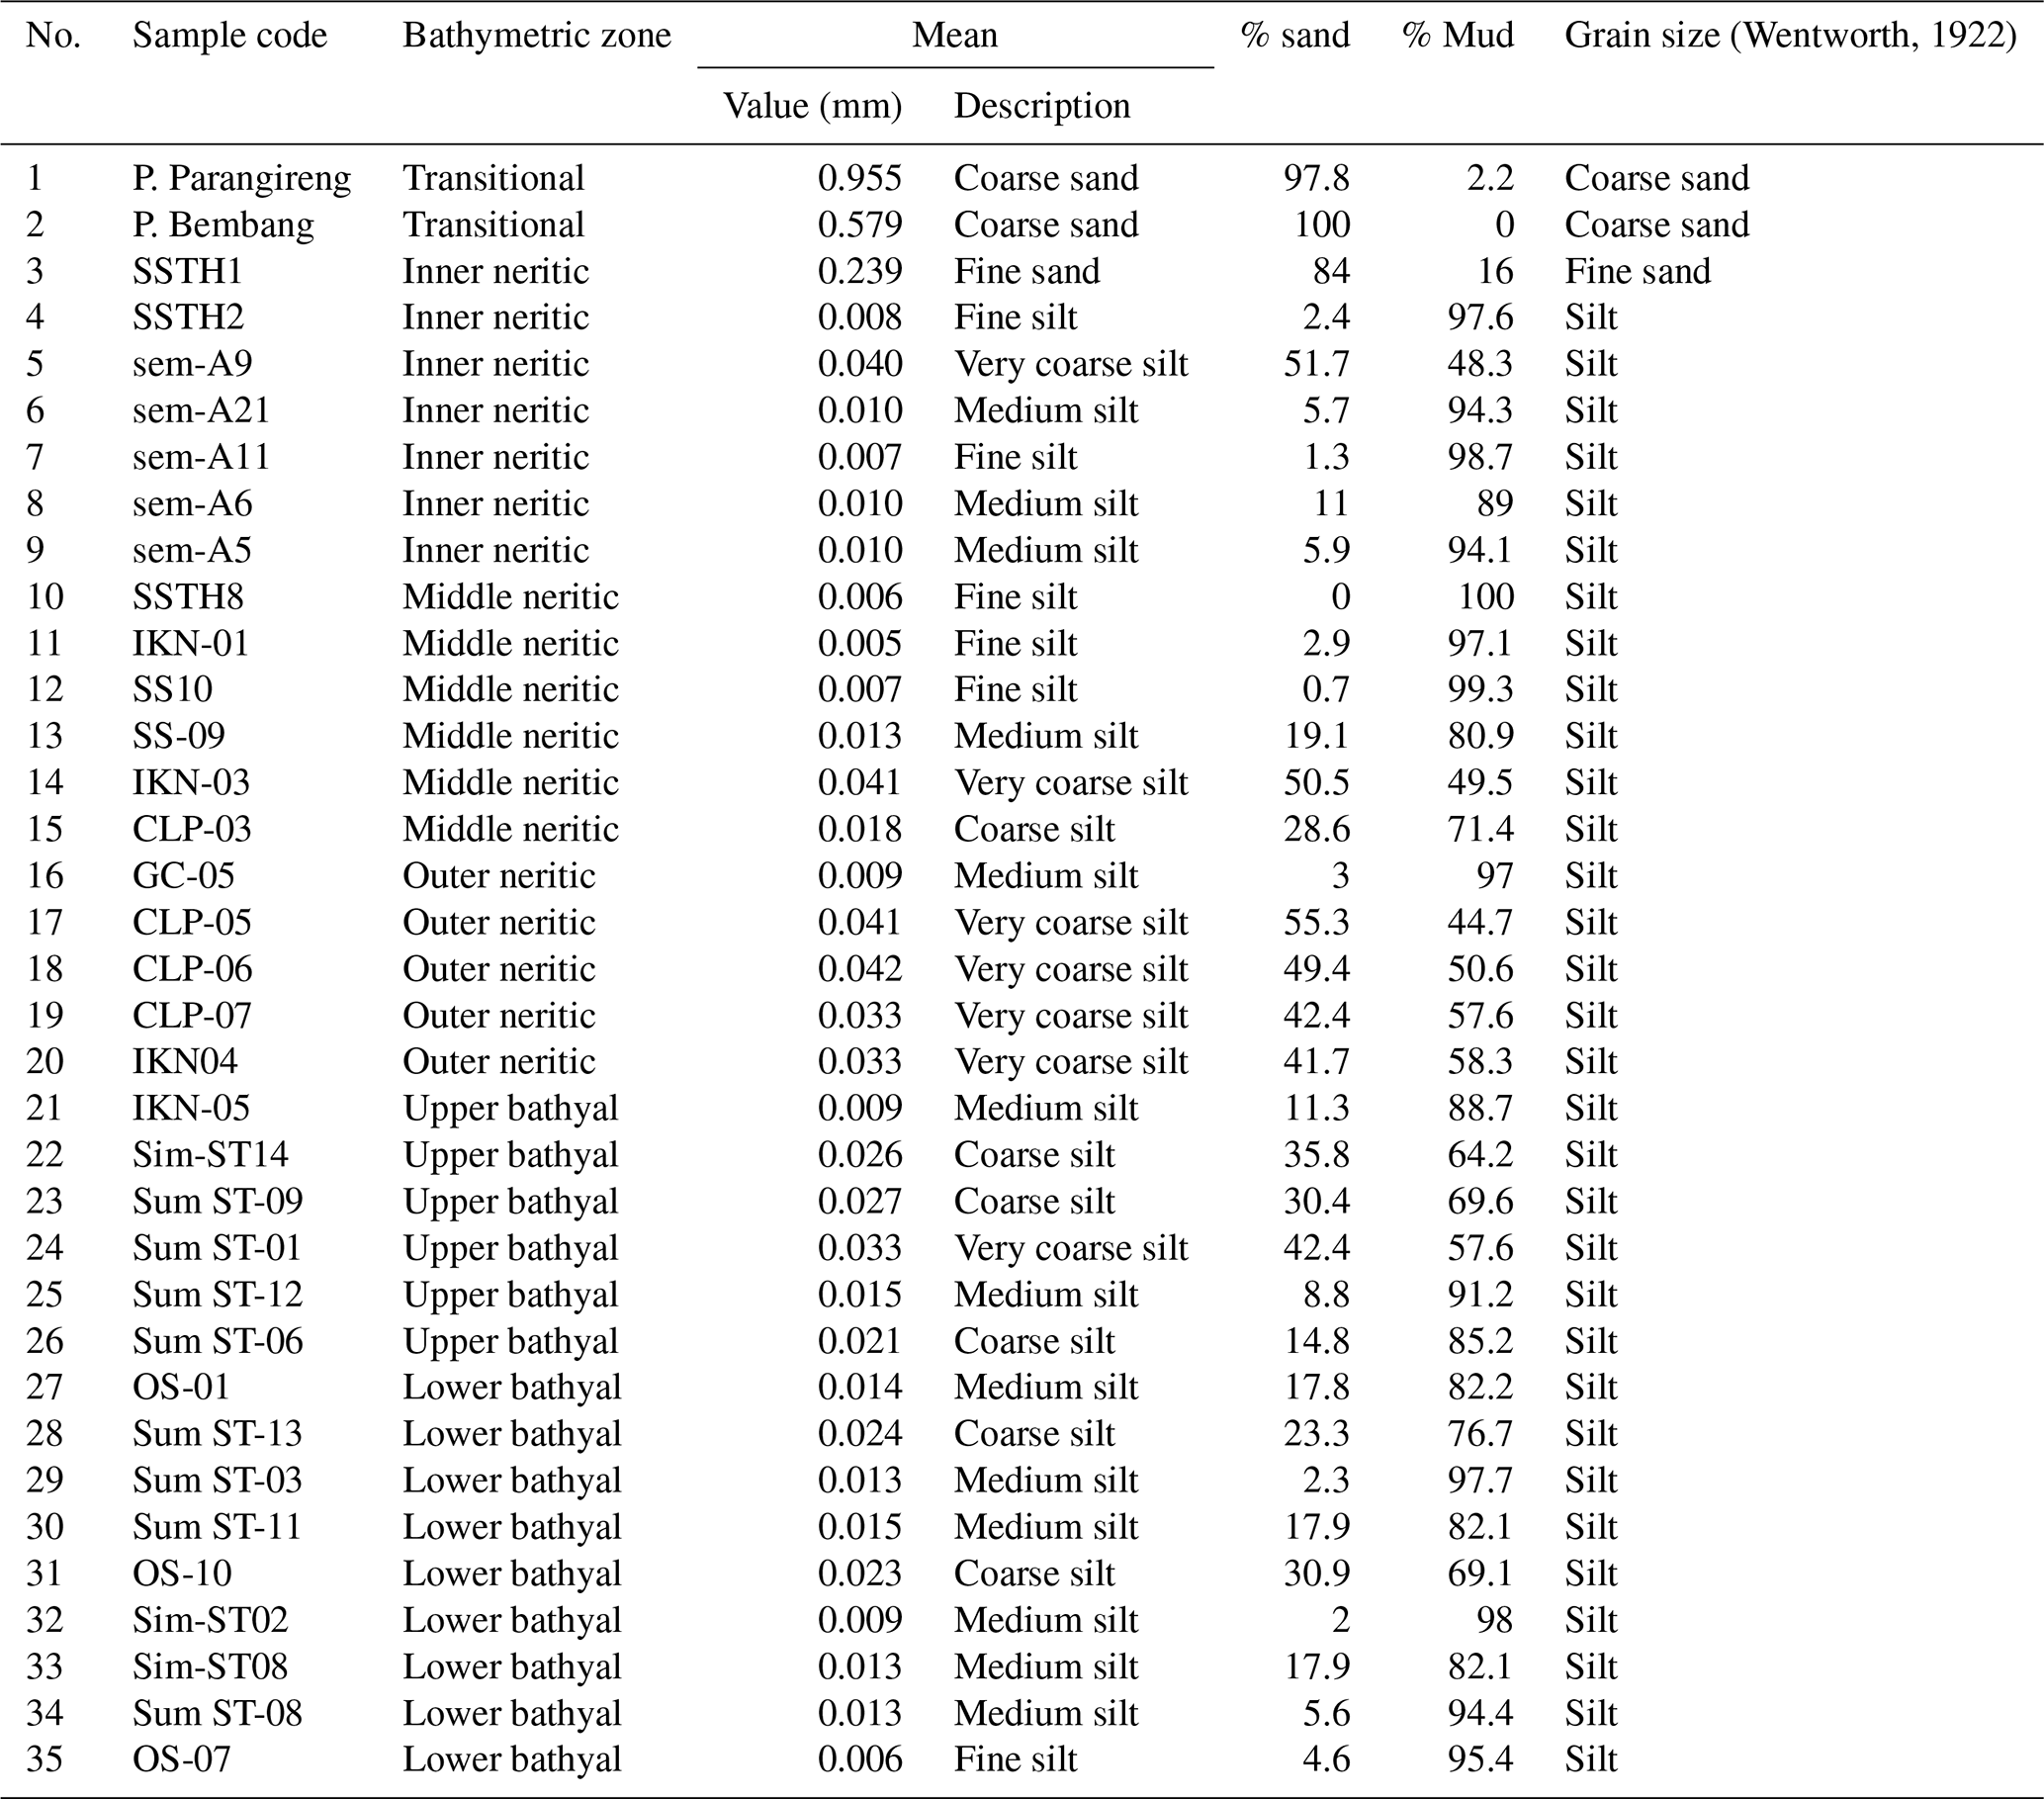
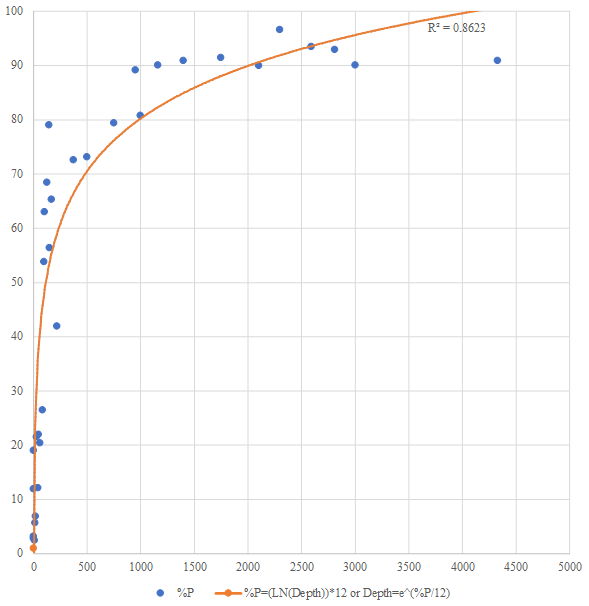
Figure 3Relationship between water depth and planktonic percentage in Indonesian seas. The exponential-growth model demonstrates strong positive correlation (R2=0.86). Equation: %P = ln(depth) × 12 or depth = , where the y axis is the planktonic percentage, and the x axis is the water depth (m).
Sediment analysis in Table 4 revealed a clear trend from coarse sand in transitional environments to predominantly silt in deeper environments. The %P showed a systematic exponential increase with depth, from being nearly absent in transitional environments (0 %–0.6 %) to showing very high values in lower bathyal environments (up to 97 %). Regression analysis of %P versus depth yielded a strong exponential relationship (r2=0.86; Fig. 3), which can be expressed using the exponential-growth model.
Benthic species richness peaked in middle neritic environments, with the maximum of 47 species per sample recorded at 84 m depth (sample no. IKN-03) before declining in deeper waters (Table 3; Fig. 4). In contrast, planktonic species richness increased continuously with depth from 0 to 2 species in transitional environments to a maximum of 17–23 species in lower bathyal settings (Table 3; Fig. 4).
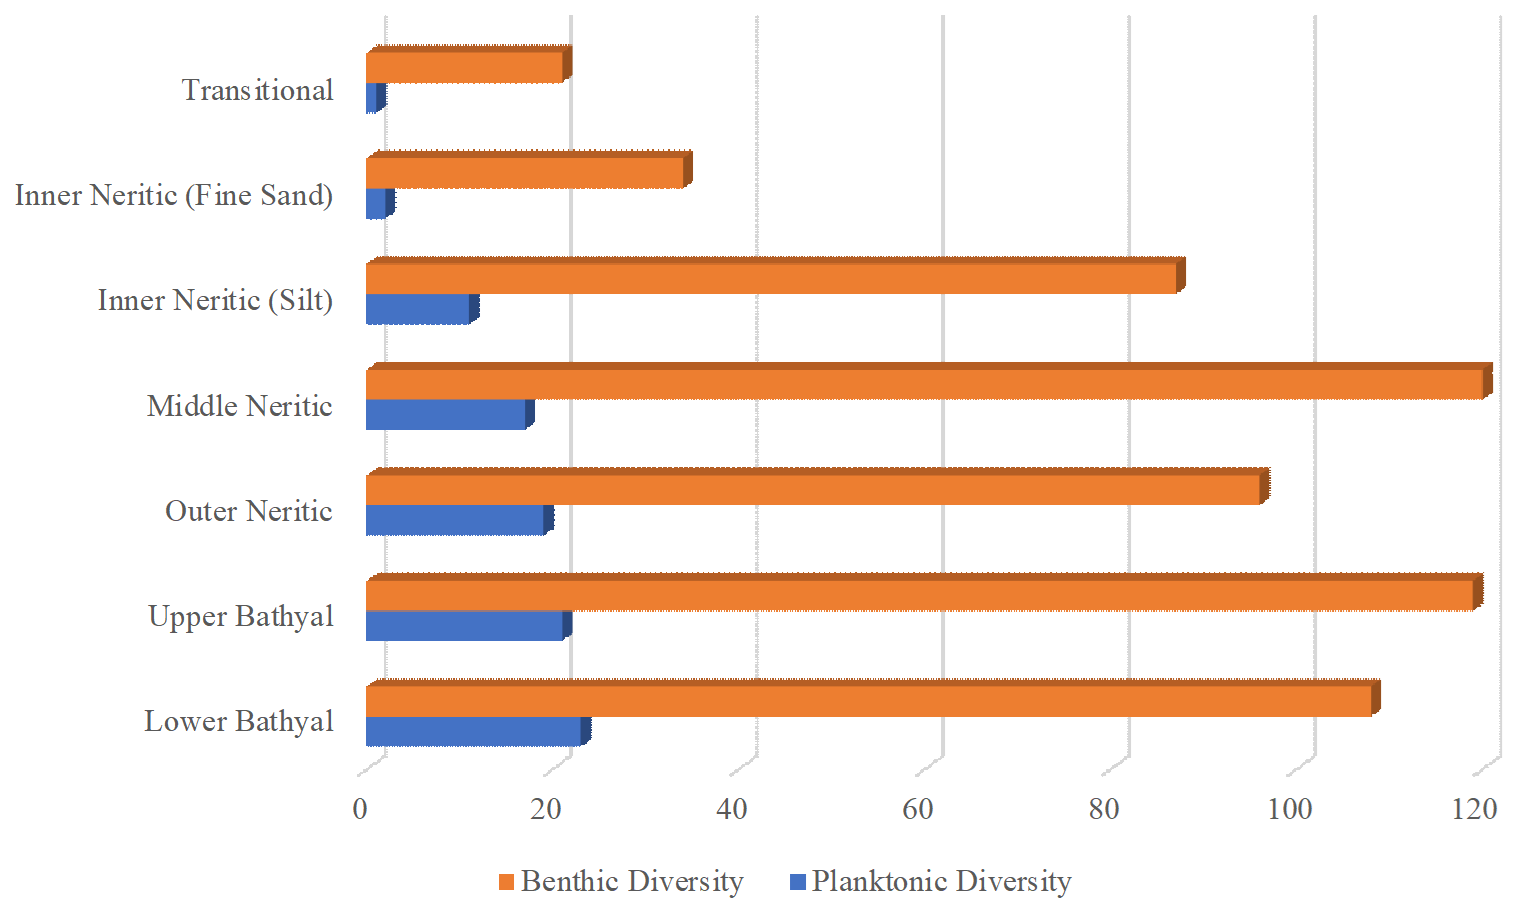
Figure 4Bathymetric trends in foraminiferal species richness across Indonesian seas. Cumulative benthic species richness peaks at middle neritic depths (∼ 120 species) before declining in deeper environments. Planktonic species richness increases continuously with depth. Individual sample richness values are provided in Table 3.
3.2 Statistical analysis results
Hierarchical cluster analysis using Bray–Curtis dissimilarity with average linkage revealed a clear two-level hierarchical structure (Fig. 5). Prior to clustering, samples were ordered by water depth to respect the primary bathymetric gradient controlling foraminiferal distribution. This depth-ordered constraint prevents ecologically implausible groupings while allowing the algorithm to identify assemblage similarities within the bathymetric framework.
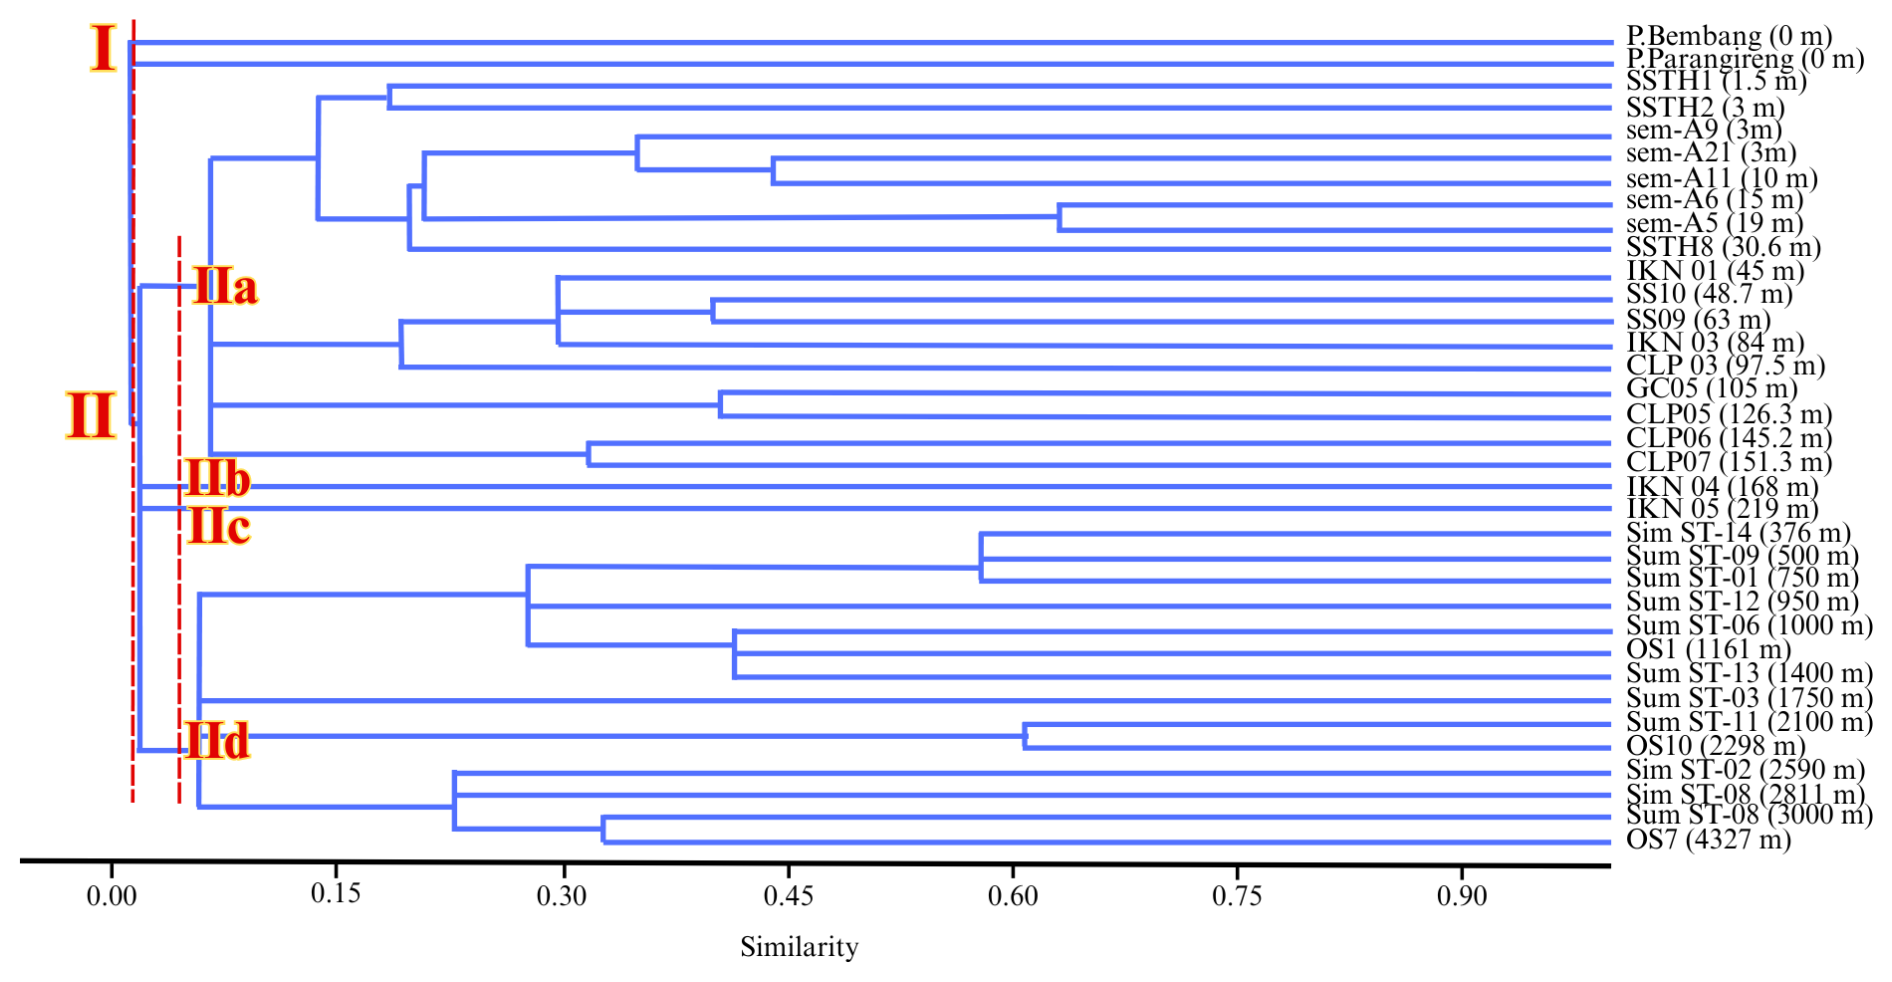
Figure 5Cluster analysis result showing two main clusters corresponding to bathymetric zones, with cluster II subdivided into four subclusters representing transitional to outer neritic environments.
Cluster stability was assessed using cophenetic correlation, where r=0.64 indicates moderate preservation of the original dissimilarity structure, which is typical for complex ecological datasets spanning extreme environmental gradients (Legendre and Legendre, 2012). The ecological validity of the clustering is strongly supported by independent validation: (1) DCA axis 1 shows strong correlation with water depth (r2=0.82, p<0.001), independently confirming depth as the primary structuring gradient; (2) %P increases systematically within the cluster hierarchy (0.63 % in cluster I to >90 % in subcluster IId); (3) IndVal analysis identifies statistically significant indicator species (p<0.05) for each cluster; and (4) cross-tabulation reveals 89 % classification accuracy when comparing cluster assignments to bathymetric zones (Table 3). This multi-method validation demonstrates that the clusters are ecologically robust and paleoenvironmentally meaningful despite moderate dendrogram distortion.
The dendrogram separated samples into two main clusters (Fig. 5). Cluster I comprises exclusively transitional environment samples (P. Bembang and P. Parangireng at 0 m depth), characterized by extremely low %P (0 %–0.6 %) and coarse sand substrates. Cluster II encompasses all deeper samples (1.5–4327 m) and is further subdivided into four subclusters reflecting increasing depth and changing environmental controls.
Subcluster IIa represents the largest and most heterogeneous grouping, containing 18 samples spanning inner neritic to outer neritic (1.5–168 m depth). This subcluster includes all inner neritic samples on both fine-sand (SSTH1, SSTH2) and silt substrates (sem-A9, sem-A21, sem-A11, sem-A6, sem-A5), all middle neritic samples (SSTH8, SS10, SS-09, IKN-01, IKN-03, CLP-03), and all outer neritic samples (GC-05, CLP-05, CLP-06, CLP-07, IKN-04). Despite spanning three bathymetric zones, these samples share compositional similarities reflecting the dominance of shelf environmental conditions with %P ranging from 2.5 % to 79 % (Table 3). The grouping of different neritic zones into a single subcluster reflects the gradual nature of environmental change across the continental shelf, where substrate characteristics and hydrodynamic conditions exert strong control on assemblage composition alongside depth.
Subclusters IIb and IIc each contain single isolated upper bathyal samples (IKN-05 at 219 m and Sim-ST14 at 376 m, respectively). The separation of these samples into distinct subclusters, despite belonging to the same bathymetric zone as some samples in subcluster IId, likely reflects regional oceanographic differences or local environmental heterogeneity such as substrate composition, organic matter flux, or oxygen availability. These isolated positions in the dendrogram highlight the importance of local environmental factors in shaping foraminiferal assemblages beyond simple depth control.
Subcluster IId contains 11 samples spanning upper bathyal to lower bathyal environments (750–4327 m depth), including the remaining upper bathyal samples (Sum ST-06, Sum ST-01, Sum ST-12, Sum ST-09) and all lower bathyal samples (Sum ST-13, Sum ST-11, OS-10, Sim-ST02, Sim-ST08, Sum ST-08, OS-07). This grouping reflects the transition to deep-water assemblages characterized by high %P (81 %–97 %); increased influence of biogeochemical factors (oxygen-minimum zones, organic matter flux); and dominance of characteristic deep-water taxa such as Uvigerina, Bulimina, and Globobulimina.
DCA results (Fig. 6) confirmed depth as the primary control on foraminiferal distribution. Axis 1 (eigenvalue = 0.675) explained the majority of variance and showed a strong correlation with water depth. Samples are distributed from right to left along axis 1, with transitional and shallow environments positioned on the right and bathyal environments on the left. Axis 2 (eigenvalue = 0.180) represents secondary environmental factors, likely reflecting substrate variability, organic carbon supply, and oxygen conditions.
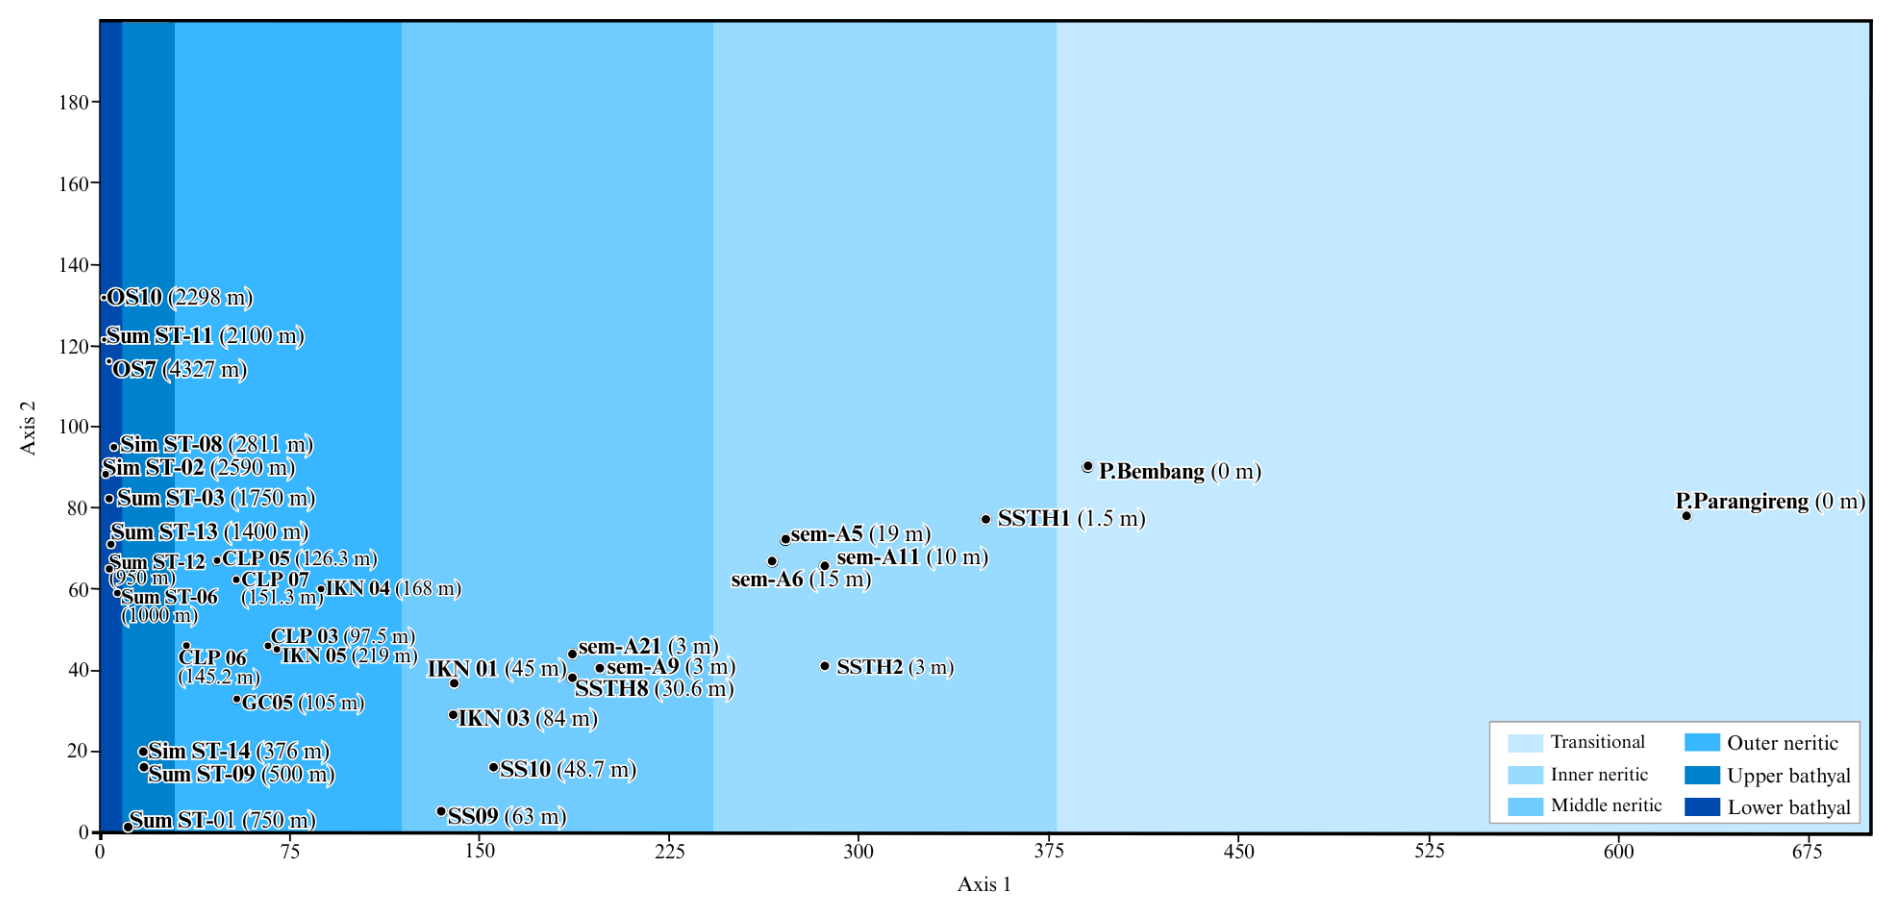
Figure 6DCA ordination showing sample distribution along environmental gradients. Axis 1 (eigenvalue = 0.675) shows strong correlation with water depth, with samples arranged from shallow (right) to deep (left) environments. Axis 2 (eigenvalue = 0.180) represents secondary environmental factors including substrate variability and oxygen gradients.
3.3 Bathymetric zone characteristics
3.3.1 Transitional environment
The transitional environment is characterized by coarse sand substrates (mean grain size of 0.6–1 mm) with more than 97 % sand content (Table 4), reflecting high-energy conditions. The %P is extremely low, ranging from 0 % to 0.6 % (Table 3). Hierarchical cluster analysis grouped these samples into cluster I, which is distinctly separate from all subtidal environments at the highest hierarchical level (Fig. 5). This strong separation reflects the fundamental ecological discontinuity between active beach face environments subject to intense hydrodynamic winnowing and subtidal zones characterized by in situ marine communities.
IndVal analysis identified Amphistegina (55 %), Calcarina (62 %), and Sphaerogypsina (50 %) as the primary indicator genera for this environment, with Amphistegina sp. (99.8 %), Amphistegina lessonii (78 %), Sphaerogypsina sp. (50 %), and Calcarina calcarinoides (50 %) as characteristic species. Benthic foraminiferal species richness in this zone was relatively low (10–16 species per sample; Table 3). It should be noted that only two samples represent the transitional zone, which limits the statistical robustness of the identified indicator species. Considerable additional variability likely exists within this zone. Future sampling efforts should aim to increase sample coverage to better characterize foraminiferal assemblages in transitional environments across the Indonesian seas.
3.3.2 Inner neritic environment
The inner neritic environment exhibited two distinct substrate types with corresponding foraminiferal assemblages, as presented in Table 4. All inner neritic samples belong to cluster 2 (subtidal to deep marine assemblages) and, at a finer hierarchical resolution (similarity cut-off of 0.03), are included within subcluster 2a (shelf complex, 1.5–151 m) (Fig. 5). Areas with fine-sand substrates (84 % sand) show moderate species richness (33 benthic species), while silty substrates (48.3 %–98.7 % mud) display variable richness ranging from 19 to 27 benthic species (Table 3).
On fine-sand substrates, IndVal analysis identified Asterorotalia (97 %), Peneroplis (95 %), Adelosina (94 %), Elphidium (85 %), Operculina (80 %), and Ammonia (70 %) as indicator genera. Characteristic species included Quinqueloculina parkeri (99.9 %), Asterorotalia trispinosa (97 %), and Elphidium hispidulum (95 %). On silty substrates, indicator taxa included Haplophragmoides (67 %), Nonion (66 %), and Edentostomina (33 %) at the genus level and Haplophragmoides sp. (67 %), Nonion boueanum (66 %), and Ammonia tepida (65 %) at the species level. Complete IndVal results for inner neritic assemblages are provided in Tables S2–S3.
The %P remains low (ranging from 2.5 % to 19 %) but shows an increase compared to transitional environments. Benthic species richness increases substantially, while planktonic species richness remains limited with the predominance of globular forms (Globigerinoides, Globigerina).
PCA analysis at the genus level showed PC1 accounting for 96 % of the variance, with Ammonia, Asterorotalia, and Elphidium exhibiting the highest factor loadings. At the species level, PC1 explained 82 % of the variance, with Ammonia sp., Asterorotalia trispinosa, and Elphidium hispidulum showing the highest loadings. PC2 at the species level accounted for 16 % of the variance, with Ammonia tepida, Quinqueloculina seminulum, Elphidium hispidulum, and Ammobaculites agglutinans as major contributors. A detailed PCA analysis for inner neritic environments is provided in Document S1.
3.3.3 Middle neritic environment
The middle neritic environment is characterized by predominantly silty substrates, with mud content generally exceeding 70 % (Table 4). These samples are included in subcluster 2a (shelf complex) together with inner and outer neritic samples (Fig. 5), reflecting gradual environmental transitions across the continental shelf, where physical factors progressively shift toward biogeochemical controls. The %P in this environment showed a significant increase, ranging from 12 % to 54 % (Table 3). Notably, benthic foraminiferal species richness reached its peak in middle neritic environments, with approximately 120 species identified, the highest among all bathymetric zones, while planktonic species richness continues to increase with globular forms still dominant but with increasing occurrence of carinate forms (Globorotalia) and species with cortexes (Pulleniatina).
IndVal analysis identified Bombulina (33 %), Discorbis (33 %), and Nonionella (33 %) as indicator genera, with Quinqueloculina seminulum (50 %) as a characteristic species. Complete IndVal results for middle neritic assemblages are provided in Tables S2–S3. PCA analysis at the genus level revealed PC1 accounting for 98 % of the variance, with Pseudorotalia, Quinqueloculina, Operculina, Cibicides, Ammonia, Brizalina, and Elphidium showing high loadings. At the species level, PC1 explained 97 % of the variance, with Quinqueloculina seminulum, Cibicides sp., Operculina philippinensis, Ammonia beccarii, Pseudorotalia sp., Operculina sp., Quinqueloculina granulocostata, Triloculina tricarinata, and Nonion scaphum as major contributors. A detailed PCA analysis for middle neritic environments is provided in Document S1.
3.3.4 Outer neritic environment
The outer neritic environment is characterized by silty substrates with variable mud content (44.7 %–97 %) (Table 4). Most outer neritic samples are included in subcluster 2a, while two borderline samples (IKN-04 at 168 m and IKN-05 at 219 m) form isolated subclusters 2b and 2c, respectively (Fig. 5). The statistical isolation of these samples reflects the sharp environmental gradient at the continental shelf–slope break where oxygen-minimum zone influence begins and multiple environmental factors change rapidly over short vertical distances. The %P increases substantially (56 %–79 %), indicating a strong influence of open marine conditions. Benthic species richness shows a slight reduction compared to the middle neritic, while planktonic species richness continues to increase with greater representation of carinate forms.
IndVal analysis identified Nonion (77 %), Brizalina (60 %), Gyroidina (55 %), and Cibicides (37 %) as indicator genera. At the species level, Brizalina aenariensis (71 %), Nonion scaphum (62 %), and Gyroidina broeckhiana (52 %) were identified as characteristic taxa. Complete IndVal results for outer neritic assemblages are provided in Tables S2–S3. PCA analysis at the genus level showed PC1 accounting for 99.9 % of the variance, with Brizalina, Amphistegina, Cibicides, and Gyroidina exhibiting the highest factor loadings. At the species level, PC1 explained 99.8 % of the variance, with Brizalina aenariensis, Cibicides sp., Amphistegina papillosa, Gyroidina broeckhiana, and Brizalina robusta showing the highest loadings. Detailed PCA analysis for outer neritic environments is provided in Document S1.
3.3.5 Upper bathyal environment
The upper bathyal environment is characterized by silty substrates with mud content ranging from 58 % to 91 % across individual samples (Table 4). These samples belong to cluster 2 and form part of subcluster 2d at a finer hierarchical resolution (Fig. 5). This bathyal complex is characterized by dominance of biogeochemical environmental controls (oxygen availability, organic matter flux, hydrostatic pressure) and consistently high %P. The %P is high (73 %–89 %). Benthic species richness remains stable compared to the outer neritic, while planktonic species richness increases with a notable shift toward carinate forms (Globorotalia) and species with cortexes (Pulleniatina, Sphaeroidinella).
IndVal analysis identified Uvigerina (70 %), Pyrgo (64 %), Oolina (62 %), and Bulimina (61 %) as indicator genera. At the species level, Bulimina marginata (64 %), Uvigerina asperula (61 %), and Rectobolivina bifrons (59 %) were identified as characteristic taxa. Complete IndVal results for upper bathyal assemblages are provided in Tables S2–S3. PCA analysis at the genus level revealed PC1 accounting for 81 % of the variance, with Brizalina, Uvigerina, Lenticulina, and Bulimina showing the highest loadings. PC2 explained 11 % of variance, dominated by Lenticulina, Hoeglundina, Neouvigerina, Siphogenerina, Uvigerina, Heterolepa, Eponides, Ammobaculites, Dentalina, Pyrgo, Nodosaria, Lagena, Ammonia, Rectobolivina, Brizalina, Bolivinita, and Bulimina. At the species level, PC1 accounted for 54 % of variance, with Uvigerina asperula, Brizalina aenariensis, Brizalina sp., Neouvigerina ampullacea, Lenticulina calcar, Hoeglundina elegans, Uvigerina peregrina, Cassidulina sp., Heterolepa praecincta, Bolivinita subangularis, and Hyalinea balthica as major contributors. PC2 explained 27 % of the variance, featuring Bulimina marginata, Uvigerina asperula, Brizalina sp., Brizalina robusta, Neouvigerina ampullacea, Uvigerina peregrina, Quinqueloculina seminulum, Hoeglundina elegans, Lenticulina calcar, Dentalina sp., Heterolepa praecincta, Siphogenerina columellaris, Eponides sp., Ammobaculites agglutinans, Bolivinita subangularis, Rectobolivina bifrons, Cassidulina sp., and Bolivinita quadrilatera. A detailed PCA analysis for upper bathyal environments is provided in Document S1.
3.3.6 Lower bathyal environment
The lower bathyal environment is characterized by silty substrates with predominantly high mud content (69 %–98 %). These samples are included within subcluster 2d together with upper bathyal samples (Fig. 5), reflecting continuous environmental gradation in deep-water settings where biogeochemical factors dominate assemblage composition. The %P reaches its maximum value, ranging from 90 % to 97 % across individual samples (Table 1). Benthic species richness decreases compared to shallower zones, while planktonic species richness reaches its peak with the dominance of carinate forms and species with cortexes.
IndVal analysis identified Planulina (36 %) and Globobulimina (28 %) as indicator genera. At the species level, Planulina sp. (44 %), Anomalina colligera (41 %), Uvigerina peregrina (37 %), and Globobulimina pacifica (30 %) were identified as characteristic taxa. Complete IndVal results for lower bathyal assemblages are provided in Tables S2–S3. PCA analysis at the genus level showed PC1 accounting for 89 % of the variance, with Uvigerina, Lenticulina, Cibicides, Amphicoryna, Brizalina, Anomalina, Bulimina, Bolivinita, Dentalina, and Planulina exhibiting high factor loadings. PC2 explained 9 % of the variance, dominated by Dentalina, Heterolepa, Cibicides, Hoeglundina elegans, Cancris, Vulvulina, Nodosaria, Lenticulina, Brizalina, Astacolus, Planularia, and Martinotiella. At the species level, PC1 accounted for 71 % of variance, with Uvigerina peregrina, Lenticulina orbicularis, Anomalina colligera, Amphicoryna scalaris, Bolivinita quadrilatera, Planulina ariminensis, Brizalina robusta, Uvigerina sp., Bulimina sp., Globobulimina pacifica, and Brizalina sp. as major contributors. PC2 explained 25 % of variance, featuring Dentalina communis, Cibicides sp., Heterolepa praecincta, Uvigerina asperula, Lenticulina iota, Lenticulina sp., Hoeglundina elegans, Bulimina marginata, Cancris auriculus, Vulvulina pennatula, Nodosaria radicula, Uvigerina schwageri, Amphicoryna hirsuta, Brizalina robusta, Uvigerina sp., and Uvigerina peregrina. A detailed PCA analysis for lower bathyal environments is provided in Document S1.
4.1 Ecological significance of bathymetric zonation
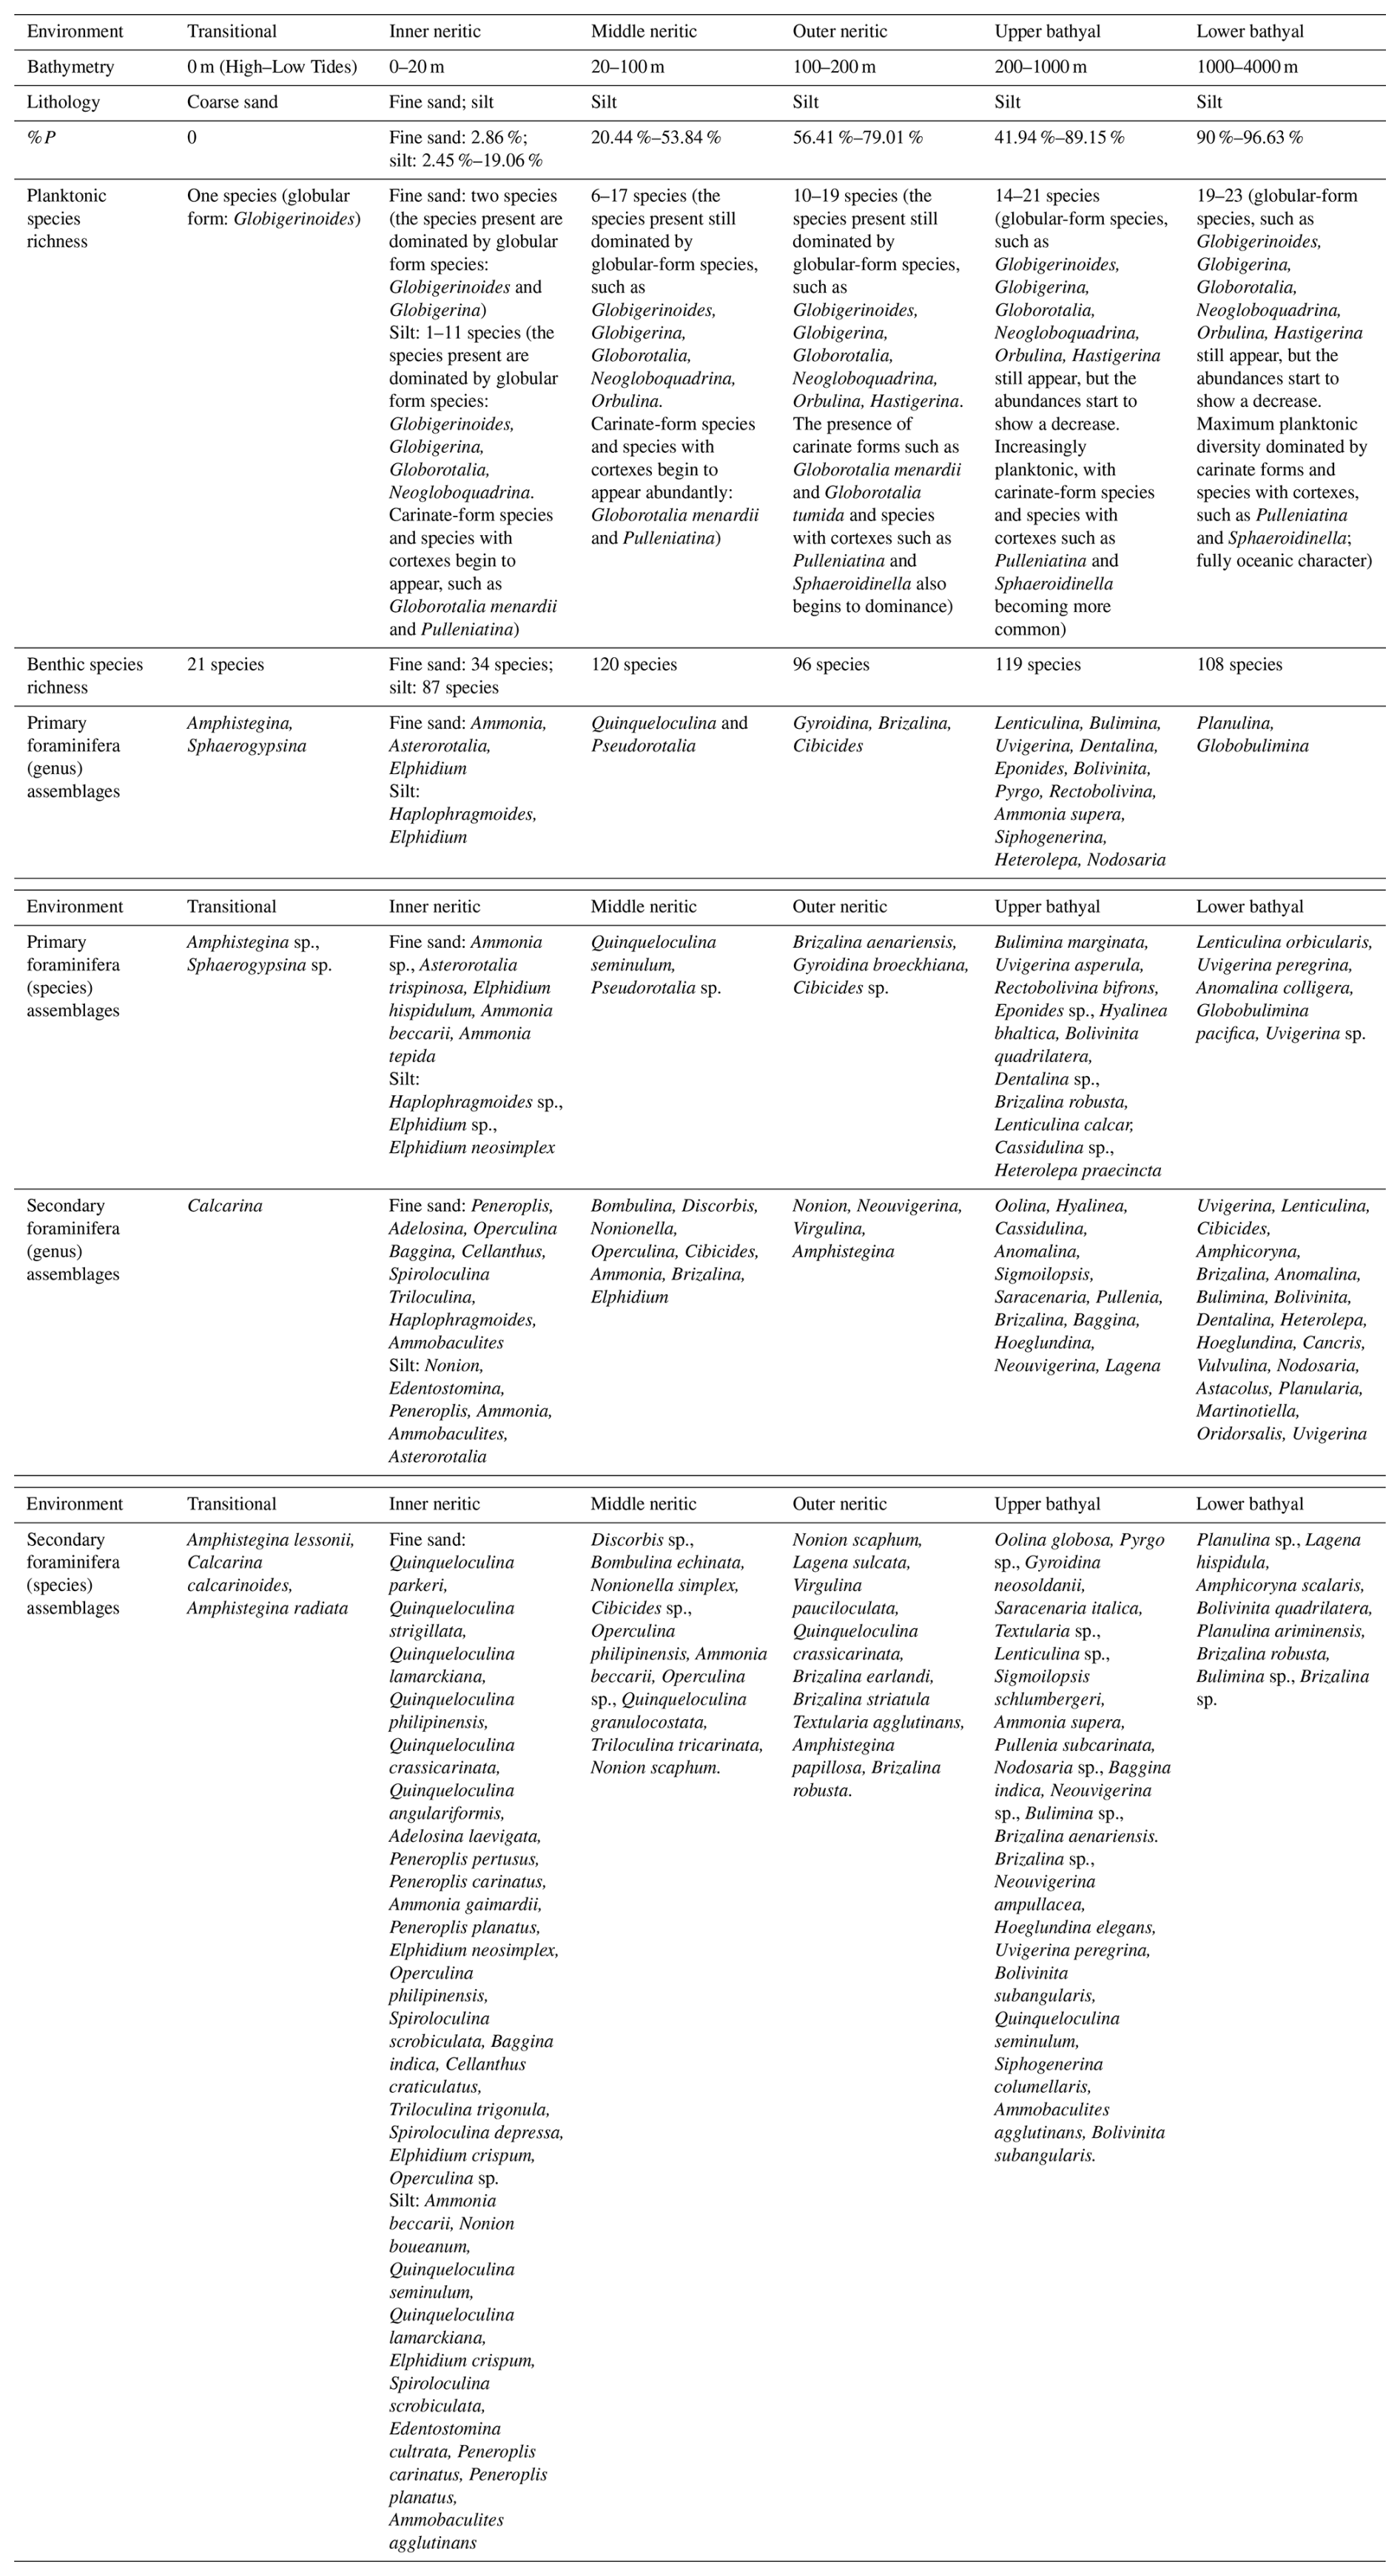
The bathymetric distribution framework established in the study (Table 5) demonstrates a clear ecological stratification of foraminiferal assemblages across depth zones. This zonation pattern reflects adaptations to changing environmental parameters with increasing depth and has important implications for paleoenvironmental interpretations in Indonesian seas specifically.
Table 5Characteristic foraminiferal assemblages and environmental factors for each bathymetric zone in the Indo-Pacific region.
In the transitional environment, the occurrence of Amphistegina and Sphaerogypsina (Fig. 7) carries notable ecological implications as these organisms are characteristically displaced from their original neritic habitats through hydrodynamic transport mechanisms including wave action and current systems (Hohenegger, 2004). Their presence in coarse-sand substrates indicates high-energy environments influenced by strong currents. Renema and Troelstra (2001) similarly observed the dominance of Amphistegina in high-energy environments exhibiting effective water circulation patterns throughout various Indonesian coastal systems. The extremely low %P (0 %–0.6 %) confirms the shallow-water nature of this environment, while the limited species richness (21 benthic species, 1 planktonic species) reflects the physically demanding conditions that limit the number of adapted species. The presence of robust, stress-tolerant foraminifera adaptable to physical disturbance is characteristic of such environments (Murray, 2006). The assemblage represents transported fauna from adjacent inner neritic habitats rather than an in situ community, a critical consideration for paleoenvironmental interpretation. Active hydrodynamic winnowing in this zone preferentially removes fine sediment and less robust tests, concentrating larger, more resistant forms like Amphistegina and Calcarina (Murray, 2006).
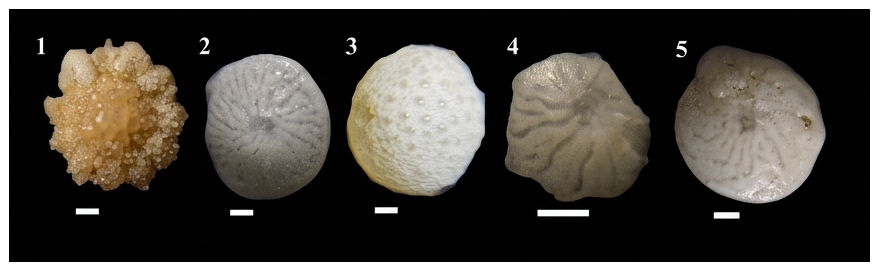
Figure 7Characteristic foraminiferal assemblages present in transitional environments, including both primary and secondary indicator species. All scale bars equate to 100 µm. (1) Calcarina calcarinoides Cheng & Zheng; (2) Amphistegina radiata Fichtel & Moll; (3) Sphaerogypsina, sp.; (4) Amphistegina, sp.; (5) Amphistegina lessonii d'Orbigny.
The inner neritic environment exhibits pronounced community differentiation based on substrate composition, featuring markedly discrete assemblages between fine-sand- and silt-dominated bottom environments. Fine-sand habitats support predominant populations of Ammonia sp., Asterorotalia trispinosa, and Elphidium hispidulum (Fig. 8). These assemblages reflect moderate energy conditions with good water circulation, consistent with the ecological preferences of these taxa as described by Murray (2006), who noted that Asterorotalia typically inhabits well-oxygenated environments with moderate currents, while Elphidium and Ammonia are commonly found in nearshore settings with active water exchange and moderate wave energy (Hayward et al., 2004). In contrast, silt substrates harbor significant populations of agglutinated forms like Haplophragmoides sp. and also Elphidium (Fig. 9), which indicates lower energy settings with higher organic content. According to Murray (2006), agglutinated foraminifera such as Haplophragmoides are typically associated with fine-grained sediments and environments with reduced water circulation, where organic matter accumulation is enhanced.
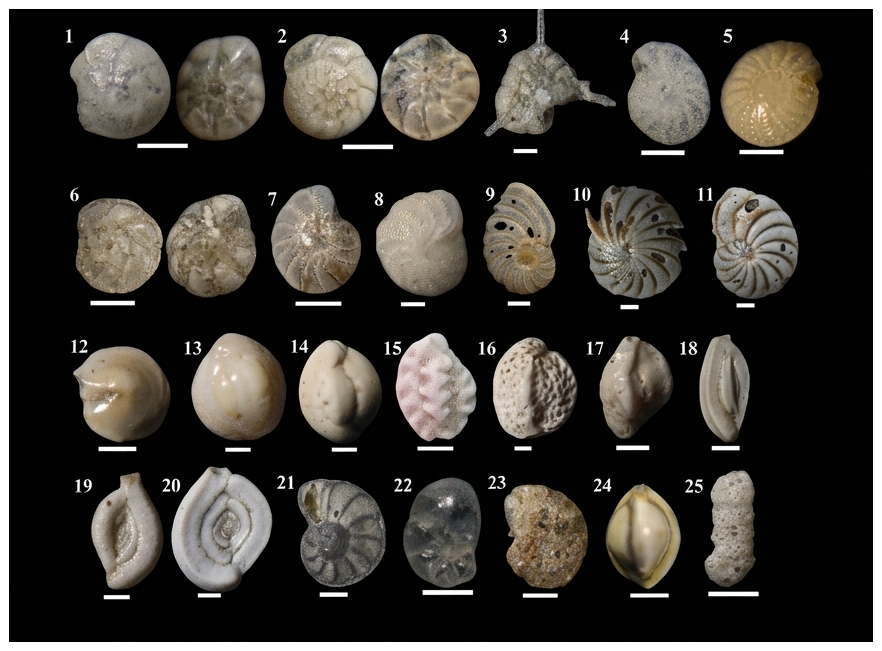
Figure 8Characteristic foraminiferal assemblages present in inner neritic environments with fine-sand substrate, including both primary and secondary indicator species. All scale bars equate to 100 µm. (1) Ammonia beccarii Linnaeus; (2) Ammonia tepida Cushman; (3) Asterorotalia trispinosa Thalmann; (4) Elphidium hispidulum Cushman; (5) Cellanthus craticulatus Fichtel & Moll; (6) Ammonia gaimardi d'Orbigny; (7) Elphidium neosimplex McCulloch; (8) Elphidium crispum Linnaeus; (9) Peneroplis planatus Fichtel & Moll; (10) Peneroplis carinatus d'Orbigny; (11) Peneroplis pertusus Forsskål; (12) Adelosina laevigata d'Orbigny; (13) Quinqueloculina seminulum Linnaeus; (14) Quinqueloculina lamarckiana d'Orbigny; (15) Quinqueloculina parkeri Brady; (16) Quinqueloculina philippinensis Cushman; (17) Quinqueloculina crassicarinata Collins; (18) Quinqueloculina angulariformis McCulloch; (19) Spiroloculina scrobiculata Cushman; (20) Spiroloculina depressa d'Orbigny; (21) Operculina philippinensis Cushman; (22) Baggina indica Cushman; (23) Haplophragmoides sp.; (24) Triloculina tricarinata d'Orbigny; (25) Ammobaculites agglutinans d'Orbigny.
Beyond the primary-characteristic assemblages shown in Figs. 8 and 9, secondary indicators identified through single-method analysis provide additional insights into the environmental complexity of the inner neritic zone. For fine-sand substrates (Fig. 8), secondary indicators include Peneroplis, Adelosina, Operculina, Baggina, Cellanthus, Spiroloculina, Triloculina, Haplophragmoides, and Ammobaculites at the genus level, with species-level secondary indicators encompassing various Quinqueloculina species (Q. parkeri, Q. strigillata, Q. seminulum, Q. lamarckiana, Q. philippinensis, Q. crassicarinata, Q. angulariformis), Adelosina laevigata, Peneroplis species (P. pertusus, P. carinatus, P. planatus), Ammonia gaimardii, Elphidium neosimplex, Operculina species (Operculina sp., O. philippinensis), Spiroloculina species (S. depressa, S. scrobiculata), Baggina indica, Cellanthus craticulatus, Triloculina trigonula, and Elphidium crispum, adapted to moderate-energy sandy environments. For silt substrates (Fig. 10), secondary indicators include Nonion, Edentostomina, Peneroplis, Ammonia, Asterorotalia, and Ammobaculites at the genus level, with corresponding species-level indicators such as Ammonia beccarii, Elphidium (Elphidium sp. E. neosimplex, E. crispum), Haplophragmoides sp., Nonion boueanum, Quinqueloculina (Quinqueloculina sp. (Q. seminulum and Q. lamarckiana), Spiroloculina scrobiculata, Edentostomina cultrata, Peneroplis sp. (P. carinatus and P. planatus), and Ammobaculites agglutinans, reflecting adaptation to lower-energy, fine-grained conditions.
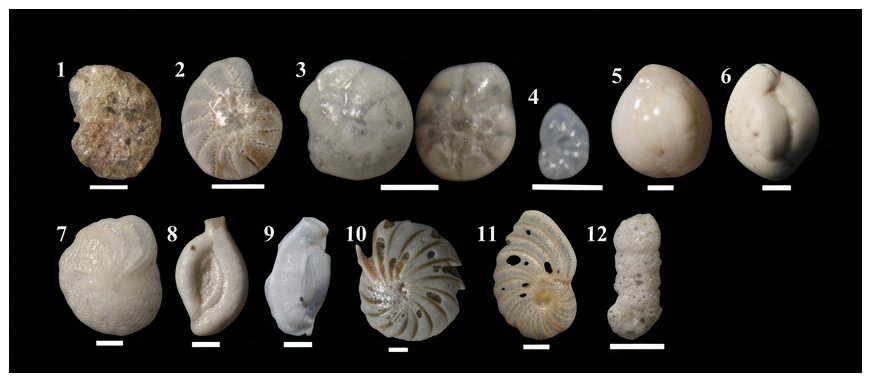
Figure 9Characteristic foraminiferal assemblages present in inner neritic environments with silt substrate, including both primary and secondary indicator species. All scale bars equate to 100 µm. (1) Haplophragmoides sp.; (2) Elphidium neosimplex McCulloch; (3) Ammonia beccarii Linnaeus; (4) Florilus boueanum d'Orbigny; (5) Quinqueloculina seminulum Linnaeus; (6) Quinqueloculina lamarckiana d'Orbigny; (7) Elphidium crispum Linnaeus; (8) Spiroloculina scrobiculata Cushman; (9) Edentostomina cultrata Brady; (10) Peneroplis carinatus d'Orbigny; (11) Peneroplis planatus Fichtel & Moll; (12) Ammobaculites agglutinans d'Orbigny.
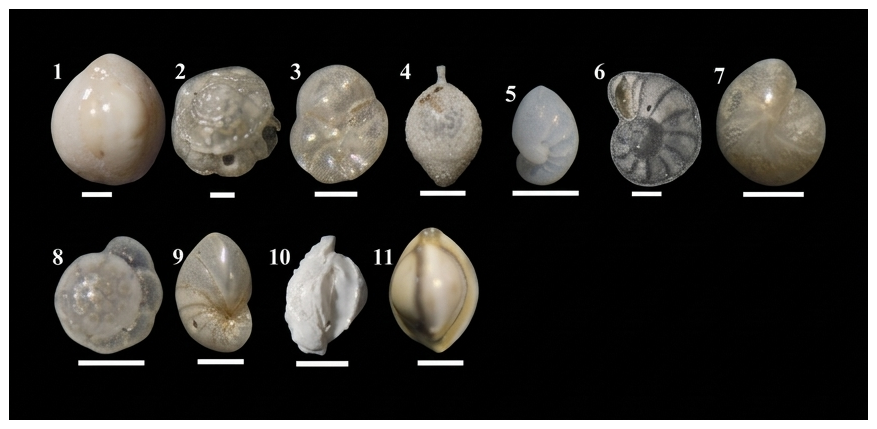
Figure 10Characteristic foraminiferal assemblages present in middle neritic environments, including both primary and secondary indicator species. All scale bars equate to 100 µm. (1) Quinqueloculina seminulum Linnaeus; (2) Pseudorotalia sp.; (3) Discorbis sp.; (4) Bombulina echinata Millett; (5) Nonionella simplex McCulloch; (6) Operculina philippinensis Cushman; (7) Cibicides sp.; (8) Ammonia beccarii Linnaeus; (9) Nonion scaphum Fichtel & Moll; (10) Quinqueloculina granulocostata Germeraad; (11) Triloculina tricarinata d'Orbigny.
This specific substrate distribution within the same depth zone highlights the importance of substrate as a primary controlling factor in shallow marine environments, as demonstrated by Jorissen et al. (2007), who emphasized the fundamental role of sediment texture in determining foraminiferal microhabitat preferences. The increasing but still relatively low %P (3 %–19 %) reflects the limited influence of open marine conditions, which is typical for inner neritic environments according to Van der Zwaan et al. (1990). The increase in benthic species richness compared to transitional environments indicates more stable conditions (Murray, 2006), while the limited planktonic species richness reflects the nearshore position of this zone, where reduced oceanic influence restricts planktonic assemblage development (Bé and Tolderlund, 1971).
The middle neritic environment hosts assemblages dominated by Quinqueloculina seminulum and Pseudorotalia sp. (Fig. 10), indicating more stable marine conditions. These particular taxonomic groups flourish in settings characterized by normal marine salinity and lower energy settings (Murray, 2006). A noticeable sedimentary gradient is observed, transitioning from fine sand in shallower areas to predominantly silt in deeper areas, reflecting decreasing energy conditions with depth (Reading, 1996). This zone represents an ecological optimum for benthic foraminifera, with the highest species richness (120 species) observed across all environments. The moderate %P (12 %–54 %) reflects the increasing influence of open marine conditions (Van der Zwaan et al., 1990), while the increasing planktonic species richness with predominantly globular forms indicates a transitional position between coastal and fully oceanic settings.
Beyond the primary indicators, secondary-characteristic taxa (Fig. 10) for the middle neritic environment include Bombulina, Discorbis, Nonionella, Operculina, Cibicides, Ammonia, Brizalina, and Elphidium at the genus level. Species-level secondary indicators comprise Discorbis sp., Bombulina echinata, Nonionella simplex, Cibicides sp., Operculina philippinensis, Ammonia beccarii, Operculina sp., Quinqueloculina granulocostata, Triloculina tricarinata, and Nonion scaphum. These secondary indicators reinforce the interpretation of stable marine conditions, with normal salinity and good water circulation characteristics.
As depth increases to the outer neritic environment, the assemblage is characterized by Brizalina aenariensis, Gyroidina broeckhiana, and Cibicides sp. (Fig. 11). This transition marks an important ecological threshold where dissolved oxygen concentration begins to emerge as a dominant controlling factor, consistently with the TROX model proposed by Jorissen et al. (1995). The concurrent abundance of Brizalina species, recognized for their adaptation to low-oxygen conditions (Jorissen et al., 1995), alongside Cibicides species, which require higher oxygen levels (Murray, 2006), suggests the presence of diverse microhabitats within this zone. The marked increase in the %P (56 %–79 %) suggests a strong influence of open marine conditions, consistently with Van der Zwaan et al. (1990). In contrast, the slight decline in benthic species richness relative to middle neritic settings points to growing environmental limitations with increasing depth (Murray, 2006). Meanwhile, the continued rise in planktonic species richness, especially the greater presence of carinate forms, further reflects the increasingly oceanic nature of this zone (Schiebel and Hemleben, 2017).
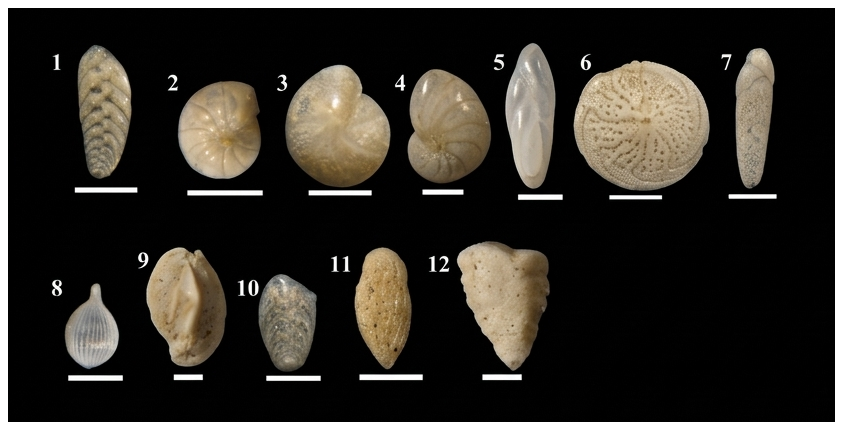
Figure 11Characteristic foraminiferal assemblages present in outer neritic environments, including both primary and secondary indicator species. All scale bars equate to 100 µm. (1) Brizalina aenariensis Costa; (2) Gyroidina broeckhiana Karrer; (3) Cibicides, sp.: (4) Nonion scaphum Fichtel & Moll; (5) Virgulina pauciloculata Brady; (6) Amphistegina papillosa Said; (7) Brizalina earlandi Parr; (8) Lagena sulcata Walker & Jacob; (9) Quinqueloculina crassicarinata Collins; (10) Brizalina robusta Brady; (11) Brizalina striatula Cushman; (12) Textularia agglutinans d'Orbigny.
Beyond the primary indicators, secondary-characteristic taxa shown in Fig. 11 for the outer neritic environment include Nonion, Neouvigerina, Virgulina, and Amphistegina at the genus level. Species-level secondary indicators comprise Nonion scaphum, Lagena sulcata, Virgulina pauciloculata, Quinqueloculina crassicarinata, Brizalina earlandi, Brizalina striatula, Textularia agglutinans, Amphistegina papillosa, and Brizalina robusta. The presence of these secondary indicators supports the interpretations of variable oxygen conditions and increased turbidity that characterize the transition from neritic to deeper environments, reflecting the complex microhabitat species richness within this zone.
The upper bathyal fauna is a diversified association (Fig. 12) suited to silty environments and varying oxygen conditions with increased depth. Infaunal species such as Bulimina marginata and Uvigerina asperula have often been recorded in low-oxygen environments (Jorissen et al., 2007), while the presence of Hyalinea balthica serves as a reliable bathymetric indicator for this depth zone (Van der Zwaan and Jorissen, 1991). The high %P (73 %–89 %) suggests the dominance of open marine conditions (Van der Zwaan et al., 1990). The relatively stable benthic species richness indicates a well-adapted community suited to upper continental slope conditions (Gooday, 2003), while the shift in planktonic assemblages toward carinate forms reflects adaptation to deeper, more oceanic waters (Schiebel and Hemleben, 2017). The increasing importance of infaunal taxa in this zone reflects adaptation to exploit organic matter within sediments under reduced oxygen conditions at the sediment–water interface.
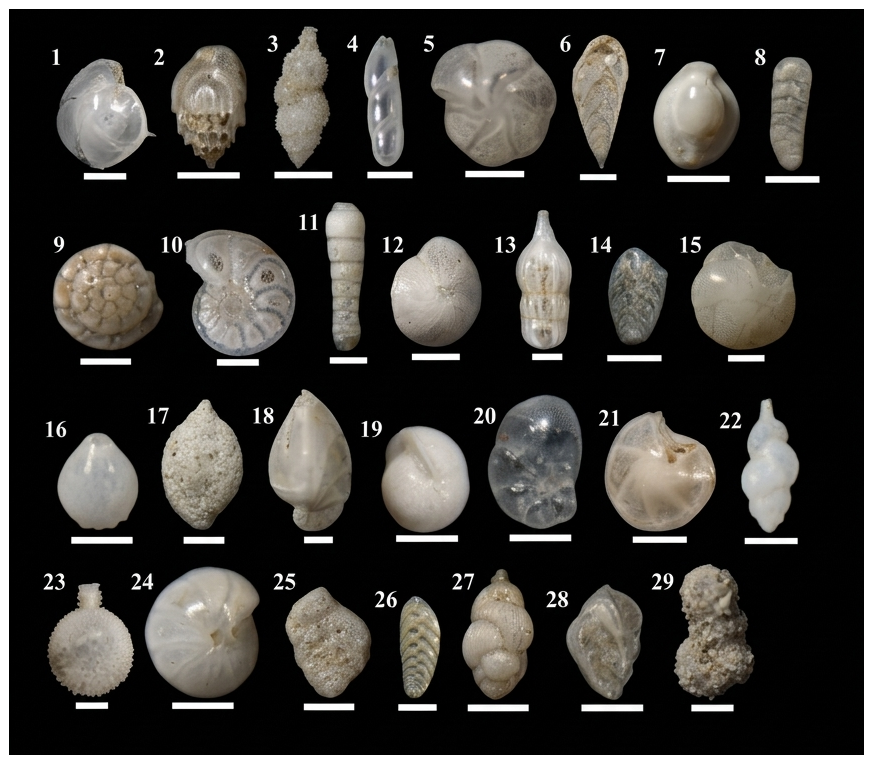
Figure 12Characteristic foraminiferal assemblages present in upper bathyal environments, including both primary and secondary indicator species. All scale bars equate to 100 µm. (1) Lenticulina calcar Linnaeus; (2) Bulimina marginata d'Orbigny; (3) Uvigerina asperula Cžjžek; (4) Dentalina sp.; (5) Eponides sp.; (6) Bolivinita quadrilatera Schwager; (7) Pyrgo sp.; (8) Rectobolivina bifrons Brady; (9) Ammonia supera Beldorf; (10) Hyalinea balthica Schröter; (11) Siphogenerina columellaris Brady; (12) Heterolepa praecincta Karrer; (13) Nodosaria sp.; (14) Brizalina robusta Brady; (15) Cassidulina sp.; (16) Oolina globosa Montagu; (17) Sigmoilopsis schlumbergeri Silvestri; (18) Saracenaria italica Defrance; (19) Pullenia subcarinata d'Orbigny; (20) Baggina indica Cushman; (21) Hoeglundina elegans d'Orbigny; (22) Neouvigerina ampullacea Brady; (23) Lagena hispidula Cushman; (24) Gyroidina neosoldanii Brotzen; (25) Textularia sp.; (26) Brizalina aenariensis Costa; (27) Uvigerina peregrina Cushman; (28) Bolivinita subangularis Brady; (29) Ammobaculites agglutinans d'Orbigny.
The upper bathyal environment shows extensive secondary-characteristic assemblages (Fig. 12), including Oolina, Hyalinea, Cassidulina, Anomalina, Sigmoilopsis, Saracenaria, Pullenia, Brizalina, Baggina, Hoeglundina, Neouvigerina, and Lagena at the genus level. Species-level secondary indicators encompass Oolina globosa, Pyrgo sp., Gyroidina neosoldanii, Saracenaria italica, Textularia sp., Lenticulina sp., Sigmoilopsis schlumbergeri, Ammonia supera, Pullenia subcarinata, Nodosaria sp., Baggina indica, Neouvigerina sp., Bulimina sp., Brizalina aenariensis. Brizalina sp., Neouvigerina ampullacea, Hoeglundina elegans, Uvigerina peregrina, Bolivinita subangularis, Quinqueloculina seminulum, Siphogenerina columellaris, and Ammobaculites agglutinans. This diverse array of secondary indicators reflects the complex environmental gradients present in upper-continental-slope settings, where multiple factors including oxygen availability, organic matter flux, and water mass characteristics interact to shape foraminiferal communities.
In the lower bathyal environment, the dominance of Lenticulina orbicularis, Uvigerina peregrina, and Globobulimina pacifica (Fig. 13) suggests a community highly adapted to deep-sea conditions. Notably, Uvigerina peregrina indicates increased organic matter flux at bathyal depths (Fontanier et al., 2002), while Globobulimina pacifica is adapted to low-oxygen conditions (Jorissen et al., 1995). According to Kaiho (1994), Globobulimina pacifica is particularly tolerant of dysoxic conditions and can penetrate deep into sediments as an infaunal species. The very high %P (90 %–97 %) represents fully oceanic conditions (Van der Zwaan et al., 1990), while the decrease in benthic species richness reflects the increasing environmental constraints of deep-sea habitats (Gooday, 2003). The maximum planktonic species richness, featuring carinate forms and species with cortexes, indicates the fully oceanic character of this zone (Schiebel and Hemleben, 2017).
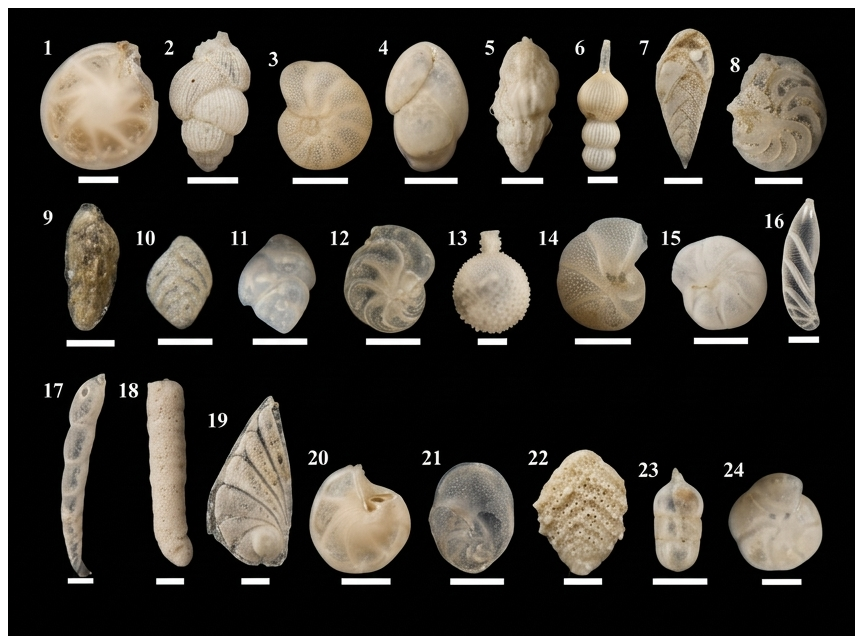
Figure 13Characteristic foraminiferal assemblages present in lower bathyal environments, including both primary and secondary indicator species. All scale bars equate to 100 µm. (1) Lenticulina orbicularis d'Orbigny; (2) Uvigerina peregrina Cushman; (3) Anomalina colligera Chapman & Parr; (4) Globobulimina pacifica Cushman; (5) Uvigerina, sp.; (6) Amphicoryna scalaris Batsch; (7) Bolivinita quadrilatera Schwager; (8) Planulina ariminensis d'Orbigny; (9) Brizalina, sp.; (10) Brizalina robusta Brady; (11) Bulimina, sp.; (12) Planulina, sp.; (13) Lagena hispidula Cushman; (14) Cibicides sp.; (15) Heterolepa sp.; (16) Astacolus sp.; (17) Dentalina communis d'Orbigny; (18) Martinotiella sp.; (19) Planularia sp.; (20) Hoeglundina elegans d'Orbigny; (21) Cancris auriculus Fichtel & Moll; (22) Vulvulina pennatula Batsch; (23) Nodosaria sp.; (24) Oridorsalis umbonatus Reuss.
Secondary indicators of the lower bathyal environment (Fig. 13) include an extensive suite of deep-water adapted genera: Uvigerina, Lenticulina, Cibicides, Amphicoryna, Brizalina, Anomalina, Bulimina, Bolivinita, Dentalina, Heterolepa, Hoeglundina, Cancris, Vulvulina, Nodosaria, Astacolus, Planularia, Martinotiella, and Oridorsalis. At the species level, secondary indicators include Lagena hispidula, Amphicoryna scalaris, Bolivinita quadrilatera, Planulina ariminensis, Brizalina robusta, Bulimina sp., and Brizalina sp. The species richness of secondary indicators in this deepest environment reflects the specialized adaptations required for life in the abyssal–bathyal transition zone, where extreme depth, low-oxygen conditions, and variable organic matter flux create highly selective environmental pressures that determine the composition of deep-sea foraminiferal communities.
4.2 Environmental controls across the bathymetric gradient
A clear transition in controlling environmental factors emerges across the bathymetric gradient. In shallower environments (transitional to middle neritic), physical factors dominate the distribution patterns.
-
Current and wave energies strongly influence the transitional environment, evidenced by coarse substrates; active winnowing; and the prevalence of robust, transported foraminifera. Hydrodynamic processes including wave action, long-shore currents, and storm events control assemblage composition through selective transport and destruction of tests.
-
Substrate type is particularly critical in the inner neritic environment, where two distinct assemblages develop in response to different substrates:
- 1.
On fine-sand substrates, moderate energy conditions support a community dominated by Ammonia sp., Asterorotalia trispinosa, and Elphidium hispidulum, with greater diversity of calcareous forms.
- 2.
On silt substrates, lower energy conditions promote communities dominated by agglutinated taxa like Haplophragmoides sp., reflecting adaptation to finer sediments with potentially higher organic content and reduced oxygen levels. This substrate control overrides depth as the primary environmental determinant in this zone.
- 1.
-
Salinity variations are particularly influential in middle neritic environments, reflected in the dominance of taxa with specific salinity tolerances.
As depth increases (outer neritic to bathyal), biochemical factors become increasingly important:
-
Oxygen content and the type and quantity of organic carbon emerge as the primary controls in outer neritic environments, with the coexistence of taxa requiring different oxygen levels and food structures indicating variable microhabitat conditions. The presence of both oxic-preferring taxa (Cibicides) and dysoxic-tolerant taxa (Brizalina) suggests a mix of species living within different microhabitats, ranging from epifaunal higher oxygen indicators to shallow and deep infaunal species adapted to higher organic carbon supply in low-oxygen or even anoxic nitrate-reducing conditions (Jorissen et al., 1995; Piña-Ochoa et al., 2010).
-
Organic matter flux becomes more significant in bathyal environments, evidenced by the prevalence of infaunal species adapted to utilizing organic detritus within sediments. Taxa like Uvigerina and Bulimina are known to exploit pore water nutrients and organic matter, positioning themselves at optimal depths within the sediment column (Jorissen et al., 2007).
-
Hydrostatic pressure and temperature changes with depth further shape the deep bathyal assemblages, with only specialized taxa capable of tolerating extreme conditions. The decrease in benthic diversity at bathyal depths reflects these increasingly restrictive environmental constraints
The systematic increase in %P with depth (r2=0.86) supports previous work showing that water depth correlates with the proportion of planktonic foraminifera (Van der Zwaan et al., 1990), paralleling vertical variations in oxygen content and productivity. These changes are also reflected in the diversity trends: benthic species richness increases from transitional to middle neritic and then decreases in the deeper bathymetric zones, while planktonic species richness continuously increases, corresponding to the changing environmental parameters associated with increasing depth.
4.3 Implications for paleoenvironmental reconstruction
The recognition of distinct indicator species for each bathymetric zone provides a robust framework for paleoenvironmental interpretations, specifically in Indonesian seas and potentially being applicable to the broader Indo-Pacific region. The well-defined depth-related zonation documented in this study can strengthen the use of fossil assemblages for paleobathymetric inferences, consistently with similar approaches developed by Van der Zwaan et al. (1990) and Murray (2006) for other oceanic regions but calibrated for tropical Indo-Pacific conditions.
The clear separation of cluster I (transitional environment) from all deeper samples demonstrates that transported shallow-water assemblages dominated by Amphistegina and Sphaerogypsina can be reliably distinguished from in situ deeper assemblages. This is particularly important for interpreting fossil deposits where hydrodynamic transport may complicate paleobathymetric reconstruction. The extremely low %P (0 %–0.6 %) and coarse substrates provide additional independent evidence for transitional settings.
The grouping of inner, middle, and outer neritic samples into the single large subcluster IIa, despite covering 1.5–168 m depth, highlights both the utility and limitations of foraminiferal assemblages for fine-scale depth discrimination on continental shelves. This clustering pattern indicates the following.
Substrate variability exerts a strong control on shelf assemblages, sometimes comparable to or exceeding the influence of depth alone. The inclusion of both fine-sand and silty inner neritic samples within the same subcluster demonstrates that different microhabitats at similar depths can host compositionally similar assemblages when controlled for substrate type. It must be noted that our samples were taken from a wide range of locations, and information on local primary productivity, dissolved oxygen, pH, and temperature was not gathered for this study.
Gradual environmental transitions across the shelf create overlapping assemblage characteristics. The progressive increase in %P from inner neritic (2.5 %–19 %) through middle neritic (12 %–54 %) to outer neritic (56 %–79 %) (Table 3) provides a more continuous depth proxy than discrete assemblage breaks.
Multiple lines of evidence should be employed for paleobathymetric reconstruction in shelf settings. While foraminiferal assemblages provide valuable constraints, integration with sedimentological data (grain size, sedimentary structures), taphonomic indicators (fragmentation, abrasion), and quantitative %P yields more robust interpretations.
The indicator species identified through IndVal analysis (Tables S2–S3) remain valuable despite the broad clustering of neritic samples. Taxa such as Asterorotalia and Elphidium in inner neritic environments, Quinqueloculina and Pseudorotalia in middle neritic environments, and Brizalina and Gyroidina in outer neritic environments show statistically significant depth preferences that can distinguish between these environments when considered alongside complementary evidence.
The heterogeneous clustering of upper bathyal samples, with some forming isolated subclusters (IIb, IIc) and others grouping with lower bathyal samples (subcluster IId), underscores the importance of regional oceanographic variability in deep-water environments. This pattern suggests that local factors including oxygen-minimum zone position and intensity (which varies spatially across Indonesian basins, e.g., Sumba Strait vs. Simeulue region), organic matter flux patterns (influenced by surface productivity and current systems), and water mass characteristics (particularly where Indonesian Throughflow creates complex intermediate and deep water circulation) exert a significant control on upper bathyal assemblages, potentially overriding simple depth-related patterns. Paleoenvironmental reconstructions in bathyal settings must therefore consider regional oceanographic context and not rely solely on depth indicator species.
The clear grouping of lower bathyal samples (subcluster IId) with high %P (>90 %) and characteristic taxa (Globobulimina, Planulina, Uvigerina peregrina) demonstrates that deep-water assemblages (>1000 m) are more readily distinguished than shelf assemblages. This likely reflects the stronger environmental gradients (oxygen, pressure, temperature, organic matter availability) that characterize the transition from upper continental slopes to deep basins.
From a methodological perspective, the classification accuracy achieved through hierarchical cluster analysis validates the bathymetric zonation scheme adapted for Indonesian seas. However, primarily involving samples near bathymetric boundaries or in transitional oceanographic settings emphasizes the probabilistic rather than deterministic nature of foraminiferal paleobathymetry. Fossil assemblages should be assigned to depth zones with appropriate uncertainty estimates, and, where possible, multiple samples from stratigraphic sequences should be analyzed to establish robust depth trends rather than relying on single-sample interpretations.
The integration of this regionally calibrated indicator species framework with the quantitative %P–depth relationship (Fig. 3; r2=0.86) provides complementary approaches to paleobathymetric reconstruction: the %P offers continuous depth estimates with defined uncertainty, while indicator species provide qualitative environmental context (substrate, oxygen, energy) that enriches paleoenvironmental interpretation beyond simple water depth.
Finally, the shift from physical environmental controls (wave energy, substrate, salinity) in shallow waters to biogeochemical controls (oxygen, organic matter flux) in deep waters, as evidenced by both cluster analysis patterns and DCA ordination (Fig. 6), is consistent with the applicability of the TROX model (Jorissen et al., 1995) to tropical Indo-Pacific settings. This has important implications for interpreting ancient depositional systems as it suggests that similar depth-related transitions in environmental controls likely operated in past tropical seas. Fossil assemblages can therefore be interpreted not only for water depth but also for the dominant environmental processes (physical vs. biogeochemical) controlling benthic ecosystems at the time of deposition.
This study establishes a comprehensive set of benthic foraminiferal indicator species for different bathymetric zones in Indonesian seas, providing a valuable reference framework for paleoenvironmental reconstructions specifically applicable to the Indonesian seas. The main conclusions are as follows:
-
Each bathymetric zone is characterized by unique foraminiferal assemblages with statistically significant primary indicator species validated through integrated analyses: transitional environments are characterized by Amphistegina and Sphaerogypsina; inner neritic environments show substrate-dependent assemblages (fine-sand substrates dominated by Ammonia sp., Asterorotalia trispinosa, and Elphidium hispidulum and silt substrates characterized by Haplophragmoides sp. and Elphidium); middle neritic environments are dominated by Quinqueloculina seminulum and Pseudorotalia sp.; outer neritic environments feature Brizalina aenariensis, Gyroidina broeckhiana, and Cibicides sp.; upper bathyal environments are characterized by Bulimina marginata, Uvigerina asperula, and Hyalinea balthica; and lower bathyal environments are dominated by Lenticulina orbicularis, Uvigerina peregrina, and Globobulimina pacifica.
-
The %P shows a systematic exponential increase with depth (r2=0.86), from nearly 0 % in transitional environments to over 96 % in lower bathyal environments, confirming utility as a quantitative paleobathymetric indicator in Indonesian seas. The substrate-controlled assemblage variability within the inner neritic represents a critical finding for fossil interpretation. Two distinct communities can develop at identical depths depending on substrate type, requiring integrated sedimentological analysis for accurate paleo-reconstructions. This overrides depth as the primary control in this zone.
-
Primary environmental controls shift systematically from physical factors (wave energy, substrate type, salinity) in shallower environments to biochemical factors (oxygen content, organic matter flux, sediment porewater nitrate availability) in deeper environments, as outlined in the TROX model (Jorissen et al., 1995) in tropical Indo-Pacific settings.
-
Regional specificity of indicator species challenges direct application of temperate-based models to tropical settings. Future paleoenvironmental studies in the Indonesian seas sampled here should incorporate these locally calibrated assemblages rather than relying on Atlantic or Mediterranean frameworks. Cross-region validation would be required before extending these results to the broader Indo-Pacific region.
These findings contribute to an understanding of foraminiferal ecology in tropical environments and provide a robust, quantitatively validated framework for paleoenvironmental reconstructions in the Indo-Pacific region, specifically in Indonesian seas. Further studies using a more integrative approach that involves measuring geochemical parameters in the field are needed. Applying metabolic tracer methods (e.g., Rose Bengal) is crucial to distinguish between living and dead assemblages, thereby minimizing taphonomic biases such as post-mortem transport and time averaging. Additionally, the depth of microhabitats within sediments must be correlated with vertical profiles of geochemical parameters, such as particulate organic matter (POM) flux, dissolved oxygen gradients, and nitrate content. This must be integrated with water column data to strengthen the calibration of indicator species. This will make paleobathymetric and paleoecological reconstructions in the Indonesian region more accurate.
Complete foraminiferal count data and statistical analysis results are provided in the Supplement. The Supplement includes raw species abundance data for all 35 samples (Table S1), IndVal analysis results for all bathymetric zones at the genus and species levels (Tables S2–S3), and detailed PCA analysis interpretations for each environment (Document S1). All statistical analyses were performed using PAST (Paleontological Statistics) software version 4.0. The supplementary dataset is openly available at Zenodo, https://doi.org/10.5281/zenodo.20564462 (Fitriany et al., 2026).
The supplement related to this article is available online at https://doi.org/10.5194/jm-45-487-2026-supplement.
Ria Fitriany designed the research framework, performed the laboratory analyses, conducted the statistical analyses, and prepared the paper. Khoiril Anwar Maryunani was responsible for conceptualization, supervising the research, reviewing the paper, and collecting and providing the samples. Purna Sulastya Putra conducted the fieldwork, collected and provided samples, supervised the research, and reviewed the paper. Septriono Hari Nugroho and Sri Ardhyastuti conducted fieldwork and collected and provided the samples.
The contact author has declared that none of the authors has any competing interests.
Publisher's note: Copernicus Publications remains neutral with regard to jurisdictional claims made in the text, published maps, institutional affiliations, or any other geographical representation in this paper. The authors bear the ultimate responsibility for providing appropriate place names. Views expressed in the text are those of the authors and do not necessarily reflect the views of the publisher.
The author expresses deep appreciation to the National Research and Innovation Agency (BRIN) of Indonesia for providing the sediment samples and laboratory facilities. Additionally, the author would like to thank Micropaleontology Laboratory at the Institut Teknologi Bandung for providing the facilities and support for foraminifera analysis.
This research was supported by the PPMI FITB 2026 Program from the Faculty of Earth Sciences and Technology (FITB), Insitut Teknologi Bandung (ITB), under grant number 2235/IT1.B07.1/TA.00/2026 and Indonesian Education Scholarship, Center for Higher Education Funding and Assessment, and Indonesian Endowment Fund for Education, with contract no. 00758/J5.2.3/BPI.06/9/2022.
This paper was edited by Sev Kender and reviewed by Peter Lunt, Stephen Culver, and one anonymous referee.
Barker, R. W.: Taxonomic Notes, Soc. Econ. Paleontol. Mineral., Spec. Publ., 9, https://doi.org/10.2110/pec.60.01.0002, 1960.
Bé, A. W. H. and Tolderlund, D. S.: Distribution and ecology of living planktonic foraminifera in surface waters of the Atlantic and Indian Oceans, in: The Micropaleontology of Oceans, edited by: Funnel, B. M. and Riedel, W. R., Cambridge University Press, Cambridge, 105–149, ISBN 0521076420, 1971.
Bolli, H. M. and Saunders, J. B.: Plankton Stratigraphy, Cambridge University Press, New York, https://doi.org/10.1017/CBO9780511536762, 1985.
Dewi, K. T. and Darlan, Y.: Distribusi foraminifera pada sedimen permukaan di Laut Arafura, Indonesia, J. Geol. Kelautan, 6, 28–38, 2008.
Dufrêne, M. and Legendre, P.: Species assemblages and indicator species: the need for a flexible asymmetrical approach, Ecol. Monogr., 67, 345–366, https://doi.org/10.2307/2963459, 1997.
Fitriany, R., Maryunani, K. A., Putra, P. S., Nugroho, S. H., and Ardhyastuti, S.: Supplementary data supporting the paper entitled Benthic Foraminiferal Assemblages as Proxies for Paleoenvironmental Indicators in the Indo-Pacific (Indonesia), Zenodo, https://doi.org/10.5281/zenodo.20564462, 2026
Fontanier, C., Jorissen, F. J., Licari, L., Alexandre, A., Anschutz, P., and Carbonel, P.: Live benthic foraminiferal faunas from the Bay of Biscay: faunal density, composition, and microhabitats, Deep-Sea Res. Pt. I, 49, 751–785, https://doi.org/10.1016/S0967-0637(01)00078-4, 2002.
Geospatial Information Agency: Indonesia National Bathymetric Map, https://tanahair.indonesia.go.id/portal-web/unduh/batnas (last access: 28 June 2025), 2025.
Gooday, A. J.: Benthic foraminifera (Protista) as tools in deep-water palaeoceanography: Environmental influences on faunal characteristics, Adv. Mar. Biol., 46, 1–90, https://doi.org/10.1016/S0065-2881(03)46002-1, 2003.
Gordon, A. L.: Oceanography of the Indonesian Seas and their throughflow, Oceanography, 18, 14–27, https://doi.org/10.5670/oceanog.2005.01, 2005.
Hammer, Ø., Harper, D. A. T., and Ryan, P. D.: PAST: Paleontological Statistics Software Package for Education and Data Analysis, Palaeontol. Electron., 4, 9 pp., https://palaeo-electronica.org/2001_1/past/issue1_01.htm (last access: 23 June 2026), 2001.
Hayward, B. W., Holzmann, M., Grenfell, H. R., Pawlowski, J., and Triggs, C. M.: Morphological distinction of molecular types in Ammonia – towards a taxonomic revision of the world's most commonly misidentified foraminifera, Mar. Micropaleontol., 50, 237–271, https://doi.org/10.1016/S0377-8398(03)00074-4, 2004.
Hill, M. O. and Gauch, H. G.: Detrended correspondence analysis: An improved ordination technique, Vegetatio, 42, 47–58, https://doi.org/10.1007/BF00048870, 1980.
Hohenegger, J.: Depth coenoclines and environmental considerations of western Pacific larger foraminifera, J. Foramin. Res., 34, 9–33, https://doi.org/10.2113/0340009, 2004.
Ingle, J. C.: Cenozoic paleobathymetry and depositional history of selected sequence within the Southern California Continental Borderland, Chusman Fondation Special Publication, 19, 163–195, 1980.
Jorissen, F. J., de Stigter, H. C., and Widmark, J. G. V.: A conceptual model explaining benthic foraminiferal microhabitats, Mar. Micropaleontol., 26, 3–15, https://doi.org/10.1016/0377-8398(95)00047-X, 1995.
Jorissen, F. J., Fontanier, C., and Thomas, E.: Paleoceanographical proxies based on deep-sea benthic foraminiferal assemblage characteristics, in: Proxies in Late Cenozoic Paleoceanography, edited by: Hillaire-Marcel, C. and de Vernal, A., Elsevier, Amsterdam, 263–325, https://doi.org/10.1016/S1572-5480(07)01012-3, 2007.
Kaiho, K.: Benthic foraminiferal dissolved-oxygen index and dissolved-oxygen levels in the modern ocean, Geology, 22, 719–722, https://doi.org/10.1130/0091-7613(1994)022<0719:BFDOIA>2.3.CO;2, 1994.
Legendre, P. and Legendre, L.: Numerical Ecology, 3rd edn., Elsevier, Amsterdam, 990 pp., ISBN 9780444538680, 2012.
Loeblich, A. R. and Tappan, H.: Foraminiferal Genera and Their Classification, Van Nostrand Reinhold, New York, 970 pp., https://doi.org/10.1007/978-1-4899-5760-3, 1988.
Loeblich, A. R. and Tappan, H.: Foraminifera of the Sahul Shelf and Timor Sea, Cushman Foundation for Foraminiferal Research Special Publication No. 31, Cambridge, 661 pp., ISBN 9781970168204, 1994.
McCulloh, I.: Qualitative Observations on Recent Foraminiferal Tests with Emphasis on the Eastern Pacific, University of Southern California, Los Angeles, https://doi.org/10.2307/1485373, 1977.
Murray, J. W.: Ecology and Applications of Benthic Foraminifera, Cambridge University Press, Cambridge, 426 pp., https://doi.org/10.1017/CBO9780511535529, 2006.
Natsir, S. M.: Kelimpahan foraminifera resen pada sedimen permukaan di Teluk Jakarta, J. Ilmu dan Teknol. Kelautan Tropis, 2, 10–18, 2010.
Piña-Ochoa, E., Høgslund, S., Geslin, E., Cedhagen, T., Revsbech, N. P., Nielsen, L. P., Schweizer, M., Jorissen, F., Rysgaard, S., and Risgaard-Petersen, N.: Widespread occurrence of nitrate storage and denitrification among Foraminifera and Gromiida, P. Natl. Acad. Sci. USA, 107, 1148–1153, https://doi.org/10.1073/pnas.0908440107, 2010.
Postuma, J. A.: Manual of Planktonic Foraminifera, Elsevier Publishing Company, Amsterdam, 420 pp., ISBN 0444409092, 1971.
Putra, P. S. and Nugroho, S. H.: Distribusi foraminifera bentonik dan hubungannya dengan sedimen di Selat Sumba, Indonesia, J. Geol. Kelautan, 17, 51–64, 2019.
Reading, H. G.: Sedimentary Environments: Processes, Facies and Stratigraphy, 3rd edn., Blackwell Science, Oxford, 688 pp., ISBN 9781118687635, 1996.
Renema, W.: Terrestrial influence as a key driver of spatial variability in large benthic foraminiferal assemblage composition in the Central Indo-Pacific, Earth Sci. Rev., 177, 514–544, https://doi.org/10.1016/j.earscirev.2017.12.013, 2018.
Renema, W. and Troelstra, S. R.: Larger foraminifera distribution on a mesotrophic carbonate shelf in SW Sulawesi (Indonesia), Palaeogeogr. Palaeocl., 175, 125–146, https://doi.org/10.1016/S0031-0182(01)00389-3, 2001.
Schiebel, R. and Hemleben, C.: Planktic Foraminifers in the Modern Ocean, Springer, Berlin, 358 pp., https://doi.org/10.1007/978-3-662-50297-6, 2017.
Tipsword, H. L., Setzer, F. M., and Smith Jr., F. M.: Interpretation of depositional environment in Gulf Coast petroleum exploration from paleoecology and related stratigraphy, Trans. Gulf Coast Ass. Geol. Soc., 16, 119–130, 1966.
Van der Zwaan, G. J. and Jorissen, F. J.: Biofacial patterns in river-induced shelf anoxia, in: Modern and Ancient Continental Shelf Anoxia, edited by: Tyson, R. V. and Pearson, T. H., Geological Society Special Publication 58, London, 65–82, https://doi.org/10.1144/GSL.SP.1991.058.01.05, 1991.
Van der Zwaan, G. J., Jorissen, F. J., and de Stigter, H. C.: The depth dependency of planktonic/benthic foraminiferal ratios: Constraints and applications, Mar. Geol., 95, 1–16, https://doi.org/10.1016/0025-3227(90)90016-D, 1990.
van Morkhoven, F. P. C. M., Berggren, W. A., and Edwards, A. S.: Cenozoic cosmopolitan deep-water benthic foraminifera, Bull. Centres Rech. Explor, Mem. 11, 421 pp., ISBN 2901026206, 1986.
Wentworth, C. K.: A scale of grade and class terms for clastic sediments, J. Geol., 30, 377–392, https://doi.org/10.1086/622910, 1922.